Disks at High Redshift: Interactions, Mergers, and Starbursts
Abstract
Do disk galaxies exist at redshifts much greater than unity, and how might they look different from local disks? How does the morphological mix of galaxies change with redshift? What can we learn from current observations about the properties of high redshift galactic disks? I present theoretical predictions based on semi-analytic hierarchical models, focussing on the role played by interactions, mergers, and starbursts in determining the observable properties of disk galaxies at high redshift, and discuss the interpretation of high redshift observations of possible proto-disks (damped Lyman- systems and Lyman-break galaxies) in light of these predictions.
Institute of Astronomy, University of Cambridge, Madingley Rd., Cambridge, UK CB3 0HA
1. Introduction
Very little is known about the properties of disk galaxies at redshifts larger than about unity; even whether they exist at all. The high redshift universe is a rather dangerous place for galactic disks, which are relatively fragile objects. Mergers are more frequent at early times, and the characteristic gas fractions and internal densities of early objects are high. Are violent mergers so frequent at high redshift that they destroy most or all disks? Are high redshift disks more or less susceptible to bar instabilities than local disks?
Before we begin to discuss theoretical answers to these questions, based on the currently accepted paradigm of disk formation within a hierarchical universe, let us address a semantic and practical question — what do we mean by a “disk” galaxy, and how do we know one when we see it? The defining feature of a “true” disk is fundamentally kinematical: disks are objects that are flattened and supported by rotation. In the nearby universe, we can obtain direct observational measures of galaxy kinematics and (in principle) determine unambiguously whether an object is a disk or not. However, these observations become increasingly difficult as one pushes to high redshift. A small sample of disk galaxies with observed rotation curves extends out to a redshift of about unity (the current record holder is at ; N. Vogt, private communication). For the moment, and probably for the near future, if we wish to identify disks at still higher redshifts, we will be forced to rely on more indirect observational evidence.
For example, we know that in the local universe, if we select galaxies by their morphology (spirals and irregulars), or the shape of their light profiles (exponential), or those that have blue colors or strong emission lines, we will end up with a sample that consists mostly of “true” disks. However, by some of these conditions, some interlopers (starbursts?) might creep in, and some “true” disk galaxies (early-type spirals and lenticulars) might be left out. It is unclear whether these empirical associations will remain useful at high redshift. None the less, I will discuss what they might tell us about the Lyman-break galaxy population (e.g. Steidel et al. 1999). Another intriguing kind of observation is the kinematic data from unsaturated, low-ionization-state metal lines in high column density quasar absorption systems (damped Lyman- systems (DLAS); Prochaska & Wolfe 1997, 1998). These absorption profiles may provide kinematic information about gaseous disks at high redshift; however, as I discuss in Section 3, interpreting these data may be complicated.
2. Mergers and Morphological Evolution of Disks

In this section I discuss some predictions from a semi-analytic model representing the main features of the currently standard paradigm of disk formation. In this paradigm, dark matter halos acquire angular momentum from tidal torques at early times. Hot gas contained in these halos is assumed to initially possess the same specific angular momentum as the halo, and to conserve it as it cools and collapses to form a rotationally supported, exponential disk. If the resulting disk is locally unstable (Toomre ), it will quickly fragment into many dense knots. If it is globally unstable (Toomre ), it will form a bar and perhaps a bulge. Subsequently, these disks may be destroyed by major mergers (defined here as an encounter between objects with a mass ratio of 0.3 or greater). Morphological evolution toward ‘earlier’ type disks can also be driven by minor mergers, which can drive gas inflows, leading to nuclear starbursts that may build central bulge-like structures (Mihos & Hernquist 1994a).
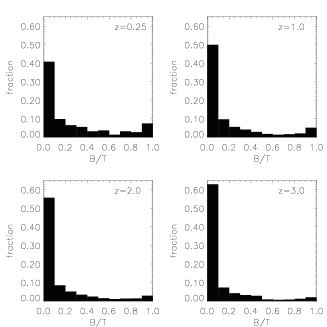
Fig. 1a shows the distribution of the bulge-to-total ratio of stellar mass at various redshifts for galaxies produced by such a model 111The model shown is based on the models described in Somerville & Primack (1999), with more realistic disk formation included using an approach similar to that of Mo, Mao & White (1998).. As time progresses, disky galaxies are gradually transformed into more bulge-dominated galaxies, and the distribution changes shape noticeably — however, the net effect is not dramatic. Recall that although disks are constantly being destroyed by mergers, hot gas is also continuously cooling and forming new disks. Thus an individual galaxy can move in either direction along the Hubble sequence over time222Note that I have selected model galaxies with rest-frame absolute I-band magnitudes (AB) brighter than (where km/s/Mpc)). Had I instead selected galaxies according to their observed frame apparent magnitude, as in a flux-limited survey, the trend would have been washed out by the inclusion of more intrinsically faint galaxies (which tend to have low values) at low redshifts. This illustrates the importance of sample selection in assessing observational trends..
Fig 1 shows the fraction of bright galaxies (rest-frame ) that are disk-dominated () as a function of redshift. The overall fraction of disk galaxies defined in this way increases only moderately with redshift, from 65 percent at to 80 percent at . This summarizes the interplay between disk destruction (and spheroid production) by major mergers and growth of new disks by gas cooling and star formation. We have not yet considered the fact that some of these disks might be so distorted that they would not satisfy our usual morphological criteria, or that they might be spontaneously bar-unstable, which could lead to secular formation of a bulge. Therefore I have also shown the fraction of these galaxies that are formally unstable to bar formation, according to the condition , as defined by Efstathiou, Lake, & Negroponte (1982) and used in the disk models of Mo et al. (1998). This is in reasonable accord with observations at low redshift, which suggest that one-third to one-half of all galaxies are barred, especially since I have neglected the stabilizing influence of pre-existing bulges, so the fraction of unstable disks may have been over-estimated, particularly at lower redshifts. The fraction of bar-unstable galaxies is predicted to be approximately constant with redshift333Again, the sample selection is important. In a flux-limited sample, there is a decrease in the fraction of bar-unstable disks with increasing redshift, which again is due to the inclusion of more small galaxies (which tend to be bar-unstable) at lower redshifts.. In addition, the fraction of disk galaxies that have experienced a recent merger is shown as a function of redshift. I use two definitions of “recent”; in one, a fixed timescale of 0.5 Gyr, and another, a time span of 10 times the internal dynamical time of the galaxy. Based on experience with N-body simulations, these are galaxies that are likely to show morphological signatures of disturbance, as well as starburst and possibly AGN activity. I return to the problem of quantifying these effects in the last section of this paper. We see that the fraction of disks that suffered recent major mergers varies from 5–20 percent at redshift zero to about 50 percent at redshift three, while the fraction of disks that have experienced recent minor mergers changes from 20–50 percent at redshift zero, to 80 percent at redshift three.
So, with respect to the question that I introduced in the opening paragraph, the theoretical prediction is that a large fraction of high redshift galaxies should have substantial disk components, but many or most of these disks should carry the signatures of recent mergers. I turn now to the observations: do they support or refute this prediction?
3. Are the DLAS proto-disks?
Damped Lyman- systems (DLAS) have traditionally been interpreted as the high-redshift analogs of present day spiral disks (e.g. Lanzetta, Wolfe, & Turnshek 1995). The velocity profiles obtained from unsaturated, low-ionization-state metal lines are asymmetric and “edge-leading” (the strongest feature tends to occur at one edge of the system), and the distribution of velocity widths extends to large values of . Prochaska & Wolfe (1997, 1998) showed that their data was well fit by a “thick disk” model, in which each DLAS corresponds to a rotationally supported disk, with a scale height rather larger than typical nearby spirals, and a fairly rapid rotation speed of . This would imply that disks nearly as massive as present day spirals are in place at redshifts of 2–3, which is at odds with the predictions of hierarchical models. Indeed, the distributions obtained from the disk formation models of Kauffmann (1996) and Mo et al. (1998) are dramatically inconsistent with the observations, as emphasized by Prochaska & Wolfe (1998).
This would appear to constitute a serious problem for hierarchical models. However, CDM actually predicts that halos will have considerable substructure, and Haehnelt, Steinmetz & Rauch (1998) found that, in their CDM-based hydro-dynamical simulations, in some cases DLAS were produced by lines of sight intersecting multiple “proto-galactic clumps” orbiting within a common dark matter halo. In these cases, the simulations reproduced the characteristic asymmetric, edge-leading profiles, but they arose not from the rotation of a single disk, but from circular motion with the larger potential well of the halo. Similarly, the measured did not reflect the internal rotation velocity of a single disk, but the relative motion of the clumps within the halo. Maller et al. (2000; MPSP) developed a “Multiple Disk” model, based on the same picture, but embedded within a semi-analytic model of galaxy formation with detailed modelling of gas cooling, star formation, and chemical evolution. MPSP emphasized that if the sizes of gas disks are modelled using the standard paradigm of disk formation described above, then the cross-section for damped absorption is dominated by lines of sight that pass through single disks, and the previously discussed problems apply. However, they found that a model in which the same amount of gas was placed in more extended Mestel disks resulted in a significant fraction of systems produced by lines of sight passing through multiple disks, which tend to yield large values. This model yielded good agreement with the data at (MPSP).
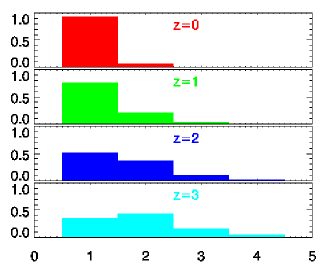
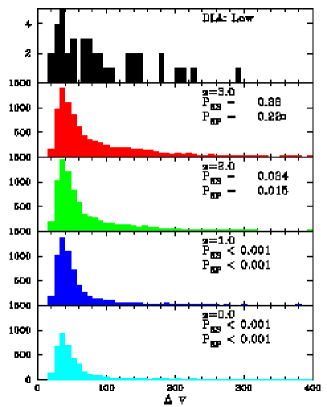
In Maller et al. (in prep, see also the contribution by Maller et al. in this volume) a more physical “Merging Disk” model is explored. Using a semi-analytic model similar to the one discussed earlier, the radial profiles of gas in isolated (non-merging) disks are modelled using the standard approach. Merging disks are assumed to possess more extended gas distributions (like those assumed in MPSP), due to the gas ejected in tidal tails. In this model, because of the strong evolution in the merger rate discussed earlier, at high redshift (), a significant fraction of the lines of sight producing DLAS pass through two or more merging galaxies (see figure 2a), and the good agreement with the kinematic data is retained (figure 2b). The model makes an interesting prediction, which is the opposite of what one would naively expect in a hierarchical universe, if the values traced the internal rotation velocities of disk galaxies: in the Merging Disk model, the tail of large systems seen at high redshift actually diminishes at lower redshift (fig 2b), where comparable observational studies have not yet been carried out.
4. Are the LBGs proto-disks?
The galaxies identified at via the Lyman-break or drop-out technique (e.g. Steidel et al. 1999) or photometric redshifts are also candidates for early disk galaxies. From their near-IR spectra, we know that they have blue optical colors and show strong emission lines — spectrally, they would certainly be classified as very late-type or starburst galaxies. But this does not prove that they are disks in the true, kinematic sense — they could be spheriods in the process of collapsing. Morphologically, they do not really fit into any category that can be defined based on nearby galaxies. Many have concentrated central regions with light profiles, surrounded by more diffuse exponential envelopes. Many others have peculiar morphologies, with multiple sub-clumps and extended wispy features reminiscent of tidal tails (Lowenthal et al. 1997). NICMOS observations show that the objects with disturbed morphologies tend to look similar in the near-IR (rest visual) band and in the optical (rest-UV; Dickinson et al. 1998).
More quantitatively, Marleau & Simard (1998) performed bulge-disk decompositions of the light-profiles of HDF galaxies by fitting a two-component form consisting of an exponential and Sérsic part. The resulting bulge-to-total light ratios for galaxies with photometric redshifts in the range are shown in figure 16g of Somerville, Faber, & Primack (2000; SPF). About 80 percent of the HDF galaxies () have at least half of their light in a “disk” component by this definition, in good agreement with the semi-analytic models.
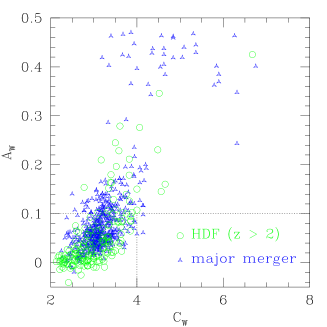
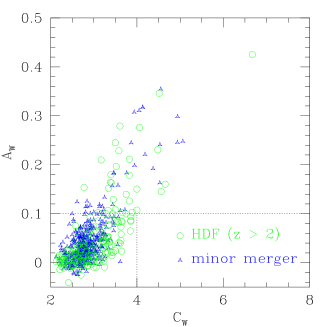
In her thesis work, Wu (1999) performed a more detailed analysis of the morphology of HDF galaxies. She defined concentration and asymmetry statistics ( and respectively), similar to those defined by Abraham et al. (1996), and calibrated the new statistics on nearby galaxies with visually typed morphologies. In qualitative agreement with previous studies, she found that low redshift elliptical galaxies tend to lie in the high concentration, low asymmetry part of the diagram (, ), spirals in the low concentration, low asymmetry region (, ), and interacting and peculiar galaxies in the high asymmetry region (). When these statistics were applied to the HDF galaxies, she found that none of the high redshift () galaxies lie in the part of the - plane characteristic of nearby ellipticals (see fig. 3). However, many galaxies at high redshift show high levels of asymmetry (), typical of local interacting or peculiar galaxies.
We would like to use these sorts of statistics to identify galaxies that have suffered recent mergers, and even to date the stage in the merger and to learn something about about the type of interaction. In order to make comparisons with theory, it is important to calibrate the statistics against detailed simulations. As part of an ongoing program, we have run high resolution N-body simulations of mergers of pairs of galaxies, including SPH treatment of gas dynamics (Hernquist & Katz 1989) and a Schmidt-law recipe for star formation (Mihos & Hernquist 1994b). Initial conditions for these interactions are set up ‘by hand’, choosing the properties of high-redshift disks to match the predictions of the semi-analytic models described earlier. In work led by P. Jonsson as part of his PhD dissertation, the star formation history of each “star” particle is then convolved with stellar population synthesis models to obtain synthetic images. We fold in the sensitivity, resolution, and PSF of the WF/PC or NICMOS instruments and add noise and sky background to create mock HDF images (see the contribution of Jonsson et al., in this volume, for more details and pretty pictures). We then run the code developed by Wu to calculate the and statistics of our synthetic images. The results are shown in figure 3 for various “snapshots” in time during a major (1:1) and minor (1:10) merger, along with the results for the HDF galaxies at . Note that the relative weighting of the simulated points (i.e. the number of points in a given part of the diagram) is not meant to be comparable to the data — we would need to fold in the relative frequency of different types of merger and the probability of observing a galaxy at a particular phase during the merger. The interesting feature is the locus of - space spanned by the simulations and observations.
During much of the course of the interaction, the synthetic galaxies inhabit the same part of the - plane as nearby spirals and irregulars (and most of the HDF galaxies). Very high levels of asymmetry are sustained only during a relatively brief phase of the interaction. As expected, higher levels of are produced by the major merger, and are sustained for a longer fraction of the merging time. Apparently, however, even minor mergers can produce significantly increased values of (though it is as yet unclear how typical the case simulated, which is a prograde, coplanar merger, will turn out to be). In fact, only two of the HDF galaxies show the extremely high values of characteristic of the most asymmetric phase of the major merger. Most of the asymmetric HDF galaxies () are therefore probably to be associated with minor mergers or less asymmetric phases of major mergers. This is perhaps to be expected, as major mergers are rare compared with minor mergers. It is also interesting to note that several of the high redshift HDF galaxies show the high concentrations () characteristic of local ellipticals, but much higher asymmetries. In the simulations, this part of the diagram corresponds to late-stage major mergers, which will presumably become less asymmetric as they relax, and drop down to the “elliptical” region of the diagram. Though this qualitative level of agreement is encouraging, this work should be viewed as preliminary as we have not yet considered the effects of dust extinction, which may produce a heavily extinguished (ULIRG-like) phase during the merger, and may significantly alter the morphology in UV/optical bands. A broader range of parameter space (including interactions with different orbital geometries) also needs to be explored.
5. Conclusions
Observational evidence (e.g. Le Fèvre et al. 2000) as well as theoretical studies based on dissipationless N-body simulations (Kolatt et al. 2000) support the expectation that galaxy merger rates were higher in the past. There is a growing realization that mergers of gas-rich disks are instrumental in driving several important processes: radial gas inflows, disk destruction/spheroid production and transferring orbital angular momentum to the cold disk gas. These processes in turn have profound implications for several observed populations at high redshift. Gas inflows probably fuel starbursts, which may be responsible for activating star formation in a large fraction of the high redshift galaxies identified in the optical and sub-mm (SPF). At the same time, these inflows may also fuel AGN activity (Kauffmann & Haehnelt 2000). Producing spheroids via violent mergers leads very naturally to the observed morphology-density relation, as mergers take place preferentially in dense environments. Minor mergers, which are far more common, may also produce morphological evolution towards earlier Hubble types, by triggering nuclear bursts of star formation. In addition, mergers may transfer orbital angular momentum to the cold disk gas. Initially, this gas will be launched to large distances in the form of tidal tails, but most of it will eventually fall back to form a new disk. This process may introduce an important new ingredient into the ‘standard paradigm’ of disk formation, in which all disk angular momentum is acquired from early tidal torques.
Lines of sight passing through the extended gaseous tidal tails in gas rich, interacting galaxies could produce the large velocity width Damped Lyman- systems observed by Prochaska & Wolfe (1997, 1998), resolving the conflict between these observations and hierarchical models. If correct, this picture has many interesting implications, such as a decreasing fraction of large profiles at lower redshift. If the same interaction also produces a starburst, this also leads to specific predictions for the probability of detecting nearby objects in emission, which we are currently investigating (Maller et al. in prep).
The prediction of a CDM-based semi-analytic model is that many disks exist at high redshift, but most have experienced recent interactions. The fraction of objects showing signatures of morphological disturbance is therefore expected to increase dramatically with redshift. There are mounting indications that such a trend is indeed observed. If confirmed, this constitutes direct evidence of hierarchial structure formation in action, and may even be utilized to obtain a measure of the merger rate as a function of redshift. One way to quantify galaxy morphology is via statistics that simultaneously measure the “concentration” and “asymmetry” of an image. This appears to be a promising way to pick out interacting galaxies and remnants of recent mergers, especially when combined with other information such as color (Conselice et al. 2000). In order to interpret the observational results, however, it is important to calibrate the statistics by calculating them in the same way on observations and on synthetic images of simulated interacting galaxies at various redshifts. I have presented preliminary results from an ongoing program to carry out such a comparison with the HDF, using the concentration and asymmetry statistics defined by Wu (1999). An encouraging level of agreement is obtained between the statistics calculated on the real and synthetic images, supporting the hypothesis that the high redshift HDF galaxies with high asymmetries are in fact ongoing interactions or recent mergers. With further refinement of the simulations and more extensive observations, this should be a promising way to directly probe the merger history and assembly of galaxies in the present-day universe.
Acknowledgments.
I thank my collaborators for allowing me to present work in progress. I particularly thank Ariyeh Maller and Patrik Jonsson, who actually made plots for me, and also Avishai Dekel, Sandra Faber, Tsafrir Kolatt, Chris Mihos, Joel Primack, Jason Prochaska, Gady Rosenfeld, Luc Simard, and Katherine Wu.
References
Abraham, R.G., van den Bergh, S., Glazebrook, K., Ellis, R.S., Santiago, B.X., Surma, P., & Griffiths, R.E. 1996, ApJS, 107, 1
Conselice, C. J., Bershady, M. A., & Jangren, A., 2000, ApJ, 529, 886
Dickinson M. et al., 1998, in AAS Meeting, Vol. No. 193, p. 75.11
Efstathiou, G., Lake, G., Negroponte, J., 1982, MNRAS, 199, 1069
Haehnelt M. G., Steinmetz M., & Rauch M., 1998, ApJ, 495, 647
Hernquist, L., & Katz, N. 1989, ApJS, 70, 419
Lanzetta K. M., Wolfe A. M., Turnshek D. A., 1995, ApJ, 440, 435
Le Fèvre, O. et al. 2000, MNRAS, 311, 565
Kauffmann G., 1996, MNRAS, 281, 475
Kauffmann G., & Haehnelt M., 2000, MNRAS, 311, 576
Kolatt, T. S., Bullock, J., Sigad, Y., Kravtsov, A.V., Klypin, A.A., Primack, J.R., & Dekel, A. 2000, astro-ph/0010222
Lowenthal J. et al., 1997, ApJ, 481, 673
Maller A. H., Prochaska J. X., Somerville R. S., Primack J. R. 2000, MNRAS, submitted, astro-ph/0002449 (MPSP)
Marleau F., & Simard L., 1998, ApJ, 507, 585
Prochaska J. X., & Wolfe A. M. 1997, ApJ, 487, 73
Prochaska J. X., & Wolfe A. M. 1998, ApJ, 507, 113
Mihos, J.C., & Hernquist, L. 1994a, ApJ, 425, L13
Mihos, J.C., & Hernquist, L. 1994b, ApJ, 437, 611
Mo, H.J., Mao, S., & White, S.D.M. 1998, MNRAS, 295, 319
Somerville, R.S., & Primack, J.R., 1999, MNRAS, 310, 1087
Somerville, R.S., Primack, J.R., & Faber, S.M., 2000, MNRAS, in press, astro-ph/0006364 (SPF)
Steidel, C. C., Adelberger, K. L., Giavalisco, M., Dickinson, M., & Pettini, M. 1999, ApJ, 519, 1
Wu, K. 1999, PhD Dissertation, University of California, Santa Cruz