Chandra Observations of the X-ray Narrow-Line Region in
NGC 4151
Abstract
We present the first high-resolution X-ray spectrum of the Seyfert 1.5 galaxy NGC 4151. Observations with the Chandra High Energy Transmission Grating Spectrometer reveal a spectrum dominated by narrow emission lines from a spatially resolved (1.6 kpc), highly ionized nebula. The X-ray narrow-line region is composite, consisting of both photoionized and collisionally ionized components. The X-ray emission lines have similar velocities, widths, and spatial extent to the optical emission lines, showing that they arise in the same region. The clouds in the narrow-line region must contain a large range of ionization states in order to explain both the optical and X-ray photoionized emission. Chandra data give the first direct evidence of X-ray line emission from a hot plasma ( K) which may provide pressure confinement for the cooler ( K) photoionized clouds.
1 Introduction
NGC 4151 (z=0.00332) is a well-studied Seyfert 1.5 galaxy. It is known to be extended in soft X-rays from Einstein and ROSAT observations (Elvis, Briel, & Henry, 1983; Morse et al., 1995). The nature of the extended X-ray emission was postulated to be either thermal emission from a collisionally ionized plasma or scattered nuclear flux. Weaver et al. (1994) modeled the ASCA spectrum by 3 components: an absorbed power law plus reprocessed emission from a warm absorber and an extra scattered component. Variability was observed in the column density of the warm absorber.
Spectral complexity from unresolved emission lines and ionized absorption edges has been seen in the residuals of power-law fits to the spectra of many Seyfert galaxies. Recent observations with Chandra have revealed narrow absorption and emission lines in the spectra of Seyfert 1 galaxies NGC 5548 (Kaastra et al., 2000) and NGC 3783 (Kaspi et al., 2000). These two sources are dominated by continuum emission from the central source, so absorption lines are more prominent than emission lines. On the other hand, the nucleus of NGC 4151 is highly absorbed, giving a good view of its narrow emission line region.
In this paper we present Chandra High Energy Transmission Grating Spectrometer (HETGS) observations of NGC 4151. We identify and measure a large number of narrow emission lines in the X-ray spectrum. The high spectral resolution provided by HETGS allows us to study the ionization, temperature, and kinematics of the X-ray emitting regions. We discuss the association of the extended X-ray emission with the narrow-line region, and interpretations of the multiple X-ray emitting components in the spectrum.
2 Observations
We observed NGC 4151 for 48 ks on 2000 March 5 with Chandra HETGS (Canizares et al., 2000), at a roll angle of . The dispersion directions of the High Energy Grating (HEG) and the Medium Energy Grating (MEG) made acute angles of and , respectively, with the direction of the extended X-ray emission. Since the source has appreciable extent along the dispersion direction (see below), the spectral and spatial dimensions are mixed. Spectral extractions and reductions were performed using CIAO 111http://asc.harvard.edu/ciao and IDL. We used extraction windows of width in the cross-dispersion direction, which were centered on the nucleus of the 0-order image. The windows included most of the flux from the extended source. We then summed the plus and minus orders of the spectra. The flux calibration of HETGS is currently accurate to 10% for energies keV and 20% for keV.
The wavelength calibration was tied to an HETGS observation of Capella which was reduced in an identical manner to NGC 4151 (using CIAO, v. 2.0, 2000 August 6). In this way we determined that velocities must be corrected by km s-1 to remove a systematic wavelength calibration error that exists in standard-processed data. This error is currently attributed to an error in the CCD pixel scale, due to thermal contraction 222http://asc.harvard.edu/cal. Corrected velocities are reported in Table 1. Marginally redshifted X-ray narrow emission lines have been reported for NGC 5548 (Kaastra et al., 2000, km s-1) and NGC 3783 (Kaspi et al., 2000, km s-1). These redshifts may be owing to similar wavelength calibration errors.
NGC 4151 was in a low flux state during our observation, with photons s-1 cm-2 Å-1 at 2 Å. We show the first order HEG and MEG spectra in Figure 1. Above 6 Å (below 2.1 keV), the spectrum is dominated by emission lines. Table 1 gives a list of the identified emission lines, their fluxes, and velocities relative to the galaxy rest frame.
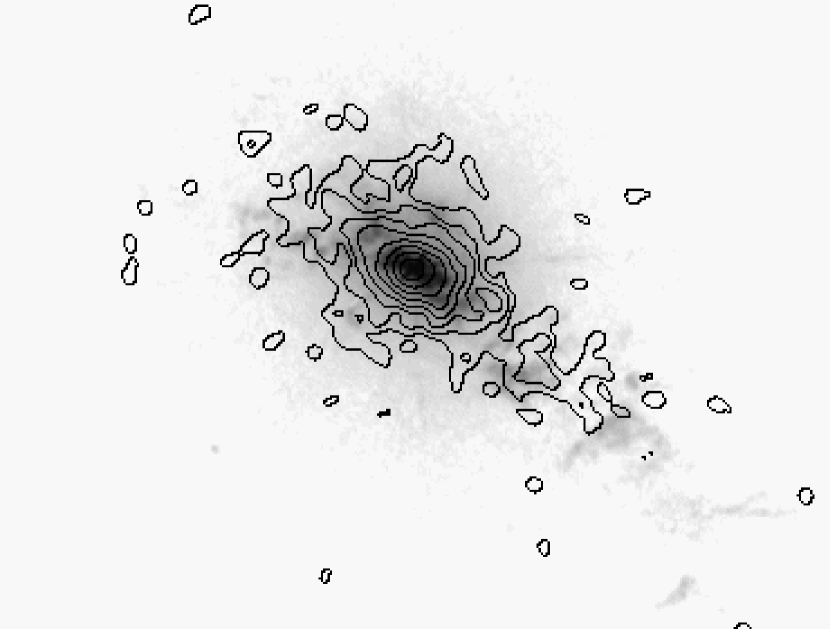
We compare the HETGS 0-order X-ray (0.4-2.5 keV) image of NGC 4151 to an optical [O iii] 5007 image from the Hubble Space Telescope (HST) (Fig. 2). There is a good, but not exact correspondence between the structure of the optical and soft X-ray emission regions. The X-ray emission has a similar extent ( kpc) and orientation (PA) to the optical narrow-line region (NLR). Most (70%) of the soft X-ray emission is resolved by Chandra; the rest comes from an FWHM nucleus. The hard X-ray emission (E2.5 keV) is consistent with a nuclear point source.
The spatial profiles of the narrow emission lines are extended (Figure 3). We show three lines, from three different ionization states: O vii (f), O viii Ly, and Fe i K. All three lines have similar spatial profiles to the 0-order soft X-ray image, and can be traced out to a distance of pc from the nucleus.
HETGS is rather insensitive to relativistically broadened Fe K emission. Yaqoob et al. (1995) fit ASCA observations of Fe K with broad ( keV) and narrow components having equivalent widths of eV and eV, respectively. We find an equivalent width of eV for narrow Fe i K with the HEG. The narrow core of the line is unresolved, with FWHM km/s.
3 Discussion
3.1 Photoionized X-ray Line Emission
The spectrum of NGC 4151 is hybrid, with line emission coming from both photoionized and collisionally ionized plasmas. There are several strong indications of a photoionized component. First, we see narrow radiative recombination continua (RRCs) from N vii, O vii, O viii, Ne ix, and Ne x. We estimate half widths (at 37% peak flux) for the RRCs which range from 1-4 eV, corresponding to temperatures of K. To have such a low temperature and contain such high ionization states, the plasma where the RRC originates must be dominated by photoionization.
The ratio of the O vii forbidden to resonance emission lines () is also consistent with photoionized plasma (Porquet & Dubau, 2000). In addition, relatively strong transitions of N vi, Ne ix, and Mg xi are indicative of photoionization (Bautista & Kallman, 2000). The strength of O, Ne, Mg, and Si K-shell emission lines and relative weakness of Fe L-shell lines are additional characteristics of a photoionized plasma (Liedahl, 1999).
3.2 Thermal X-ray Line Emission
Except for O vii, the He-like lines have a small ratio, which means that collisional ionization is important. The Ne ix lines have . A ratio is expected for a photoionized plasma, and for a collisionally ionized plasma with K. There is clearly a mixture of line emission from both types of plasma. We note that fluorescent excitation by the continuum and resonance scattering may lead to enhancement of resonance lines under special circumstances (Bautista et al., 1998; Kallman et al., 1996). However, we would expect these processes to equally effect the O vii and other He-like resonance lines, which is not the case.
The Ly lines of O viii, Ne x, and Mg xii also have a large contribution from collisionally ionized plasma. The O viii Ly line is much stronger than the O viii RRC, while a ratio near unity is expected for a pure photoionized plasma. We find that of the O viii Ly emission comes from the hot plasma component of the NLR. Similarly, of the Ne x Ly emission comes from this component. A large fraction of the Mg xii Ly flux must also have a collisional origin, since the Mg xii RRC (6.32 Å) is not even detected.
From the range of formation temperatures of the collisionally augmented lines, we deduce that there is plasma in the temperature range K. The nondetection of S xvi emission (4.73 Å, photons cm-2 s-1) is partly owing to the strong continuum at that wavelength. However, the detection of Fe xxv ( K) suggests that hotter gas is present. A more thorough analysis will be necessary to derive the volume emission measure vs. temperature distribution of the hot plasma.
3.3 Continuum Emission
We characterize the continuum emission from NGC 4151 with the sum of two absorbed power laws. The hard continuum ( keV) has a photon index and normalization photons keV-1 cm-2 s-1 at 1 keV, absorbed by a neutral column of cm-2. The observed 2-10 keV flux is ergs cm. The soft continuum ( keV) has a photon index of and normalization photons keV-1 cm-2 s-1 at 1 keV, absorbed by a Galactic column of cm-2.
We deduce that there is strong absorption of the hard nuclear flux by a cloud which does not occult the bulk of the soft X-ray emitting NLR. Weaver et al. (1994) observed a 2-10 keV flux of ergs cm, , and cm-2 with ASCA. The hard continuum was harder and a factor of times fainter during our observation, but was similar. However, we note that poor statistics for energies above 7 keV in our data may bias the fit value for . Weaver et al. (1994) also found variations in with ASCA on a time scale of 6 months, which suggests that absorption is taking place on a spatial scale much smaller than the NLR.
The soft continuum of NGC 4151 has a much steeper photon index than the hard continuum (3.1 vs 0.4). This argues against Thomson scattered emission as the source of the soft continuum, unless the intrinsic nuclear continuum steepens drastically below 3 keV. Thermal bremsstrahlung and blended Fe L emission lines are therefore the most likely sources of the soft continuum.
3.4 Kinematics of the X-ray Line Region
The locations and velocity field of optically emitting clouds in the NLR of NGC 4151 have been mapped in detail by Kaiser et al. (2000), and are consistent with a biconical outflow from the nucleus. Integrated long-slit spectroscopy of the central of the NLR gives a blueshift of -90 km s-1 and a line width (FWHM) of 460 km s-1 for the [O iii] 5007 line (Heckman et al., 1981). The blueshifts and blue asymmetry of the optical lines are likely owing to obscuration of the far cone by dust.
The unblended X-ray emission lines have an (unweighted) mean blueshift of km s-1 with respect to the galaxy rest frame, as measured from its stellar spectrum. This is consistent with the velocity of the optical NLR. Since the X-ray line widths are affected by spatial broadening, we can only get an upper limit to their velocity widths from the widths of the low energy lines. O vii (f) has an apparent width (Gaussian FWHM) of km s-1, which equals the widths of the optical lines.
It is interesting that the X-ray emission region is more extended in the front (SW) cone than the back cone (Fig. 2), suggesting that the soft X-rays from the back cone are obscured, like the optical emission. The similar spatial extent of the X-ray and optical emission line regions (Figs. 2,3) and their similar kinematics are strong evidence that they are closely linked. X-ray emission from the NLR demonstrates that high energy processes are important in this region, at distances of 70-800 pc from the galactic nucleus.
3.5 The Multiphase Nature of the NLR
For the first time, there is direct evidence for at least 2 distinct gas phases in the extended NLR of a Seyfert galaxy. One of the phases is cool ( K) and photoionized, while the second is hot ( K) and collisionally ionized. In addition, there is a large range in ionization of the photoionized region, as demonstrated by O i-O iii in the optical-UV spectrum and O vii in the X-ray spectrum. There are also strong K lines from neutral species in the X-ray spectrum, including Fe i, Si i, and Mg i. Detailed modeling will be necessary to determine the volume emission measure vs. ionization distribution of the photoionized component. A wide range of ionization is derived from photoionization models of the NLR of the Circinus galaxy (Sako et al., 2000), and might be explained by a radial gradient in the NLR density.
A large percentage () of the narrow Fe i K emission comes from the extended NLR (Fig. 3). This is contrary to the popular idea that the narrow emission comes primarily from a parsec scale torus. The remaining unresolved emission, which has an equivalent width of eV, may very well come from a torus. Unlike NGC 5548 (Yaqoob et al., 2000), there is no evidence for Doppler broadening of the narrow Fe i K line in NGC 4151.
It has been suggested that a hot, inter-cloud medium is necessary for pressure confinement of the NLR clouds (Elvis, Briel, & Henry, 1983). The hot plasma we detect in our X-ray spectrum may form this medium. We derive volume emission measures for the thermal contribution to the Ne x and O viii Ly lines of cm-3, assuming , and line emissivities for solar abundances from Mewe, Gronenschild, & van den Oord (1985). Crenshaw et al. (2000) derive a half-opening angle of from kinematic models of the optical NLR. If the thermal X-ray line emission comes from a uniformly filled () bicone in the central of the galaxy, then the mean plasma density is cm-3 and the pressure is cm-3 K. Pressure equilibrium between the hot and cool phases of the X-ray NLR would then require a density of cm-3 for the cool phase.
The optical NLR clouds at have a density cm-3 and a pressure of cm-3 K (Penston et al., 1990; Morse et al., 1995), much lower than what we find closer to the nucleus. However, we know that the spatial profile of the NLR flux is centrally peaked. A density profile of would account for the larger pressure of the nucleus than the extended NLR, assuming constant temperature. Estimates of the pressure can be improved by modeling the density distribution to match the spatial profiles of the X-ray emission.
A possible alternative is that the hot plasma is confined to shocks between the NL clouds and the host galaxy ISM. In that case, its filling factor would be much lower, and its density and pressure much higher than calculated above. The X-ray emission we observe in the Chandra image has a clumpy morphology which follows the optically emitting clouds. This may be partly owing to emission from a shocked component. There is evidence for deceleration of the NL clouds at a radius of about from the nucleus (Crenshaw et al., 2000), perhaps from interaction with the ISM.
4 Conclusions
The power of Chandra HETGS to elucidate the nature of the X-ray emission from active galactic nuclei is demonstrated by high resolution spectra and images of NGC 4151. Direct emission from the nucleus is highly absorbed. Strong, narrow X-ray emission lines are seen from the spatially resolved NLR of NGC 4151. The narrow radiative recombination continuum features and the O vii ratio are consistent with photoionization from the hard nuclear X-ray source. There is also narrow line emission from a hot, collisionally ionized component in the extended NLR. This may come from the long-sought intercloud medium or shocked plasma. In addition, we find strong narrow Fe i K emission from the extended NLR. The composite nature of the NLR indicates that both photoionization and collisional heating are important. The extent and kinematics of both X-ray photoionized clouds and hot thermal plasma match those of the optical NLR, showing that they are closely connected. We also suggest that the narrow X-ray emission lines seen in some other Seyfert galaxies may come from the NLR, and may be interpreted in the light of these NGC 4151 observations.
References
- Bautista et al. (1998) Bautista, M. A., Kallman, T. R., Angelini, L., Liedahl, D. A., & Smits, D. P. 1998, ApJ, 509, 848
- Bautista & Kallman (2000) Bautista, M. A., and Kallman, T. R. 2000, preprint (astro-ph/0006371)
- Canizares et al. (2000) Canizares, C. R. et al. 2000, in preparation
- Crenshaw et al. (2000) Crenshaw, D. M., et al. 2000, preprint (astro-ph/0007017)
- Elvis, Briel, & Henry (1983) Elvis, M., Briel, U. G., & Henry, J. P. 1983, ApJ, 268, 105
- Heckman et al. (1981) Heckman, T. M., Miley, G. K., van Breugel, W. J. M., & Butcher, H. R. 1981, ApJ, 247, 403
- Kaastra et al. (2000) Kaastra, J. S., Mewe, R., Liedahl, D. A., Komossa, S., and Brinkman, A. C. 2000, A&A, 354, L83
- Kaiser et al. (2000) Kaiser, M. E., et al. 2000, ApJ, 528, 260
- Kallman et al. (1996) Kallman, T. R., Liedahl, D., Osterheld, A., Goldstein, W., & Kahn, S. 1996, ApJ, 465, 994
- Kaspi et al. (2000) Kaspi, S., Brandt, W. N., Netzer, H., Sambruna, R., Chartas, G., Garmire, G. P., and Nousek, J. A. 2000, ApJ, 535, L17
- Liedahl (1999) Liedahl, D. A., 1999, in X-ray Spectroscopy in Astrophysics, Springer-Verlag, ed. van Paradijs, J., & Bleeker, J. A. M., 189
- Mewe, Gronenschild, & van den Oord (1985) Mewe, R., Gronenschild, E. H. B. M., & van den Oord, G. H. J. 1985, A&AS, 62, 197
- Morse et al. (1995) Morse, J. A., Wilson, A. S., Elvis, M., & Weaver, K. A. 1995, ApJ, 439, 121
- Penston et al. (1990) Penston et al. 1990, A&A, 236, 53
- Porquet & Dubau (2000) Porquet, D. & Dubau, J., 2000, A&AS, 143, 495
- Sako et al. (2000) Sako, M., Kahn, S. M., Paerels, F., & Liedahl, D. A. 2000, preprint (astro-ph 0006146)
- Weaver et al. (1994) Weaver, K. A., Yaqoob, T., Holt, S. S., Mushotzky, R. F., Matsuoka, M., & Yamauchi, M. 1994, ApJ, 436, L27
- Yaqoob et al. (1995) Yaqoob, T., Edelson, R., Weaver, K. A., Warwick, R. S., Mushotzy, R. F., Serlemitsos, P. J., & Holt, S. S. 1995, ApJ, 453, L81
- Yaqoob et al. (2000) Yaqoob, T., George, I. M., Nandra, K., Turner, T. J., Serlemitsos, P. J., & Mushotzky, R. F. 2000, ApJ, accepted (astro-ph 0008471)
| (rest Å) | v(km s-1) | Flux aaFlux (photons s-1 cm-2) | SNR bbSignal-to-noise ratio | ID |
|---|---|---|---|---|
| 1.79 | 460420 | 3.3E-05 | 2.3 | Fe xxv |
| 1.937 | 25080 | 1.8E-04 | 11.0 | Fe i K |
| 6.182 | -20120 | 1.0E-05 | 4.1 | Si xiv Ly |
| 6.648 | -30130 | 1.1E-05 | 4.4 | Si xiii r |
| 6.740 | -4040 | 1.1E-05 | 5.0 | Si xiii f |
| 7.106 | -380110 | 5.3E-06 | 3.5 | Mg xii Ly ccLine blend or possible line blend |
| 7.130 | -38040 | 1.3E-05 | 5.6 | Si i K |
| 7.851 | -56080 | 2.5E-06 | 2.4 | Mg xi 1s3p-1s2 |
| 8.421 | -21090 | 1.1E-05 | 7.4 | Mg xii Ly |
| 9.01 | -380170 | 3.5E-06 | 3.3 | Fe xxii ccLine blend or possible line blend |
| 9.102 | 7.2E-06 | 3.2 | Ne x RRC ccLine blend or possible line blend | |
| 9.169 | -20160 | 9.3E-06 | 6.3 | Mg xi r ccLine blend or possible line blend |
| 9.314 | -406140 | 1.2E-05 | 7.4 | Mg xi f |
| 9.887 | -33050 | 3.2E-06 | 2.7 | Mg i K |
| 10.239 | -18070 | 7.4E-06 | 4.5 | Ne x Ly |
| 10.368 | 9.3E-06 | 4.2 | Ne ix RRC | |
| 11.001 | 110140 | 3.8E-06 | 2.2 | Ne ix 1s4p-1s2 |
| 11.547 | -29070 | 5.9E-06 | 3.0 | Ne ix 1s3p-1s2 |
| 12.134 | -7080 | 2.0E-05 | 6.4 | Ne x Ly |
| 13.447 | -15040 | 2.0E-05 | 4.8 | Ne ix r |
| 13.553 | -210160 | 9.9E-06 | 2.5 | Ne ix i |
| 13.698 | 1040 | 3.3E-05 | 6.1 | Ne ix f |
| 14.228 | 1.1E-05 | 2.3 | O viii RRC ccLine blend or possible line blend | |
| 15.176 | -17050 | 1.1E-05 | 3.2 | O viii Ly |
| 16.006 | -25020 | 1.8E-05 | 3.8 | O viii Ly ccLine blend or possible line blend |
| 16.771 | 5.2E-05 | 4.7 | O vii RRC | |
| 18.588 | 2.6E-05 | 2.6 | N vii RRC | |
| 18.969 | -4030 | 1.0E-04 | 7.0 | O viii Ly |
| 21.602 | 10620 | 6.8E-05 | 4.1 | O vii r |
| 21.804 | -410140 | 5.1E-05 | 3.3 | O vii i |
| 22.101 | -13220 | 3.1E-04 | 8.3 | O vii f |
| 24.781 | -19060 | 6.3E-05 | 4.0 | N vii Ly |
| 24.898 | -1020 | 3.9E-05 | 3.0 | N vi 1s3p-1s2 |
Figure Captions
Figure 1
Chandra first order HEG (top) and MEG (middle, bottom)
spectra of NGC 4151, with line identifications. Above 6 Å, the spectrum is
dominated by narrow emission lines from both thermal and photoionized plasmas.
Note that the ratio of forbidden to resonance emission in the He-like O
vii lines is large, while the ratio for Ne ix, Mg xi, and Si
xiii is smaller, indicating a hybrid spectrum. The narrow radiative
recombination continua (RRCs) of several ions attest to photoionization in a
cool plasma.
Figure 2
Comparison of X-ray and optical emission from the extended
NLR in NGC 4151. Chandra contours (0.4-2.5 keV band) are overlayed on an
HST [O iii] 5007 image. A 364 by 235 region is shown,
with N at top and E at left. Note that the SW (front) cone is more extended
than the NE (back) cone in both bands. X-ray contours are separated by
factors of 2 in surface brightness, with the lowest contour at 2.1 photons
arcsec-2.
Figure 3
Comparison of NGC 4151 zero-order spatial profile and 1st order
emission line spatial profiles. The gaussian profile of the unresolved
nuclear component is shown for comparison. The spatial profiles of
O vii, O viii, and Fe K are all resolved, from a region at
least in extent.