Parameterisation of Galaxy Spectra in the
2dF Galaxy Redshift Survey
\toctitleParameterisation of Galaxy Spectra in the
2dF Galaxy Redshift Survey
11institutetext: Institute of Astronomy, University of Cambridge,
Madingley Road, Cambridge CB3 0HA, UK
22institutetext: Anglo-Australian Observatory, P.O Box 296, Epping, NSW 2121,
Australia
33institutetext: Department of Astronomy, California Institute of Technology,
Pasadena, CA 91125, USA
*
Abstract
The 2dF Galaxy Redshift Survey has already yielded over 135,000 galaxy spectra (out of the planned 250,000). We present a method for the parameterisation of galaxy spectra in the 2dF and other large redshift surveys using a new continuous parameter , based on a Principal Components Analysis (where and are the projections onto the first and second principal components respectively). This parameter is designed to be robust to instrumental uncertainties and it represents the absorption/emission strength of a galaxy.
1 The 2dF Galaxy Redshift Survey
The 2dF Galaxy Redshift Survey[1] is a combined UK-Australian effort to map the distribution of galaxies brighter than (with median redshift ). In so doing it will obtain a total of 250,000 galaxy spectra from which redshifts will be determined, a factor of 10 more than any previous survey.
Crucial to extracting the full scientific content of the survey is an accurate characterisation of the galaxy population in terms of spectral features. To this end we address the problem of obtaining an accurate and meaningful spectral classification that can be used in future analyses e.g. of luminosity functions and correlation functions.
2 Principal Components Analysis
Principal Components Analysis (PCA) allows us to easily visualise overall trends (if any) within a multi-dimensional population [2] [3] [4]. It does this by reducing the dimensionality of the parameter space (here spectral bins) down to just those components which are the most informative (in the sense of maximum variance). Any clustering in the space defined by the PCA is indicative of distinct subpopulations within the sample.
In terms of reduced dimensionality we find that when we apply PCA to the first 100,000 galaxy spectra obtained in the 2dFGRS that rather than using the original 738 spectral channels to describe each spectrum, we can use only three projections and still retain two thirds of the total variance within the population [4]. The significance of each successive principal component drops off very sharply so these first few components are by far the most important.
2.1 PCA on Volume-Limited Samples
Due to the large number of galaxy spectra acquired so far in the 2dFGRS it has now become possible to consider volume-limited subsets of the galaxies for the PCA. This approach is more physically motivated compared to considering the entire flux-limited data set in which the spectral population can be biased by relationships between magnitude and spectral type.
We find that using an absolute magnitude cut of -17.0 (corresponding to a redshift ) gives a representative subset of the local population. We therefore perform the PCA on this subset of the population to determine the principal components which are then used to determine projections for the remaining galaxies (Fig. 1).
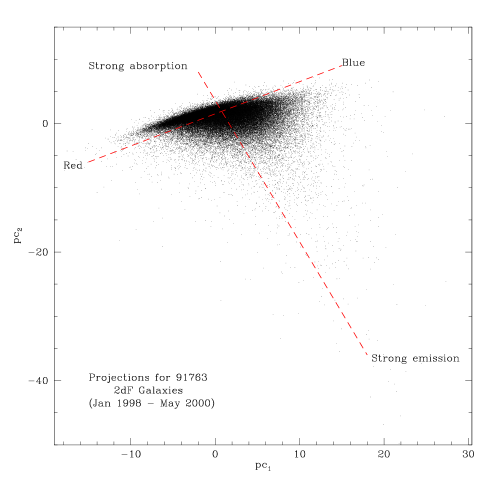
2.2 Identifying Trends
We can identify general trends in the distribution of projections shown in Fig. 1 by considering the physical significance of the first two eigenspectra (Fig. 2). It can be clearly seen that whilst the first eigenspectrum contains both a continuum component and a measure of the average emission/absorption strength, the second contains only the latter (to a first approximation). Therefore by taking certain linear combinations of the two we can either maximise or minimise the contribution from the line features in the spectrum. By performing such an analysis we can conclude that the distribution of Fig. 1 is indicative of a colour sequence from red (bottom left) to blue (top right) and an orthogonal sequence of absorption (top left) to emission (bottom right).

3 Instrumental Uncertainties
Unfortunately whilst carrying out observations using the 2dF instrument allows us to collect an unprecedented number of spectra simultaneously and hence determine many redshifts in a small amount of time, we must make a compromise with our spectral quality. This is deemed to be a necessary sacrifice in view of carrying out a project as ambitious as the 2dFGRS, however if one wishes to characterise the resultant population of galaxies using their spectral properties care must be taken in order to ensure that the classification scheme is robust to instrumental uncertainties.
The 2dF instrument makes use of up to 400 fibre optic cables with a diameter corresponding to (depending on plate position) 2.0” on the sky [5]. The quality of the spectra can be compromised in many ways, the most important of which are:
-
•
Astrometric errors in determining the actual position of the galaxy on the sky can result in the fibre being placed in a position that isn’t optimal for light collection. In general the position of a galaxy centre is known to within ”. In addition to this there is a random positioning error of the order of ” RMS.
-
•
The observed colour (continuum slope) of the galaxy depends on the positioning of the fibre aperture. This is due to small errors in the 2dF corrector which result in relative spatial displacements between different components of a galaxies spectrum and can be as large as ” (at radius of ’) between the incident blue and red components of the observed spectrum.
-
•
The apparent size of a galaxy on the sky can be larger than the fibre aperture (which corresponds to kpc at the surveys median redshift of in an Einstein - de Sitter Universe), the positioning of this aperture can therefore result in an unrepresentative spectrum due to colour gradients within the galaxy.
Whilst the effect of these errors at first seems large one must bear in mind that the average seeing at the 2dF is of the order of ”, enough to significantly smooth out most of the errors. The distortions mentioned in the second point result in unstable continuum measurements for the observed galaxies.
4 Spectral Classification
We are presented with several options in attempting to derive a classification for the the observed 2dF galaxies based upon their spectra. However there are several issues that one must first consider;
-
•
The distribution of galaxies in the (,) plane is smooth, representing a continuous sequence from absorption to emission and from red to blue. There is no evidence to suggest any division into distinct classes of galaxy spectra.
-
•
The instrumental errors result in unstable continuum measurements. On the other hand small scale features such as line-strengths are relatively unaffected.
-
•
The relationship between morphology and spectral properties is not very well understood and hence attempting to anchor the classification using a morphological training set would be premature. A more robust and quantifiable measure of spectral properties is required.
4.1 Parameterisation
By projecting the and components of each galaxy onto the linear combination which maximises the effect of emission/absorption features we are in effect high-pass filtering the spectra. Thus we would expect (and indeed we find) this projection to be relatively stable to uncertainties in continuum measurements.
By using this projection we are determining a measure of the average emission/absorption strength of a galaxy which is easily quantifiable and robust. In addition this projection is also representative of the spectral sequence of the galaxy population since it is composed of the most significant principal components.
We therefore choose to adopt this projection, which we shall denote , as our continuous measure of spectral type:
| (1) |
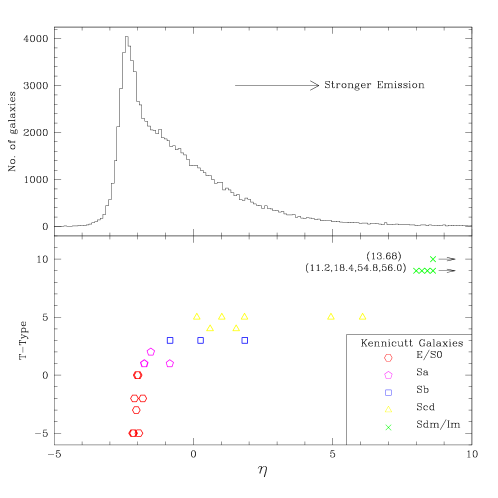
The value of which maximises the emission/absorption features is found to be .
In Fig. 3 the distribution of the projections are shown for the galaxies observed to date in the 2dFGRS. Also shown in the same figure is the -morphology relation for a sample of galaxies from the Kennicutt Atlas [6]. Comparing the two data sets shows that there is a correspondence between the sequence of and that of morphology. Note that this correspondence can only be treated as an approximation since our sample of Kennicutt galaxies is not complete and only represents a few high Signal-to-Noise spectra with well determined morphologies.
5 Summary
We have attempted to derive a meaningful and robust parameterisation of the observed spectral distribution in order to characterise the galaxy population of the 2dFGRS. In so doing we have defined a new variable which represents the most significant component of the galaxy sequence that is unaffected by instrumental uncertainties, but still retains physical information.
The parameter is easily interpreted as an averaged absorption/emission strength and can be shown to have significant correlations with more conventional classifiers such as morphology and the H equivalent width.
There are certain limitations to our analysis, the most notable of which is that we have only derived a classification in the broadest sense. We have not attempted to identify the distinct sub-populations that are known to exist buried within the galaxy sequence, however there is no reason that such an analysis cannot be performed on the data in the future. Other significant limitations to our analysis are the assumption that each spectrum can be reconstructed using a linear combination of only a few of the derived eigenspectra and the restriction to variance as a measure of information (both of which are implicitly assumed in the PCA). These assumptions greatly simplify the analysis but are known to not be true in general. It is in fact possible to extend the analysis without the use of these assumptions to perform an Independent Component Analysis. Another example of a non-linear method that has recently been investigated is that of an information-based clustering algorithm [7]. Preliminary results from such analyses look promising.
References
- [1] Colless, M. M. (1998) Looking Deep in the Southern Sky. ESO/Australia Workshop, Springer Verlag, Berlin, p.9
- [2] Murtagh F., Heck A. (1987) Multivariate Data Analysis, Reidel, Dordrecht
- [3] Connolly A. J., Szalay A. S., Bershady M. A., Kenney A.L., Calzetti D. (1995) AJ, 110, 1071
- [4] Folkes S. R et al. (1999) MNRAS, 308, 459
- [5] Taylor K., Gray P. (1990) Proceedings of Advanced Technology Optical Telescopes IV, Tucson
- [6] Kennicutt, R. C Jr. (1992) ApJS, 79, 255
- [7] Slonim N., Somerville R., Tishby N., Lahav O. (2000), Submitted to MNRAS, astro-ph/0005306