CLUSTERING OF GALAXIES AND GROUPS IN THE NOG SAMPLE
We use the two-point correlation function in redshift space, , to study the clustering of the galaxies and groups of the Nearby Optical Galaxy (NOG) Sample, which is a nearly all-sky, complete, magnitude-limited sample of 7000 bright and nearby optical galaxies. The correlation function of galaxies is well-described by a power-law, , with and Mpc. We find evidence of morphological segregation between early- and late-type galaxies, with a gradual decreasing of the strength of clustering from the S0 to the late-type spirals, on intermediate scales. Furthermore, luminous galaxies (with ) are more clustered than dim galaxies. The groups show an excess of clustering with respect to galaxies. Groups with greater velocity dispersions, sizes, and masses are more clustered than those with lower values of these quantities.
1 Introduction
Following a series of studies (Marinoni et al. , Marinoni et al. , Giuricin et al. ; Marinoni et al. ) in which we investigate on the large-scale galaxy distribution in the nearby universe by using a nearly all-sky sample of optical galaxies, in this paper we analyze the clustering of the galaxies and groups of the Nearby Optical Galaxy (NOG) sample (Giuricin et al. ).
The NOG is a complete, distance-limited ( km/s) and magnitude-limited ( mag) sample of nearby and bright optical galaxies, which covers () of the sky (8.27 sr). The degree of redshift completeness of the NOG is estimated to be 97%. The -magnitudes are homogenized total blue magnitudes transformed to the standard system of the RC3 catalog (de Vaucouleurs et al. ) and fully corrected for Galactic extinction, internal extinction, and K-dimming. Groups have been identified within the NOG by means of the hierarchical (H) and percolation (P) algorithms. About 45% of the NOG galaxies were found to be group members.
In this paper we use the redshift-space two-point correlation function to analyze the clustering of the NOG galaxies (7028 galaxies with 50 km/s), the NOG H groups (474 groups with at least three members), and the NOG P groups (506 groups with at least three members). Here we analyze the P groups obtained with the variant of the P algorithm in which the distance link parameter, corresponding to a minimum number density contrast of 80, is scaled with distance (it is Mpc at 4000 km/s), whilst the velocity link parameter is kept constant at the value of 350 km/s (here we adopt km s-1 Mpc-1). The variant of the P algorithm in which both link parameters are scaled with distance leads to very similar groups (see Giuricin et al. for details on group selection).
Almost all NOG galaxies (98.7%) have a morphological classification. We divide NOG galaxies into two broad morphological bins, early-type galaxies (E-S0, ) and late-type galaxies (Sp, ) and into six fine morphological bins, E (), S0 (), S0/a (), Sa (), Sb (), and later types (hereafter denoted as Scd). The earliest bin, hereafter denoted simply as E, comprise also lenticulars, since it contains also objects broadly classified as E-S0.
2 Calculating the Two-point Correlation Function
We calculate the two-point correlation function in redshift space, , using the estimator of Hamilton . We generate the random sample by filling the sample volume with a random distribution of the same number of points as in the data. The random points are distributed in depth according to the sample’s selection function which expresses the fraction of objects that are expected to satisfy sample’s selection criteria.
For magnitude-limited samples we calculate the weighted correlation function by replacing the counts of pairs with the weighted sum of pairs, , which takes into account the selection effects acting on the sample used. The weighting scheme we adopt is that of equally weighted volumes, .
We calculate the selection functions of the whole sample of galaxies and of specific morphological subsamples in terms of their Schechter-type luminosity functions that we derive using redshifts as distance indicators (see Marinoni et al. for details).
As for groups, we have verified that the redshift distribution of the relatively rich groups are shifted to smaller values than that of galaxies. However, the redshift distributions of the magnitude-limited samples of P and H groups with at least three members are not significantly different from that of galaxies. Therefore, we use the conservative approach of computing their (s) by assuming the same selection function adopted for galaxies. The same assumption was made by Ramella et al. , Trasarti-Battistoni et al. and Girardi et al. in the calculation of the group correlation function.
A different approach used sometimes in the literature (e.g., Carlberg et al. ; Merchán et al. ) to generate a random distribution of groups is to follow directly the observed redshift distribution of groups as if they were unclustered. However, this approach is conceptually questionable, since the results are sensitive to the clustering pattern that is present.
Interestingly, the direct derivation of the selection function of haloes hosting the whole hierarchical sequence from single galaxies to clusters (the catalogs of all galactic systems extracted from the NOG) is recently discussed by Marinoni et al. . In an upcoming paper we will use this statistics to infer the correlation function of the halo distribution.
Moreover, we analyze volume-limited samples, which by definition contain objects that are luminous enough to be included in the sample when placed at the cutoff distance. This leads to uniformly selected data sets in which the same weight is assigned to each object.
Specifically, we extract volume-limited samples of galaxies at different depths. For instance, the volume-limited samples at depths of 6000 (4000) km/s contain 2258 (1895) galaxies which are brighter than the magnitude limits of .
We further construct volume-limited samples of P and H groups with depth of 4000 km/s, by using suitably modified versions of the H and P algorithms in which the selection parameters which scale with distance are kept fixed at the values corresponding to 4000 km/s. These volume-limited samples contain 140 H and 141 P groups with at least three members.
We average the results obtained using many different replicas of the random sample (in general 50 replicas in the case of galaxies and 400 in the case of groups).
We calculate the errors for the correlation function by using 100 bootstrap resamplings of the data (e.g., Ling et al. ).
Since, in general, is well described by a power law over a fairly large interval of , we always fit to the form with a non-linear weighted least-squares method in the intervals where is reasonably fitted by a single power law.
3 The Correlation Function of NOG galaxies
3.1 Results from the whole NOG
Fig. 1 shows the redshift-space correlation function from the whole NOG (1 error bars are shown). From a power-law fit calculated in the interval Mpc, we find a correlation length of Mpc and a slope . On small scales ( Mpc) tends to flatten because of the effects of peculiar motions, whereas on large scales ( Mpc) it tends to steepen.
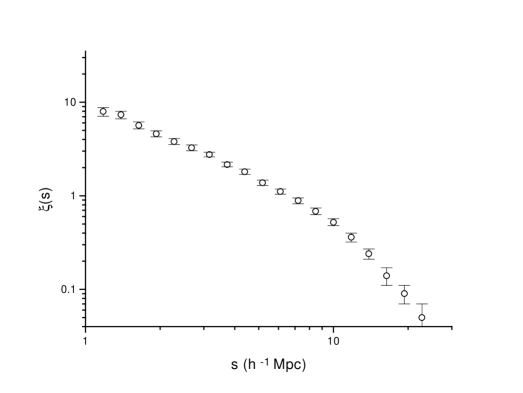
The NOG is in good agreement with the results of most redshift surveys of optical galaxies (especially the LCRS, see Tucker et al. ), which are characterized by very different geometries, volumes and selection criteria (see, e.g., Willmer et al. and references cited therein). We derive a smoother than previous works probing larger volumes (see, e.g., the results coming from the Stromlo-APM (Loveday et al. ) and Durham-UKST (Ratcliffe et al. ) redshift surveys), because the NOG contains a larger number of galaxies.
The agreement between different galaxy correlation functions derived for a wide range of volumes and sample radii is in contrast with the fractal interpretation of the galaxy distribution in the universe.
3.2 Morphological segregation
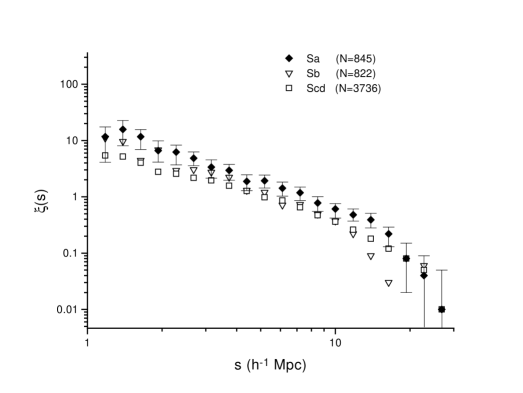
Subdividing the NOG into several morphological types, we note a pronounced morphological segregation between the E-S0 galaxies (), characterized by Mpc and , and the Sp objects (), characterized by Mpc and ). More specifically, there is a gradual increase of the strength of clustering from the Scd to the S0 objects, especially on intermediate scales, but this tendency does not extend to the earliest types which do not show a greater degree of clustering than the S0s (see Figs 2 and 3).
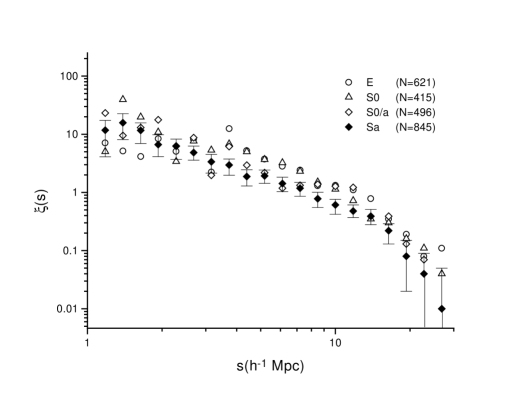
Contrary to some recent claims (Hermit et al. ; Willmer et al. ) the relative bias factor ( 1.7) between early- and late-type objects appears to be constant with scale.
3.3 Luminosity segregation
We analyze different volume-limited samples of galaxies at different depths to search for luminosity segregation within a given sample. We find that the luminous galaxies (both early and late types) are more clustered than the dim objects. The luminosity segregation starts to become appreciable only at relatively high luminosities (, i.e. ) and is independent on scale (at least up to Mpc). Our results are in line with a series of papers which reported evidence of luminosity segregation, although there is little consensus in the literature about the range of morphological types and luminosities at which the effect occurs (e.g., cf. Loveday et al. and Willmer et al. ).
The very luminous galaxies (; ) reside preferentially in binaries and groups (though not in clusters) and are characterized by Mpc.
The morphological and luminosity segregations appear to be two separate effects. The fact that they are detected also on large scales favors the interpretation that, on scales greater than Mpc, the bulk of these effects is likely to be mostly primordial in origin, i.e., inherent in schemes of biased galaxy formation (e.g., Bardeen et al. ) and not induced by late environmental effects.
4 The correlation function of NOG groups
The NOG P and H groups (with at least three members) are in general poor systems with typical (median) internal velocity dispersion of km/s, a virial radius of Mpc, a virial mass of , with the former groups being, on average, slightly more massive and smaller in size than the latter ones (see, e.g., Tucker et al. and Girardi & Giuricin for an overview of the properties of other catalogues of groups).
In Fig. 4 we show the weighted correlation functions of the H groups and P groups (with at least three members) compared to that of all galaxies. On small scales ( Mpc), the group correlation functions start dropping because of the anti-correlation due to the typical size of groups.
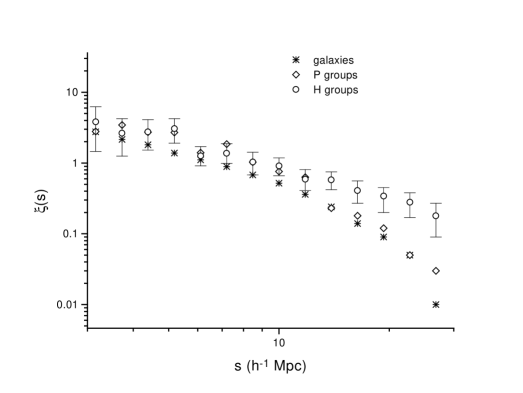
The correlation functions of the P and H groups show greater amplitudes than that of galaxies with an excess of clustering by a factor and , respectively. Although the two samples of groups are significantly different in the distributions of the above-mentioned dynamical quantities, they show similar clustering properties, at least on intermediate scales ( Mpc).
Power-law fits over the interval Mpc give Mpc, and Mpc, , respectively. Thus, groups appear to have a degree of clustering intermediate between galaxies and clusters. Our results are in good agreement with those by Girardi et al. , who reported a similar excess of clustering for the groups identified in the CfA2 and SSRS2 redshift surveys. (see Girardi et al. for earlier controversial results on the group correlation function).
We use the volume-limited samples of P and H groups at the depth of 4000 km/s to explore the dependence of the strength of clustering on some properties of groups. We find that groups with greater internal velocity dispersions, virial radii, mean pairwise member separations, and virial masses, tend to be more clustered than those with lower values of these quantities. On the other hand, there is no difference in the degree of clustering between groups with small and large proportions of early-type galaxies and with long and short crossing times.
Further details on the clustering analysis of the NOG sample will be presented in Giuricin et al. . Work on redshift-space distortions in the NOG is in progress.
References
References
- [1] Bardeen, J. M., Bond, J. R., Kaiser, N. Szalay, A. S. 1986, ApJ, 304, 15.
- [2] Carlberg, R. G. et al. 2000, ApJ, in press (astro-ph/0008201).
- [3] de Vaucouleurs, G. et al. 1991, Third Reference Catalogue of Bright Galaxies (New York: Springer).
- [4] Girardi, M., Boschin, W., da Costa, L. N. 2000, A & A, 353, 57.
- [5] Girardi, M. & Giuricin, G. 2000, ApJ, 540, 45.
- [6] Giuricin, G., Marinoni, C., Ceriani, L., Pisani, A. 2000a, ApJ, in press (preprint astro-ph/0001140).
- [7] Giuricin, G., Samurović, S., Girardi, M., Mezzetti, M., Marinoni, C. 2000b, submitted.
- [8] Hamilton, A. J. S. 1993, ApJ, 417, 19.
- [9] Hermit, S. et al. 1996, MNRAS, 283, 709.
- [10] Ling, E. N., Frenk, C. S., Barrow, J. D. 1986, MNRAS, 223, 21P.
- [11] Loveday, J., Maddox, S. J., Efstathiou, G., Peterson, B. A. 1995, ApJ, 442, 457.
- [12] Marinoni, C., Hudson, M. J., Giuricin, G. 2000, in preparation.
- [13] Marinoni, C., Monaco, P., Giuricin, G., Costantini, B. 1998, ApJ, 505, 484.
- [14] Marinoni, C., Monaco, P., Giuricin, G., Costantini, B. 1999, ApJ, 521, 50.
- [15] Merchán, M. E., Maia, M. A. G., Lambas, D. G. 2000, ApJ, in press (preprint astro-ph/0006407).
- [16] Ramella, M., Geller, M. J., Huchra, J. P. 1990, ApJ, 353, 51.
- [17] Ratcliffe, A. et al. 1996, MNRAS, 281, L47.
- [18] Trasarti-Battistoni, R., Invernizzi, G., Bonometto, S. A. 1997, ApJ, 475, 1.
- [19] Tucker, D. L. et al. 1997, MNRAS, 285, L5.
- [20] Tucker, D. L. et al. 2000, ApJ, in press (preprint astro-ph/0006153).
- [21] Willmer, C. N. A., da Costa, L. N., Pellegrini, P. S. 1998, AJ, 115, 869.