Accretion and Outflow in the Circinus AGN
Abstract
The first VLBI images of H2O maser emission in the Circinus Galaxy AGN show both an accretion disk and outflow 0.1 to 1 pc from the central engine. The maser traces a warped, edge-on accretion disk between radii of about 0.1 and 0.4 pc that is bound by a M⊙ central mass. The rotation curve is somewhat flatter than a Keplerian rotation law and is consistent with a disk mass on the order of M⊙. Clumpy substructure may display a kinematic signature consistent with spiral arms. Away from the disk, a second population of water masers traces broadly a bipolar, wide-angle outflow that contains (bullet-like) clumps ejected from a region centered on the central engine and pc in radius. Out to a radius of pc, the warp of the accretion disk appears to channel the outflow, the orientation of which on the sky coincides with the orientation of the known kiloparsec-scale ionization cone. Beyond this radius, the flow crosses the disk and truncates it. This suggests that the current accretion event and associated disk-outflow geometry have a lifetime on the order of years.
1 Introduction
The Circinus galaxy is one of the nearest Seyfert II galaxies that hosts an extragalactic H2O maser. (Freeman et al. 1977 estimate a distance of 4 Mpc.) The erg s-1 (2-10 keV) central engine is obscured at energies below 10 keV by a large gas column, n cm-2 ([Matt et al. 1999]). The X-ray spectrum also exhibits a prominent Fe K line that probably comprises reflected radiation ([Matt et al. 1996]). These characteristics suggest some similarity to another maser-host galaxy, NGC 1068.
The Circinus AGN exhibits an ionization cone ([Marconi et al. 1994]) within which Veilleux & Bland-Hawthorn (1997) observed linear optical filaments and compact knots reminiscent of Herbig-Haro objects. The cone opening angle is at least , at a mean position angle (PA) of roughly . The AGN also drives a kpc-scale nuclear outflow betrayed by bipolar radio lobes ([Elmouttie et al. 1998]) at PA , which are largely aligned with the minor axis the galactic H I disk ([Jones et al. 1999]) and a nuclear 12CO ring ([Curran et al. 1998]).
There is strong evidence that at least several extragalactic H2O masers trace edge-on accretion disks bound by central engines M⊙. These masers display (1) roughly linear structure in projection on the sky, (2) emission symmetrically bracketting the galactic systemic velocities, and (3) declining rotation curves that indicate more or less Keplerian differential rotation. Discovery of similar symmetry in the Circinus H2O maser spectrum (Nakai et al. 1995; Greenhill et al. 1997) led to speculation that there too the masers trace an accretion disk ([Greenhill et al. 1997]). Though the observation of an accretion disk in Circinus confirms that prediction, the discovery of qualitatively new, nondisk emission is equally interesting. In NGC 1068, disk emission is accompanied by secondary maser emission pc downstream in a jet, where material in the narrow line region deflects it ([Gallimore et al. 1996]). However, the nondisk emission in Circinus lies pc from the central engine and is more closely related to it.
2 Observations and Data
We observed the Circinus H2O maser three times for 18 hours each in 1997 (June & July) and 1998 (June) with four stations of the Australia Telescope Long Baseline Array, obtaining a half-power beamwidth of about milliarcseconds (mas). We recorded two 16 MHz bandpasses () at each station and correlated the data with the S2 processor in Marsfield, NSW . Following Fourier inversion of the correlation functions, each spectral channel corresponded to km s-1, which provided at least three channels across the half-power full-width of each spectral component.
We calibrated amplitudes, delays, and phases with standard VLBI techniques and the AIPS package. When possible we fitted a time-series of total-power spectra for each station to a calibrated template spectrum and computed multiplicative gain factors that would calibrate visibility amplitudes in units of Janskys. This calibration corrected for variations in antenna gain and in atmospheric attenuation and emission, with a relative accuracy (station-to-station, moment-to-moment) and 30% accuracy in absolute terms. When during one 1997 track the total-power signal was too weak for template fitting, we adjusted the gains to maintain constant peak visibility amplitude in the cross-power spectra. We used scans of 0537-448, 1144-379, 1424-418, and 1921-293 to estimate (and correct for) instrumental delays and fringe rates at better than the 2 ns and 2 mHz level (1998) or 5 ns and 5 mHz level (1997). We also estimated the stations’ complex bandpass responses from observation 1424-418 and 1921-293.
We estimated a new astrometric position for the masers by analyzing the time variation in fringe rate for the 565 km s-1 line. (We use the radio astronomical definition of Doppler shift.) The new position, , , is the most accurate estimate so far for the AGN.
We self-calibrated the emission within a few km s-1 of 565 km s-1, applied the calibration to each spectral channel, and created deconvolved synthesis images. The noise in the images () was 0.025 - 0.045 Jy, depending on the epoch and channel; the 1998 June observations were the most sensitive and best calibrated, because of equipment upgrades and a (coincidental) 40 Jy flare that made possible particularly accurate amplitude and phase calibrations. We fitted 2-D Gaussian model brightness distributions to each emission component in the deconvolved images that was stronger than .
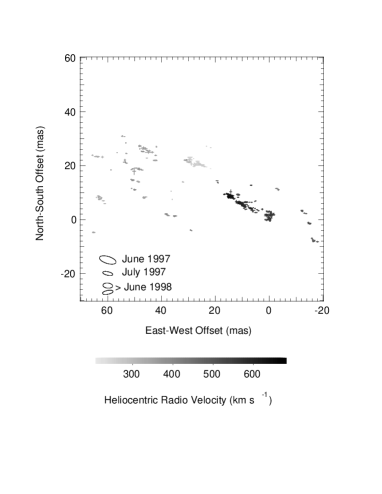
At each epoch, the emission near 565 km s-1 was strongest. However, because spectral lines come and go from epoch to epoch, we superposed maps of the emission component positions from each epoch, so as to trace the underlying dense molecular gas as completely as possible with the available data (Figure 1). We registered the maps with 0.2 mas accuracy by comparing the measured positions of the lines at 472 and 526 km s-1. (To achieve the stated noise levels, the 1997 data were smoothed using a moving average of up to six frequency channels, which “blurs” the map in crowded fields. The 1998 data were Hanning smoothed.)
3 Results
The maser emission comprises complexes of spectral lines that are redshifted and blueshifted with respect to the systemic velocity of the galaxy. In 1998 June, we detected emission between 214.8 km s-1 and 676.5 km s-1, a broader interval than the roughly 250 to 650 km s-1 range reported by Nakai et al. (1995) and Greenhill et al. (1997) in total-power observations. The mean velocity, , is consistent with the systemic H I velocity of the galaxy, km s-1 ([Freeman et al. 1977]), though emission on scales pc dominates measurement of the latter.
At each epoch, the sky distribution of maser emission may be divided into three populations (see Figure 1): (1) a thin, gently curved, S-shaped locus of highly redshifted and blueshifted emission arcs to the southwest and northeast, respectively (aka “high-velocity” emission), (2) emission close to the nominal systemic velocity of the galaxy (aka “low-velocity” emission) that lies between the high-velocity arcs, and (3) emission that is modestly Doppler shifted and broadly distributed in knots that lie north and west (redshifted) and south and east (blueshifted) of the low-velocity emission.
3.1 The Warped Disk
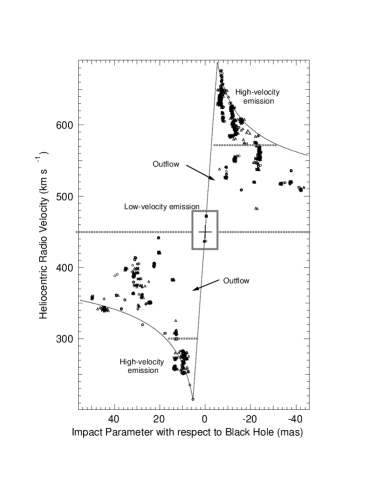
To the position and velocity data for high and low-velocity masers, we have fitted a model edge-on disk with smoothly varying position angle as a function of radius (Figures 2 & 3). The disk outer radius is (0.4 pc) and the thickness is thick. The orbital speed along the inner edge of the disk, at a radius of pc, is 237 km s-1. The mass enclosed is M⊙, assuming circular motion, and the model systemic velocity is km s-1. (Uncertainties reflect formal errors.) Among the redshifted high-velocity masers, the peak rotation velocity as a function of impact parameter from the dynamical center, , traces a rotation curve that declines as approximately (Figure 3), from which we infer a disk mass on the order of M⊙ between 0.1 and 0.4 pc. The disk is edge-on at a radius of 0.1 pc, but if the disk becomes inclined toward the outer radius, then the disk mass would be larger.
The model derives its strongest support from the following observations: (1) the sky distribution of high-velocity masers is highly elongated, roughly symmetric, and perpendicular to the approximate axis of the known ionization cone, (2) the apparent rotation curve is nearly Keplerian, (3) the most highly blue-shifted emission, innermost redshifted emission, and the low-velocity emission lie along a line on the sky, and (4) a single position-velocity gradient extends from the high-velocity blueshifted emission through the low-velocity emission to the high-velocity redshifted emission. The latter two observations are strong signatures of an edge-on disk in which the low-velocity emission lies close to the inner radius of the disk, as it does in NGC 4258 ([Miyoshi et al. 1995]).
Together with the shallow rotation curve, apparent clumpy substructure suggests that self-gravity is important in the disk. Estimates of the Toomre -parameter suggest that the disk is at best only marginally stable, due in part to its slow rotation speed (cf Maoz (1995) in discussion of NGC 4258). At the inner radius, where is greatest, , where is H2 particle density in units of cm-3 and is the disk thickness in units of 0.01 pc. (, where is the speed of sound, km s-1 at 400 K, is the angular rotation speed, and is the surface density.) Furthermore, the kinematic signature of at least two clumps among the redshifted high-velocity masers may indicate that spiral arms are present, specifically, the decline in line-of-sight velocity with increasing impact parameter. We infer that these clumps are elongated along the line of sight and cross the disk midline (i.e., the diameter perpendicular to the line of sight) at an angle. The angle is roughly the same in each case, which is suggestive of ordered structure, though the putative spiral may be fragmented.
3.2 The Outflow
A flow from the vicinity of the central engine is traced by: (1) emission between 300 and 450 km s-1 south and east of the dynamical center of the disk, and (2) emission between 450 and 580 km s-1, north and west of the dynamical center. This model demands that individual clumps are sufficiently luminous to be observable despite their great distance, but this is reasonable. A typical maser in the putative outflow is 0.1–0.5 Jy at a distance of 4 Mpc and would appear to be Jy were it at the distance of the W49N star forming region, which is not unusual ([Liljeström et al. 1989]). In contrast, it is unlikely that the maser emission arises in the accretion disk because of the irregular distribution of line-of-sight velocities on the sky, and because were the emission to arise in a disk, it would not originate where amplification paths (as dictated by geometry) are optimal.
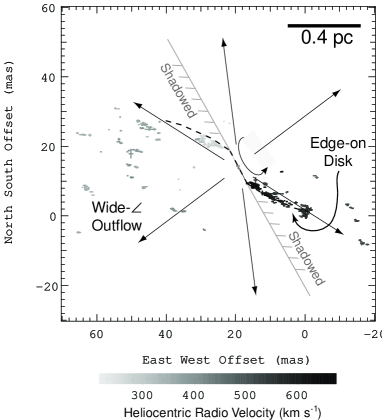
The segregation of red and blueshifted outflowing clumps on the sky suggests that the flow is inclined with respect to the line of sight, while the distribution on the sky suggests a wide-angle outflow. However, our census of outflowing clumps is incomplete because the inter-clump medium is probably ionized, as in narrow-line regions, and readily able to obscure emission from the far side of the outflow. (The known emission is close to our detection limit and an optical depth of a few requires only readily attainable emission measures of pc cm-6.) Because H2O maser emission requires H2 densities cm-3, the observed clumps are probably high-density “bullets” immersed in a thinner medium. Comparable interclump densities would imply a prohibitively large mass loss rate ( M⊙ yr-1) and unusually small accretion efficiency.
In principle the outflowing clumps may be ejected ballistically from the vicinity of the central engine (at radii pc) or shorn from the observed molecular disk (e.g., [Emmering, Blandford, & Shlosman 1992]; Kartje, Königl, & Elitzur 1999). In the absence of acceleration or proper motion data, ejection may be the preferred (and simplest) model for three reasons. First, some clumps lie close in projection to the rotation axis of the accretion disk across a range of impact parameters (i.e., from the disk inner radius to at least twice the disk outer radius) and velocities. Second, the line-of-sight velocity and position data do not betray rotation. Third, the physical conditions in the maser clumps are consistent with adiabatic expansion from conditions estimated for broad line clouds (i.e., densities of - 1012 cm-3 and temperatures of K, as in [Brotherton et al. 1994]).
The disk structure and rotation curve dissolve at a radius of pc, where the wind appears to disrupt the accretion disk, whose density presumably declines with increasing radius. In the model of Neufeld, Maloney, & Conger (1994) maser excitation depends on irradiation of molecular gas by hard X-rays. The proposition that the disk extends no farther than 0.4 pc from the central engine is strengthened by the circumstantial evidence that the outflow-borne masers all lie outside the shadow cast by the truncated disk. This would not be true for a broader disk. However, if the outflow subtends almost 90 % of str as seen from the central engine, then the accretion disk may be starved such that it will be exhausted on the order of yr, assuming a mass of M⊙, 10% accretion efficiency, and 10% emission fraction for hard X-rays.
The position angles at which the outflow is free of occultation by the 0.4 pc radius disk coincide with the limits of the kiloparsec scale ionization cone observed west of the nucleus ([Veilleux & Bland-Hawthorn 1997]). The southern edges of the redshifted maser outflow and the ionization cone, both lie at position angles of . The northern edge of the maser outflow, at , coincides roughly with the position angle of the northernmost [O III] filament () or a northeastern blue knot (). In addition, the mean axis of the maser outflow (), corresponds well to the orientation of the dominant [O III] filament () and a radio hotspot, observed with arcsecond resolution ([Elmouttie et al. 1998]), which could mark a radio jet, though none has yet been observed directly.
This work has been conducted in collaboration with R. S. Booth(1), S. P. Ellingsen(2), J. R. Herrnstein(3), D. L. Jauncey(4), P. M. McCulloch(2), J. M. Moran(5), R. P. Norris, J. E. Reynolds, and A. K. Tzioumis(4).
(1)Onsala Space Observatory; (2) University of Tasmania; (3)Renaissance Technologies; (4)Australia Telescope National Facility; (5)Harvard-Smithsonian Center for Astrophysics
References
- Brotherton et al. 1994 Brotherton, M. S., Wills, B. J., Francis, P. J., Steidel, C. C. 1994, ApJ, 430, 495
- Curran et al. 1998 Curran, S. J., Johansson, L. E. B., Rydbeck, G., Booth, R. S. 1998, A&A, 338, 863
- Elmouttie et al. 1998 Elmouttie, M., Haynes, R. F., Jones, K. L., Sadler, E. M., Ehle, M. 1998, MNRAS, 297, 1202
- Emmering, Blandford, & Shlosman 1992 Emmering, R. T., Blandford, R. D., Shlosman, I. 1992, ApJ, 385, 460
- Freeman et al. 1977 Freeman, K. C., Karlsson, B., Lynga, G., Burrell, J. F., van Woerden, H., Goss, W. M., Mebold, U. 1977, A&A,.55, 445
- Gallimore et al. 1996 Gallimore, J. F., Baum, S. A., O’Dea, C. P., Brinks, E., Pedlar, A. 1996, ApJ, 462, 740
- Greenhill et al. 1997 Greenhill, L. J., Ellingsen, S. P., Norris, R. P., Gough, R. G., Sinclair, M. W., Moran, J. M., Mushotzky, R. 1997, ApJ, 474, L103
- Jones et al. 1999 Jones, K. L., Koribalski, B. S., Elmouttie, M., & Haynes, R. F. 1999, MNRAS, 302, 649
- Kartje, Königl, & Elitzur 1999 Kartje, J. F., Königl, A., Elitzur, M. 1999, ApJ, 513, 180
- Liljeström et al. 1989 Liljeström, T., Mattila, K., Toriseva, M., Anttila, R. 1989, A&AS, 79, 19
- Marconi et al. 1994 Marconi, A.,Moorwood, A. F. M., Origlia, L., Oliva, E. 1994, Messenger, 78, 20
- Matt et al. 1996 Matt, G., Fiore, F., Perola, G. C., Piro, L., Fink, H. H., Grandi, P., Matsuoka, M., Oliva, E., Salvati, M. 1996, MNRAS, 281, L69
- Maoz 1995 Maoz, Eyal 1995, ApJ, 455, L131
- Matt et al. 1999 Matt, G., Guainazzi, M., Maiolino, R., Molendi, S., Perola, G. C., Antonelli, L. A., Bassani, L., Brandt, W. N., Fabian, A. C., Fiore, F., Iwasawa, K., Malaguti, G., Marconi, A., Poutanen, J. 1999, A&A, 341, L39
- Miyoshi et al. 1995 Miyoshi, M., Moran, J., Herrnstein, J., Greenhill, L., Nakai, N., Diamond, P., Inoue, M. 1995 Nature, 373, 127
- Nakai et al. 1995 Nakai, N., Inoue, M., Miyazawa, K., Miyoski, M., Hall, P. 1995, PASJ, 47, 771
- Neufeld, Maloney, & Conger 1994 Neufeld, D. A, Maloney, P. R., Conger, S. 1994, ApJ, 436, L127
- Veilleux & Bland-Hawthorn 1997 Veilleux, S., Bland-Hawthorn, J., 1997 ApJ, 479, L105