Kinematics, ages, and metallicities of star clusters in
NGC 1316:
A 3 Gyr old merger remnant††thanks: Based on
observations obtained at the European Southern Observatory, La Silla,
Chile (Observing Programme 60.E–0781).
Abstract
We report on multi-object spectroscopy in the red spectral region of 37 candidate star clusters in an arcmin2 field centered on the giant early-type radio galaxy NGC 1316 (Fornax A), the brightest galaxy in the Fornax cluster. Out of this sample, 24 targets are found to be genuine star clusters associated with NGC 1316, and 13 targets are Galactic foreground stars. For the star cluster sample, we measure a mean heliocentric velocity km s-1 and a velocity dispersion km s-1 within a galactocentric radius of 24 kpc. Partly responsible for the velocity dispersion is a significant rotation in the star cluster system, with a mean velocity of km s-1 along a position angle of . Using the projected mass estimator and assuming isotropic orbits, the estimated total mass is () 1011 M⊙ within a radius of 24 kpc. The mass is uncertain by about a factor of two, depending on the orbital assumptions. The implied / ratio is in the range 3 – 6. Four star clusters in our sample are exceptionally luminous (). This means that (1) at least this many clusters in NGC 1316 are up to an order of magnitude more luminous than the most luminous star cluster in our Galaxy or M 31, and (2) that the S/N ratio of their spectra allows us to measure line strengths with good accuracy. By comparing the measured colours and equivalent widths of H and the Ca ii triplet ( 8498, 8542, 8662 Å) absorption lines for those bright star clusters in our sample with those of single-burst population models (the Bruzual & Charlot 1996 models), we find that they are coeval with an age of 3.0 0.5 Gyr. Their metallicities are found to be solar to within 0.15 dex. We discuss the properties of the main body of NGC 1316 and conclude they are consistent with having hosted a major merger 3 Gyr ago as well. The presence of intermediate-age globular clusters in NGC 1316 shows once again that globular clusters with near-solar metallicity do form during galactic mergers, and, moreover, that they can survive disruption processes taking place during the merger (e.g., dynamical friction, tidal disruption), as well as evaporation. In this respect, NGC 1316 provides a hitherto “missing” evolutionary link between young merger remnants of age 0.5 Gyr such as NGC 3597, NGC 3921 and NGC 7252 on one side, and older giant ellipticals featuring bimodal colour distributions on the other side.
keywords:
galaxies: individual: NGC 1316 – galaxies: elliptical – galaxies: radio – galaxies: interactions – globular clusters: general1 Introduction
1.1 Extragalactic Globular Cluster Systems
Recent observations with the Hubble Space Telescope (HST) and large-field ground-based CCD cameras have caused rapid advances in our knowledge of the formation and evolution of star cluster systems of galaxies. Extragalactic star clusters have in recent years established themselves as potential tracers of the formation and evolution of galaxies. The number of detailed photometric studies is increasing steadily, and these studies reveal interesting connections between star cluster systems and their host galaxies.
One important, well-known aspect of star cluster systems among galaxies is that the number of star clusters per unit galaxy luminosity (named the specific frequency ) increases systematically from late-type to early-type galaxies, being 2–3 times higher in elliptical (E) than in spiral galaxies of type Sb and later (Harris & van den Bergh 1981; Harris 1991). This fact has been used as an argument against the scenario for forming ellipticals through mergers (e.g., van den Bergh 1995). However, recent observations with the HST have led to a wealth of discoveries of young star clusters in merging and starburst galaxies. Indeed, it now seems that star clusters in general (and globular clusters in particular) may form preferentially in high-density regions of starbursts (e.g., Meurer et al. 1995), probably from giant molecular clouds whose collapse is being triggered by a 100– to 1000-fold increase in gas pressure due to supernova and shock heating during starbursts (e.g., Elmegreen & Efremov 1997). Galactic gas-rich mergers are known to produce the most energetic known starbursts (e.g., Sanders & Mirabel 1996), to create galaxy remnants that have surface brightness profiles consistent with those of “old” giant ellipticals (Wright et al. 1990), and to create large numbers of young globular clusters (e.g., Whitmore 1999 and references therein). It is possible that the higher specific frequency of globular clusters in ellipticals relative to that in spirals may be accounted for by secondary populations of globular clusters created during gas-rich mergers.
In this respect, one particularly interesting feature of the star cluster systems of many giant ellipticals is the presence of bimodal colour distributions, providing clear evidence for the occurrence of a “second event” in the formation of these systems (e.g., Zepf & Ashman 1993; Whitmore et al. 1995; Geisler, Lee & Kim 1996; Kissler–Patig et al. 1997; Carlson et al. 1998). While such a bimodal colour distribution was actually predicted from merger models of E galaxy formation by Ashman & Zepf [1992], opinions about the general nature of the “second event” differ among authors (see detailed review by Ashman & Zepf 1998). In particular, the “second event” could actually be a series of different events that lead to the formation of metal-rich globular clusters. It is therefore important to obtain any additional evidence for (or against) a merger origin of the star cluster bimodality. One important constraint to any scenario to explain the bimodality is set by the colour of the “red” peak in the colour distribution among giant ellipticals, which (if interpreted in terms of metallicity) typically indicates a near-solar metallicity (e.g., Forbes, Brodie & Grillmair 1997 and references therein). This metallicity estimate has since been confirmed by Keck/LRIS spectroscopy of globular clusters in M 87 (Cohen, Blakeslee & Rhyzov 1998) and in NGC 1399 (Kissler–Patig et al. 1998). In order to render the scenario in which the second-generation “red” star clusters are formed during galaxy mergers generally applicable, it is therefore of great interest to find out just what the metallicities of the young, luminous star clusters in merger remnants actually are, and whether or not they can be found in merger remnants at different times after the last (major) merger.
The current evidence that young star clusters in mergers have approximately solar metallicities is still sparse. Photometry of these clusters typically does not provide enough information, due to the age-metallicity degeneracy of (especially optical) colours and the fact that most merger remnants contain extensive dust features with appreciable extinction. Progress has recently been made by using combinations of near-infrared and optical colours (Maraston et al. 2000), but this method is still in its infancy. The only dependable evidence stems from relatively strong metallic features observed in spectra of one bright cluster in the peculiar elliptical galaxy NGC 1275 (Zepf et al. 1995a; Brodie et al. 1998) and of two such clusters in NGC 7252 [1998], a prototypical, 0.5 – 1 Gyr old remnant of two merged spiral galaxies (Hibbard & Mihos 1995; Schweizer 1998). It is clear that the need for more spectroscopic metallicity estimates for young star clusters in (other) mergers is imminent.
Spectroscopy of star clusters around ellipticals can also provide one with the kinematics of the cluster system, another essential source of information for discriminating between different galaxy formation scenarios. For example, spectroscopic studies of M 87 and NGC 1399 revealed a significantly higher velocity dispersion for the globular clusters than for the stars (Mould et al. 1990; Brodie and Huchra 1991; Grillmair et al. 1994; Cohen & Ryzhov 1997; Minniti et al. 1998; Kissler–Patig & Gebhardt 1998; Kissler-Patig et al. 1999). As both M 87 and NGC 1399 are central cluster ellipticals, these authors suggested that the globular clusters were reacting to the gravitational potential of the galaxy cluster as a whole rather than that of the galaxy itself. In NGC 5128 (Cen A), Hui et al. [1995] reported rotation in the globular cluster system, though only for the metal–rich clusters which seemed to rotate along with the well-known dust lane. However, the situation in NGC 4472 (Sharples et al. 1998) and M87 (Kissler-Patig & Gebhardt 1998) seems to be different in that the metal–poor globular clusters seem to dominate the rotation.
The present paper describes new spectroscopic observations aimed at deriving kinematics, ages and metallicities for a suitable sample of star clusters in the merger remnant NGC 1316.
1.2 NGC 1316

The giant early-type galaxy NGC 1316 (= Fornax A = PKS 0320 37 = ESO 357 G022 = ARP 154) is one of the brightest and closest radio galaxies in the sky. It is located in the outskirts of the Fornax cluster, at a projected distance of 37 from NGC 1399, the central giant elliptical galaxy. The extensive optical observations of Schweizer (1980) showed that NGC 1316 is a typical Morgan D-type galaxy with an elliptical spheroid embedded in an extensive, box-shaped envelope. Several features of NGC 1316 establish firmly that it is a merger remnant. The outer envelope includes several non-concentric arcs, tails and loops that are most likely remnants of tidal perturbations, while the inner part of the spheroid is characterized by a surprisingly high central surface brightness and small core radius (and effective radius) for its galaxy luminosity (Schweizer 1981; Caon, Capaccioli & D’Onofrio 1994). These characteristics, together with a velocity dispersion which is significantly lower than that of other elliptical galaxies of similar luminosity, cause NGC 1316 to lie far off the fundamental plane of early-type galaxies or the Faber-Jackson relation (e.g., D’Onofrio et al. 1997). Furthermore, the inner spheroid is marked by non-concentric ripples of 0.1–0.2 mag amplitude above a best-fitting law (see discussion in Sect. 5.2.3). Figure 1 shows a -band image of the inner 75 75 of NGC 1316 (taken from Goudfrooij, Alonso & Minniti 2000) in which some of the features mentioned above can be found. All of these features are consistent with NGC 1316 having undergone a relatively recent merger after which dynamical relaxation has not yet had time to complete fully.
| Parameter | Value | Reference |
| RA (J2000.0) | 03d2241710 | * |
| DEC (J2000.0) | 37∘12′ 2941 | * |
| Galaxy Type | (R′)SAB(s)0 | RC3 |
| S01pec | RSA | |
| 109′′ | CCD94 | |
| 221 km s-1 | K00 | |
| 9.42 | RC3 | |
| 0.00 | BH84 | |
| 0.93 | RC3 | |
| 0.47 | RC3 | |
| 1760 km s-1 | NED | |
| Distance | 22.9 Mpc | ** |
| 22.38 | *** |
Notes to Table 1.
Parameters: Effective radius;
central velocity dispersion; Total B
magnitude; Absorption in B band
due to ISM in our Galaxy; ,
Mean colours inside the effective radius;
Heliocentric velocity;
Total absolute B magnitude, corrected for Galactic
absorption.
References: RC3 de Vaucouleurs et al. (1991); RSA Sandage
& Tammann (1987); CCD94 Caon et al. (1994);
K00 Kuntschner (2000);
BH84 Burstein & Heiles (1984);
NED NASA/IPAC Extragalactic Database (http://nedwww.ipac.caltech.edu);
* derived from archival HST/WFPC2 images;
** derived from supernova light curves, see text;
*** derived from and .
As to the adopted distance of NGC 1316, we take advantage of the fact that two well-observed type Ia supernovae (SNe Ia) have occurred in NGC 1316 (SN1980N and SN1981D). Using the precise distance indicator for SNe Ia that utilizes the tight relation between their light curve shape, luminosity, and colour (Riess et al. 1998; A. G. Riess, private communication), we arrive at a distance of 22.9 ( 0.5) Mpc for NGC 1316, equivalent to = (31.80 0.05). At this distance, 1′′ corresponds to 111 pc. Note that this sets NGC 1316 and the sub-group of galaxies surrounding it slightly behind the core of the Fornax cluster (for which = 31.54 0.14; Ferrarese et al. 2000). Global galaxy properties of NGC 1316 are listed in Table 1.
This paper is built up as follows. Section 2 describes the sample selection. The observations are described in section 3, while section 4 deals with the data reduction. The various results are presented and discussed in sections 5 and 6, respectively. Finally, section 7 summarizes the main conclusions of this study.
2 Selection of star cluster candidates
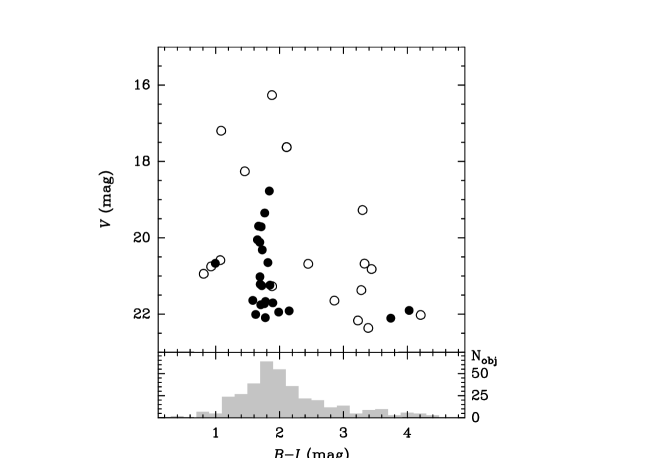
The sample of star cluster candidates was prepared from the target lists of Shaya et al. [1996] who used the first-generation Planetary Camera aboard HST (, imaging) and Goudfrooij et al. (2000, hereafter referred to as Paper II), who used ground-based (, , , , , ) imaging supplemented with the HST/WFPC2 imaging first published by Grillmair et al. [1999]. From these two lists of point-like sources around NGC 1316, a first cut was made by selecting only targets brighter than mag, which is the approximate limiting magnitude to obtain a signal-to-noise (S/N) within an exposure time of about 4-5 hours on a 4m-class telescope that is high enough for reliable velocity measurements. Apart from the bright stars that were chosen as pointing checks (see next Section), a further cut was then made by selecting only targets with (equivalent to at the assumed distance of NGC 1316), in order not to miss any possible massive, young or intermediate-age star clusters. As to the colour selection criterion, we made the following consideration. The colour distribution of compact objects in NGC 1316 is very broad (, cf. Paper II), peaking at about . In view of the fact that the central square arcmin of NGC 1316 is full of dust lanes and patches featuring large extinction values which may redden a number of star clusters, we considered the full observed range in for our target selection. A colour-magnitude diagram for the observed targets is shown in Fig. 2. The symbols show the different classes of targets, as resulting from the spectral data shown in this paper. A histogram of the colour distribution of compact objects in the field of NGC 1316 (from Paper II) is added to the figure for comparison.
3 Observations
Spectroscopy of the star cluster candidates in NGC 1316 was carried out during November 15-17, 1997, with the ESO 3.5-m New Technology Telescope (NTT) equipped with the ESO Multi-Mode Instrument (EMMI) in Multi-Object Spectroscopy (MOS) mode. The observational setup was identical to the one we described in detail in Minniti et al. [1998]. Here we give a somewhat shorter description.
The detector was a thin, back-illuminated CCD of type Tektronix TK2048EB Grade 2, having 20482048 sensitive pixels (of size 24 m = 0268 pixel-1). We used grism #4 (2.8 Å pixel-1, blazed at 6500 Å). The wavelength range is Å. The MOS slitlets had a width of 134, resulting in a wavelength resolution of 7.5 Å. We chose grism #4 in order to include the Ca ii triplet ( 8498, 8542, 8662 Å). The Ca ii triplet index is an excellent metallicity indicator, being independent of age for stellar populations older than about 1 Gyr (e.g., Bica & Alloin 1987; Díaz, Terlevich & Terlevich 1989; García-Vargas, Mollá & Bressan 1998).
Once the final target selection was made, it was decided to rotate the instrument by 90∘ because that made it possible to include all selected targets in only 2 MOS masks (covering each), thus making the most efficient use of telescope time. Before punching the slits onto the EMMI MOS plates, the distortion in the focal plane of the EMMI instrument has to be derived. To this end, short-exposure R-band images were kindly taken by the ESO NTT team during the night before our observing run, also using EMMI in the rotated position. The (, ) positions of our targets were measured from these images to produce the MOS masks. In each mask, a few slitlets were punched at positions corresponding to bright foreground stars in the field of view, which were used to check the telescope pointing. Furthermore, a few targets were observed through both masks to enable one to check for any systematic offsets between radial velocities derived using the different masks. One field was centered about 100′′ north of the centre of NGC 1316, and observed for a total exposure time of 14,400 s, and the other field (centered about 90′′ south of NGC 1316, and including star cluster candidates near the galaxy centre which, due to the higher galaxy surface brightness, require a longer exposure time) was exposed for a total of 17,900 s. Individual MOS exposures were typically of 1800 s duration, interleaved with HeAr lamp exposures and short imaging exposures to correct for small pointing errors due to flexure and differential atmospheric refraction. The latter corrections were always less than 03, and the air mass was always kept below 1.3. The weather was photometric throughout the observing run, and the seeing varied from 06 to 08 as judged from the direct images taken during the night.
4 Data reduction and velocity measurements
The data reduction of the multi-slit spectra was performed in a standard manner using the IRAF imred.specred package, just as described in Minniti et al. [1998]. The only noteworthy challenge was a proper subtraction of the local sky background from the targets that are close to the galaxy centre, where the galaxy background light is changing rather rapidly with radius. However, this problem was foreseen: We punched longer slits for those targets near the galaxy centre, enabling us to make reliable third-order polynomial fits to the galaxy background level as a function of position along the slit, which usually provided good results. The only two targets where special care was necessary were targets # 112 and # 114 ( knots D and E in Schweizer 1980, respectively) (cf. Table 2), since they are situated only 145 and 339 from the centre, respectively, within a filament system of ionized gas (cf. Schweizer 1980; Mackie & Fabbiano 1998). This introduces the additional problem of the presence of radially variable emission lines. This problem was dealt with as follows. We first subtracted the emission-line-free background light with the usual third-order polynomial fit to the background light, but explicitly excluding the wavelength regions around the emission lines [O i] , [N ii] , [S ii] , and [S iii] (redshifted according to the systemic velocity of NGC 1316) in the fitting procedure. The next (and final) step was to fit a polynomial to the positions and intensity of those emission lines in the background-subtracted spectra as a function of position along the slit, as if they represented a separate system of telluric lines. The background in between the emission lines associated with NGC 1316 was median filtered during the creation of this second “emission-line sky” spectrum to avoid any further degradation of the S/N ratio of the final object spectrum. This procedure proved successful in the case of target # 114, since its resulting spectrum (cf. Fig. 8) is free of any residual signs of [N ii] emission. However, the resulting spectrum of target # 112 still contains residual H and [N ii] emission lines, presumably due to its location on a compact, localized emission-line filament which is not present on the sky along the slitlet. Hence, target # 112 was excluded from the discussion on line strength indices in Section 5.3.
After wavelength calibration, the spectra were corrected for atmospheric extinction and flux calibrated using a spectrum of the spectrophotometric standard star LTT 1020 [1994], which was taken through one of the MOS slitlets at an airmass similar to those of the NGC 1316 exposures.
The final spectra were cross correlated with stellar template spectra using the method of Tonry & Davis [1979], incorporated in the fxcor task within IRAF. As template spectra we used both the radial velocity standard HR 1285 (a K0 iii star, taken though a MOS slitlet), and two bright foreground stars that were already observed as pointing reference stars. The spectral regions covered by molecular absorption lines due to the Earth atmosphere were explicitly excluded in the cross correlations. The zero point of the radial velocities was good to 50 km s-1 RMS, as judged from the cross correlations of the different templates against one another.
| RA | Dec | ||||||||
| ID | (J2000) | (J2000) | (km s-1) | (km s-1) | (km s-1) | (mag) | (mag) | (mag) | Classification |
| (1) | (2) | (3) | (4) | (5) | (6) | (7) | (8) | (9) | (10) |
| 103 | 03 22 28.47 | 37 11 24.5 | 1716 | 15 | 43 | 19.35 | 0.80 | 1.82 | Globular |
| 104 | 03 22 29.96 | 37 11 31.5 | 1895 | 59 | 92 | 21.25 | 0.81 | 1.78 | Globular |
| 106 | 03 22 32.07 | 37 10 36.8 | 2097 | 27 | 88 | 21.66 | 0.83 | 1.83 | Globular |
| 107 | 03 22 33.32 | 37 11 11.9 | 1254 | 3 | 70 | 21.70 | 0.87 | 1.95 | Globular |
| 110 | 03 22 36.60 | 37 10 55.1 | 1919 | 1 | 41 | 20.11 | 0.75 | 1.74 | Globular |
| 111 | 03 22 37.90 | 37 12 49.8 | 1599 | 59 | 46 | 20.31 | 0.78 | 1.78 | Globular |
| 112 | 03 22 39.61 | 37 12 42.0 | 1271 | 2 | 53 | 19.69 | 0.78 | 1.72 | Globular |
| 114 | 03 22 42.46 | 37 12 40.8 | 1306 | 26 | 44 | 18.77 | 0.86 | 1.89 | Globular |
| 115 | 03 22 43.51 | 37 11 26.0 | 1871 | 15 | 74 | 21.91 | 0.75 | 2.20 | Globular |
| 119 | 03 22 48.90 | 37 09 18.3 | 1970 | 60 | 360 | 20.67 | 0.54 | 1.05 | Globular |
| 121 | 03 22 50.96 | 37 12 27.8 | 1627 | 155 | 240 | 21.75 | 0.90 | 1.76 | Globular |
| 122 | 03 22 53.14 | 37 13 15.8 | 1657 | 4 | 130 | 21.90 | 2.00 | 4.08 | Globular |
| 123 | 03 22 54.12 | 37 10 17.2 | 1966 | 1 | 70 | 20.05 | 0.72 | 1.71 | Globular |
| 203 | 03 22 31.14 | 37 15 25.9 | 1639 | 35 | 68 | 22.09 | 0.83 | 1.83 | Globular |
| 204 | 03 22 29.35 | 37 13 20.9 | 1992 | 19 | 74 | 22.00 | 0.93 | 1.68 | Globular |
| 205 | 03 22 31.41 | 37 12 21.1 | 1569 | 24 | 66 | 20.65 | 0.83 | 1.87 | Globular |
| 207 | 03 22 33.90 | 37 12 31.9 | 1616 | 71 | 63 | 21.72 | 0.83 | 1.82 | Globular |
| 208 | 03 22 35.28 | 37 13 55.0 | 1657 | 34 | 130 | 21.64 | 0.84 | 1.63 | Globular |
| 210 | 03 22 37.99 | 37 13 07.1 | 1451 | 1 | 48 | 19.71 | 0.84 | 1.77 | Globular |
| 211 | 03 22 39.25 | 37 14 24.3 | 1654 | 33 | 123 | 22.10 | 1.76 | 3.79 | Globular |
| 212 | 03 22 40.37 | 37 13 19.4 | 1752 | 1 | 60 | 21.24 | 0.71 | 1.90 | Globular |
| 215 | 03 22 46.73 | 37 12 11.9 | 1540 | 2 | 61 | 21.02 | 0.79 | 1.75 | Globular |
| 216 | 03 22 48.01 | 37 11 36.6 | 1896 | 36 | 103 | 21.94 | 0.95 | 2.04 | Globular |
| 217 | 03 22 49.56 | 37 11 39.8 | 1840 | 8 | 63 | 21.21 | 0.74 | 1.75 | Globular |
| 105 | 03 22 30.64 | 37 11 46.0 | 25 | 18 | 50 | 21.65 | 1.48 | 2.96 | Star |
| 108 | 03 22 34.40 | 37 10 00.2 | 24 | 1 | 21 | 17.20 | 0.41 | 1.19 | Reference star |
| 109 | 03 22 35.39 | 37 09 59.9 | 3 | 36 | 50 | 21.37 | 1.38 | 3.38 | Star |
| 113 | 03 22 40.73 | 37 09 24.1 | 291 | 334 | 107 | 22.17 | 1.52 | 3.33 | Star |
| 117 | 03 22 46.55 | 37 12 27.7 | 21 | 46 | 64 | 20.82 | 1.31 | 3.54 | Star |
| 118 | 03 22 47.56 | 37 13 18.0 | 15 | 12 | 47 | 20.68 | 1.17 | 2.55 | Star |
| 124 | 03 22 55.36 | 37 12 32.2 | 20 | 2 | 36 | 20.68 | 1.48 | 3.43 | Star |
| 125 | 03 22 56.64 | 37 11 36.8 | 253 | 13 | 60 | 20.59 | 0.54 | 1.17 | Star |
| 126 | 03 22 58.23 | 37 11 38.2 | 7 | 0 | 30 | 17.63 | 1.04 | 2.21 | Reference star |
| 202 | 03 22 25.02 | 37 12 45.1 | 6 | 15 | 72 | 19.27 | 1.56 | — | Star |
| 206 | 03 22 32.11 | 37 13 07.3 | 35 | 9 | 173 | 22.02 | 1.69 | 4.31 | Star |
| 209 | 03 22 37.04 | 37 14 33.6 | 142 | 1 | 29 | 18.26 | 0.73 | 1.56 | Reference star |
| 213 | 03 22 42.14 | 37 11 14.6 | 430 | 5 | 73 | 21.27 | 0.67 | 1.98 | Star |
| 214 | 03 22 44.33 | 37 12 44.9 | 2 | 4 | 49 | 16.26 | 0.28 | 1.98 | Reference star |
| 218 | 03 22 51.17 | 37 14 20.4 | 165 | 23 | 65 | 20.94 | 0.39 | 0.91 | Star |
| 219 | 03 22 52.26 | 37 13 33.9 | 126 | 19 | 172 | 22.36 | 1.26 | 3.49 | Star |
| 220 | 03 22 55.10 | 37 15 00.0 | 240 | 57 | 82 | 20.75 | 0.46 | 1.03 | Star |
Notes to Table 2. Column (1) contains the target ID; columns (2) and (3) contain the J2000.0 equatorial coordinates. Units of RA are hours, minutes, and seconds; units of Dec are degrees, arcminutes, and arcseconds. For comparison, the J2000 coordinates of the nucleus of NGC 1316 are (RA, DEC) = (03d22m41710, 37∘12′2941). Column (4) lists the heliocentric radial velocities; columns (5) and (6) list the velocity uncertainties ( gives the formal error from the cross-correlation; gives the maximum difference of velocities derived using the different templates). Columns (7), (8) and (9) list the magnitudes and colours, respectively, and column (10) lists the object classification assigned by us. “Reference” stars designate stars that were used for pointing checks, cf. Section 3.

5 Results
5.1 Star cluster system membership
Table 2 lists the observed target list of star cluster candidates in NGC 1316. For each target we give an ID number, the J2000 equatorial coordinates, the heliocentric radial velocity and its uncertainties, the photometry in , and (taken from Paper II), and the assigned nature of the target (star / globular). The table has been sorted to separate stars and globular clusters for convenience.
A total of 17 targets are found to be Galactic foreground stars (see Table 2). Four of these were deliberately chosen as pointing alignment check (cf. Section 3); the other 13 stars turned out to be failed star cluster candidates. The remaining 24 targets are genuine star clusters associated with NGC 1316. This represents an overall “success rate” of 65%, although this is strongly a function of colour (e.g., it is 80% in the range 1.2 2.4 in which old, non-reddened clusters are expected). Figure 3 depicts the dependence of the heliocentric radial velocities on the magnitudes and colours for the foreground stars and the NGC 1316 star clusters. Note the clear separation in radial velocity between the foreground stars and the star clusters, and the rather narrow distribution of colours of the genuine star clusters. Only two of the selected “red” targets turned out to be star clusters. All other targets with are foreground M stars.
5.2 Analysis of the star cluster velocity field
5.2.1 Velocity distribution of the star clusters

Figure 4 shows a histogram of the heliocentric velocities of the star clusters in our sample. The velocity distribution exhibits two peaks: one on either side of the systematic velocity of the galaxy. Fitting a Gaussian to this distribution yields a mean heliocentric velocity km s-1, similar to the systemic velocity of NGC 1316 (cf. Table 1). The formal velocity dispersion of the full sample is km s-1. However, the double-peaked velocity distribution signals caution to be taken before assigning a physical meaning to this value of . Our interpretation of the double-peaked velocity distribution is a rotation of the star cluster system, cf. below.
5.2.2 Spatial distribution of the velocities

In Figure 5 we depict the relation of the star cluster velocities with their position angle (hereafter PA; measured from the nucleus of NGC 1316, North through East), as a function of projected galactocentric radius. Apart from a few outliers (e.g., the star cluster at PA 305∘, 1250 km s-1), the distribution of the velocities in this plot has a periodic appearance. Interpreting this as rotation of the star cluster sample, we fitted a flat rotation curve to the heliocentric velocities using the parametric function
where is the systemic velocity, is the rotation velocity, is the PA of the star cluster, and is the PA of the kinematic major axis of the star cluster system. The three free parameters were solved for numerically. The uncertainty of the fit is provided by the standard covariance matrix. The uncertainties of the individual velocities were also accounted for. However, the uncertainty of the derived rotation velocity is dominated by the high velocity dispersion of the star cluster system. The latter was derived after subtracting the best-fitting flat rotation curve. The fitting procedure was done twice: once by leaving a free parameter, and once by fixing to be the systemic velocity of the stellar component of NGC 1316, 1760 km s-1. The results of this parametric fitting of the velocity field are listed in Table 3.
| Rotation | Velocity | Position | Mean |
| velocity | dispersion | angle | velocity |
| (km s-1) | (km s-1) | (degrees) | (km s-1) |
| (1) | (2) | (3) | (4) |
| 179 68 | 202 33 | 1 17 | 1698 48 |
| 172 71 | 212 33 | 10 19 | 1760∗ |
Note — ∗ Fixed mean velocity to be NGC 1316’s systematic velocity.
No obvious trends of the rotation velocity with galactocentric radius are apparent from Figure 5. This is shown more directly in Figure 6, where we plot radial velocity vs. galactocentric radius for the star clusters. One possibly relevant feature in this plot is that the two innermost star clusters (within 30′′ from the centre) both have a radial velocity that is 450 km s-1 lower than the systematic velocity of NGC 1316. This difference is (in an absolute sense) 4 higher than the rotation velocity derived from the full star cluster sample. This might indicate either a significant amount of radial motion for those innermost star clusters, or the presence of differential rotation in the inner regions.

5.2.3 Comparison with the kinematics of stars and planetary nebulae
Arnaboldi et al. [1998] studied the dynamics in the outer regions of NGC 1316 using MOS spectra of planetary nebulae in NGC 1316. They find that the planetary nebulae in NGC 1316 rotate along PAPN = 80 30∘ with a rotation velocity = (140 60) km s-1 at a galactocentric radius of 4′, and a velocity dispersion = (175 18) km s-1. Note that while the rotation velocity and the velocity dispersion of their planetary nebula sample agree with those of our star cluster sample to within the combined 1 error, the PA of the kinematic major axis of the planetary nebula sample is different from that of the star cluster sample by 70∘ (although this is formally only a 2.5 result).
As to the kinematics of the integrated stellar light of NGC 1316, the PA of the kinematic major axis appears to be consistent with that of the apparent major axis of the isophotes in the inner 60′′, PA∗ 58∘(Arnaboldi et al. 1998; Bosma, Smith & Wellington 1985). Both Arnaboldi et al. and Bosma et al. report that the stellar velocity field in the inner 30′′ is consistent with NGC 1316 being an oblate, axisymmetric spheroid flattened by rotation and having isotropic velocity dispersion. However, irregular kinematic features are found at larger distances along both the major and minor axes: A jump of 30 km s-1 in radial velocity along the major axis is found at the position of a ripple (Bosma et al. 1985), and similar peculiar velocities and velocity dispersion values are also found along the minor axis (Arnaboldi et al. 1998). These features occur at positions where prominent shells or ripples are present (as checked on our direct CCD images). We argue that these features do not affect the global dynamics significantly, but are associated with the recent merger history of NGC 1316. Indeed, several authors have argued in the past that shells and ripples such as those found in NGC 1316 can be formed during a galaxy merger (e.g., Quinn 1984; Hernquist & Quinn 1988; Hernquist & Spergel 1992) or during a weak interaction (Thompson 1991). The shells and ripples reflect the various stages of the wrapping of the stars from the smaller galaxy around the centre of the potential. Peculiar velocities are indeed expected to be associated with the ripples, and the observed velocity jumps of 30 – 50 km s-1 are in agreement with the theoretical expectations (cf. Quinn 1984).
5.2.4 Mass estimates
Using the globular clusters in our sample as test particles within the underlying galaxy potential well, one can estimate a dynamical mass for the galaxy and derive its mass-to-light ratio for the inner 217′′ ( 24 kpc, the projected distance of our outermost cluster). We estimate the mass using all 24 velocities from globular clusters and applying the virial mass estimator and projected mass estimator (see, e,g., Bahcall & Tremaine 1981; Heisler et al. 1985). No assumption is made concerning the systemic velocity which was allowed to vary over a wide range, and masses are computed for various assumptions concerning the cluster orbits (radial, tangential, mixed, or isotropic), following Puzia et al. (2000). The results are displayed in Figure 7.
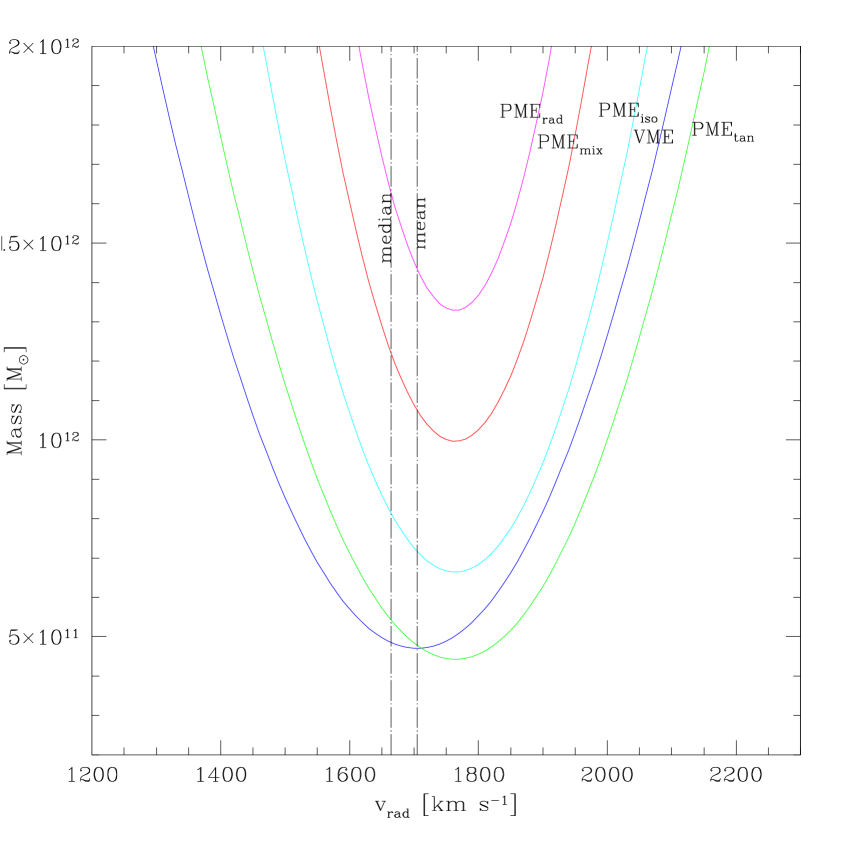
Note that the minimum masses are derived for systemic velocities close to 1760 km s-1, the heliocentric velocity of the integrated light of the galaxy. The minimum masses vary between M⊙ and M⊙ depending on the orbital assumptions. Each measurement has an internal uncertainty of % due to the limited spatial sampling, velocity errors, and sample size, and could rise by % by assuming a systematic velocity that is off by 100 km s-1. The masses are also dependent on the assumed distance. For instance, if NGC 1316 would be at the distance of the central part of the Fornax galaxy cluster as determined by a compilation of Cepheids, Surface Brightness fluctuations and Planetary Nebulae luminosity functions in other Fornax cluster galaxies (, Kavelaars et al. 2000), it would reduce the masses by %. The dynamical masses determined using the star clusters as test particles are consistent with those determined by Arnaboldi et al. (1998) using planetary nebulae, taking the difference in the assumed distances into account.
5.2.5 Mass-to-light ratios
As a working hypothesis to derive mass-to-light (/) ratios for the stellar component of NGC 1316, we will use the mass derived for isotropic orbits at the measured systemic velocity: M⊙.
Total galaxy luminosities in , , and were measured in a circular aperture of 220′′radius (the galactocentric radius of the outermost star cluster) using our optical and near-infrared surface photometry of the galaxy (presented in Paper II).
The results are listed in Table 4. The table also lists total luminosities for the integrated light of NGC 1316 after dimming to an age of 14 Gyr. To estimate the latter, we assumed that the stars within a 20′′ radius from the centre are 2 Gyr old (which is the luminosity-averaged age of the central 2 4′′, spectroscopically measured by Kuntschner 2000). Outside the 20′′ radius, we assume that the bulk of the stars are already old, since the colours and colour gradients in that radial range are consistent with those of “normal” giant elliptical galaxies (Goudfrooij, in preparation; Schweizer 1980). The actual dimming factors of the composite population were calculated using the population synthesis models of Bruzual & Charlot (1996). The resulting age dimming is only of order 0.1 mag in each band, both for Salpeter (1955) and Scalo (1986) stellar initial mass functions (IMFs). While this calculation is only a rough estimate, it should not be off by any significant amount unless the stellar population of the whole galaxy would —unexpectedly— be only a few Gyr old. However, we note that the resulting / ratios are rather low (e.g., /), which actually does indicate that the mean stellar population in NGC 1316 may be younger than usual for giant elliptical galaxies.
| Filter | Luminosity () | / ratio | Corrected luminosity () | corrected / ratio |
|---|---|---|---|---|
| 4.2 | 4.6 | |||
| 2.4 | 2.7 | |||
| 0.8 | 0.9 |
Notes to Table 4.
Luminosities are derived assuming MB,⊙ = 5.48, MI,⊙ = 4.07,
and MH,⊙ = 3.39 (Allen 1973; Campins, Rieke & Lebofsky 1985).
The listed / ratios have been calculated using isotropic orbits;
it can vary by a factor of 2 depending on the orbit assumptions made
5.3 Star cluster ages and metallicities
During the early 1990’s, a number of different groups have developed powerful evolutionary population synthesis models employing different stellar metallicities (Worthey 1994; Vazdekis et al. 1996; Bruzual & Charlot 1996, hereafter BC96; Bressan, Chiosi & Tantalo 1996; Maraston 1998). Hence, the determination of ages and metallicities of single-burst populations such as star clusters is now relatively straightforward in principle. However, the determination of ages and metallicities of populations of non-solar metallicity is hampered by the lack of model spectra of sufficient spectral resolution for metallicities other than solar. The model spectra of non-solar metallicity that are used in most spectrophotometric population synthesis models are based on the Kurucz (1995, private communication) atmospheres, which have an intrinsic wavelength resolution of 20 Å in the optical region. On the other hand, this is not a significant concern for the spectral indices we chose for deriving ages and metallicities (H and Ca ii, see below), since they are well resolved in the model spectra.
5.3.1 Line strength measurements
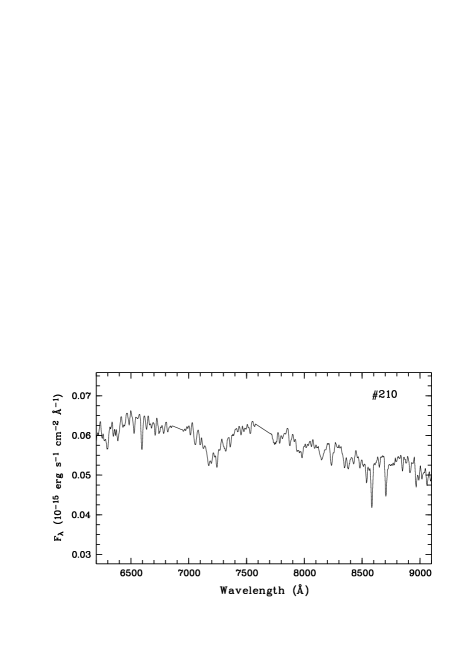
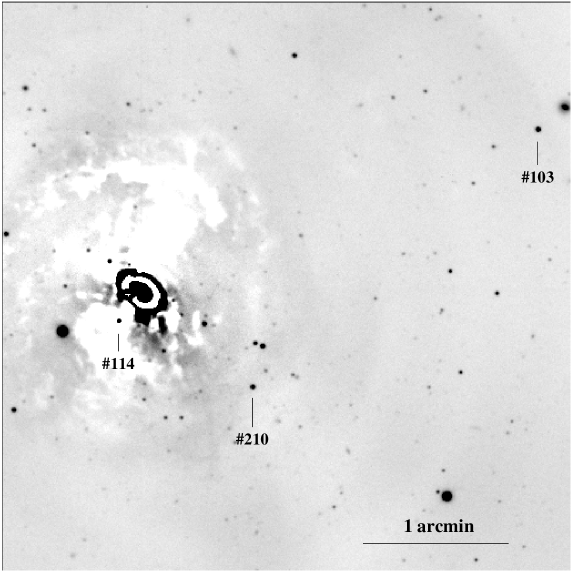
To determine star cluster ages and metallicities, the observed spectra were convolved with a Gaussian kernel in order to match the wavelength resolution of the model spectra. Line strengths were then measured from these smoothed observed spectra, and compared with those measured in an identical manner from a set of model spectra. To try to achieve a suitable break of the age–metallicity degeneracy using lines in our wavelength coverage, we measured H (being primarily age sensitive) and the Ca ii triplet, the equivalent width (hereafter EW) of which is controlled by the stellar metallicity for stellar populations older than 1 Gyr (Bica & Alloin 1987; Díaz et al. 1989; García-Vargas et al. 1998). The line strengths were measured as described in Goudfrooij & Emsellem [1996]. The errors were quantitatively estimated following Rich [1988]. Table 5 lists the measured equivalent widths for the three bright NGC 1316 star clusters with ID’s 103, 114, and 210. The spectra of the fainter clusters had a S/N too low for reliable line strength measurements. Figure 8 shows the flux-calibrated, extracted spectra of these star clusters. Their spatial position within NGC 1316 is illustrated in Figure 9 which depicts the -band “residual image” constructed from a -band image after subtraction of an elliptical isophotal model image (details on this are further discussed in Paper II).
The adopted passband for EW measurements of H was 24 Å wide. As to the Ca ii triplet measurements, we adopted the Ca T index
as defined by Díaz et al. [1989]. Their definition is well suited for the resolution of the model spectra.


| H | Ca ii 8542 | Ca ii 8662 | Ca T | Log Agea | [/]a | b | |
|---|---|---|---|---|---|---|---|
| Cluster ID | (Å) | (Å) | (Å) | (Å) | (yr) | (dex) | (mag) |
| 103 | 1.44 0.08 | 5.17 0.20 | 3.55 0.16 | 8.72 0.26 | 9.45 0.13 | 0.03 0.04 | 12.5 0.1 |
| 114 | 1.47 0.06 | 4.64 0.12 | 3.57 0.10 | 8.21 0.16 | 9.46 0.11 | 0.03 0.03 | 13.0 0.1 |
| 210 | 1.50 0.10 | 4.62 0.22 | 3.09 0.18 | 7.71 0.28 | 9.48 0.17 | 0.13 0.06 | 12.1 0.1 |
5.3.2 Age and metallicity estimates
Figures 10 and 11 illustrate the method used to derive cluster ages and metallicities from the measured equivalent widths. Figure 10 shows a diagram of EW(H) vs. EW(Ca T), in which the drawn lines represent the age–metallicity grid as measured from the model spectra of different ages and metallicities (BC96). We used the model spectra of Lejeune, Cuisinier & Buser [1997] for our analysis (see BC96 for details). Both Salpeter (1955) and Scalo (1986) stellar initial mass functions (IMFs) were considered. Since the results were indistinguishable for our purposes, we only plot the results using the Salpeter IMF in the diagrams. Note the diagnostic power of the EW(H) vs. EW(Ca T) diagram in breaking the age–metallicity degeneracy, especially for stellar populations with a (luminosity-weighted) age of 1–3 Gyr. This diagram yields cluster ages and metallicities encompassing remarkably narrow ranges: 2.8 Age 3.0 Gyr, and 0.13 0.03 (cf. Table 5).


These age– and metallicity estimates are compared to cluster colours in Figure 11. The two top panels show the evolution of EW(H) and EW(Ca T) as a function of metallicity, as before. The two other panels in Figure 11 show the evolution of and in the Kron-Cousins system, again using the models of BC96. For comparison with the models, Figure 11 also shows the measured EWs and colours —marked by horizontal lines— of the three bright NGC 1316 star clusters. Note that for about solar metallicity (as derived from the Ca T measurements), the star cluster colours indicate Log (Age) 9.45 (i.e., Age 3 Gyr), which is completely consistent with those derived from EW(H) to within the uncertainties.
Note that the H and Ca T equivalent widths of the star clusters by themselves also allow for an alternative cluster age of 107 yr (cf. Figure 11). However, comparison of the colours of the clusters with those of the BC96 models shows that this alternative solution would require those clusters to be highly reddened (by 0.7 0.8). Since two of these three clusters (#103 and #210) are located well away from the dust features near the galaxy centre (cf. Figure 9) and since the spectral continuum shape of the three clusters are extremely similar to one another (cf. Figure 8), this possibility is extremely unlikely (in fact, the similarity between the spectra and colours of the three clusters argues that cluster #114 is located in front of the dust patches onto which it is superposed on the sky). Hence, we assume in the following that the bright star clusters are 3 Gyr old. Obtaining additional high-S/N blue-to-visual spectra of these clusters (including the higher-order Balmer lines) would certainly enable one to discriminate conclusively between the two ages described above.
6 Discussion
In this section we discuss various issues regarding the physical nature of the observed star clusters in NGC 1316, and the relevance of the age and metallicity of these clusters to (i) observed properties of the main body of NGC 1316, and (ii) the nature of bimodal colour distributions of globular cluster systems in “normal” giant elliptical galaxies.
6.1 Nature of intermediate-age clusters in NGC 1316
6.1.1 Cluster luminosities and masses
Given the distance of NGC 1316 ( = 31.8), the luminosities of the three bright star clusters are high (13.0 for ID#114, 12.5 for ID#103, and 12.1 for ID#210, cf. Table 5). For comparison, the most luminous (by far) globular cluster in our Galaxy, Cen, has 10.2 (e.g., Meylan et al. 1995), and G1, the most luminous cluster in M 31, has 10.85 (Reed et al. 1994). According to the BC96 models, a 3 Gyr old cluster with a Salpeter IMF fades by only 1.5 mag over the next 11 Gyr (or by 1.4 mag with a Scalo IMF). Hence, at an age of 14 Gyr, these three clusters should have absolute magnitudes () of (at least) 11.5, 11.0, and 10.6, i.e., 2.8, 1.7, and 1.2 times as luminous as Cen, respectively. Assuming / = 4.1 as for Cen [1995], this indicates impressive cluster masses of 1.4 107 M⊙ for #114, 8.5 106 M⊙ for #103, and 6.0 106 M⊙ for #210, after evolving to an “old” age of 14 Gyr. These masses are similar to that of G1 in M 31, the most massive globular cluster known from kinematic measurements ( M⊙, Meylan et al. 1997, 2000).
6.1.2 Open or globular clusters ?
Grillmair et al. [1999] studied the star cluster system of NGC 1316 using HST/WFPC2 images, whereby they excluded the data within a 70′′ galactocentric radius to avoid the dusty areas. They found a luminosity function (LF) of the star clusters that does not resemble the log-normal globular cluster LF observed in almost all globular cluster systems of “normal” (presumed old) elliptical galaxies (see, e.g., Ashman & Zepf 1998). Instead, the LF seemed to increase all the way to the faintness limits of their photometry. This LF behaviour has been seen in other merger remnants as well, NGC 4038/4039 (Whitmore & Schweizer 1995; Whitmore et al. 1999), NGC 3597 [1999] and NGC 3256 [1999] being three well-studied cases. In view of the fact that the open cluster population in our Galaxy shows an LF whose shape is similar to that of the star clusters in NGC 1316, Grillmair et al. [1999] argue that these objects may be young open clusters rather than globular clusters (an argument used as well by van den Bergh [1995] for the case of NGC 4038/4039). However, the new evidence provided by the much older age of the bright star clusters in NGC 1316 (with respect to those in the young merger remnants mentioned above) in combination with the high cluster luminosities and masses renders the nature of these objects to be genuine globular clusters beyond any reasonable doubt, at least in NGC 1316.
As to the apparent disagreement between our conclusion and that of Grillmair et al. [1999], we wish to note that only one of the three clusters for which we have spectroscopic age measurements was covered by the WFPC2 imaging of Grillmair et al., and that the size distribution of clusters brighter than 23.5 is indistinguishable from that in NGC 1399, an old elliptical galaxy (cf. Figure 12 of Grillmair et al.). On the other hand, we consider it quite likely that the faint end of the observed cluster system in NGC 1316 may be partly populated by open clusters, in agreement with Grillmair et al.’s conclusion. In fact, these are quite likely candidates of star clusters that will be destroyed over the next 10 – 12 Gyr as a result of evaporation and/or tidal shocking (see, e.g., Meylan & Heggie 1997). Gradual removal of these objects from the cluster system would conceivably leave behind a log-normal LF as observed in cluster systems of “normal” giant ellipticals. This issue will be discussed further in Paper II.
6.1.3 Fate of young and intermediate-age clusters
Extraordinarily luminous, massive, and metal-rich globular clusters such as the ones found here are now known to be quite common in young merger remnant galaxies, e.g., NGC 1275 (Zepf et al. 1995a, Brodie et al. 1998), NGC 7252 (Schweizer & Seitzer 1998), and NGC 3597 (Carlson et al. 1999), all of which have cluster ages of order 300 – 500 Myr. The fate of these massive clusters has been an issue of some debate. From spectroscopy of luminous clusters in NGC 1275, Brodie et al. (1998) found H and H EWs that are somewhat larger than those of any BC96 models that use Salpeter or Scalo IMFs. They argued that the large Balmer EWs can only be brought into agreement with the BC96 models by assuming a flatter IMF, which they mimic by introducing a low-mass cutoff of 2 M⊙ and a high-mass cutoff of 3 M⊙ to the IMF. With such a small or absent low-mass stellar component, they argue that the young clusters should fade away in only 1 109 yr. On the other hand, the 500 Myr young clusters in NGC 7252 show Balmer line strengths that are well reproduced by the BC96 models that use the standard Salpeter or Scalo IMF (Schweizer & Seitzer 1998). Again, the presence of similarly massive, but 2.5 Gyr older, globular clusters in NGC 1316 shows that such luminous clusters can survive the dynamically hot period during the first few Gyr after a galaxy merger. We suggest that these high masses be checked through velocity dispersion measurements such as those performed by Ho & Filippenko [1996] for the brightest young cluster in NGC 1569. One should be able to perform such measurements with 8 – 10 m class telescopes, at least for clusters #114 and #103. If the high masses are confirmed for these 3 Gyr old clusters in NGC 1316, it would provide strong evidence in support of the view that mergers of (gas-rich) galaxies can form very massive clusters, with masses similar to or larger than the largest ones present in our Galaxy or M 31.
6.2 A formation scenario for NGC 1316
How does the 3 Gyr age of the bright clusters in NGC 1316 relate to the properties of its main (stellar and gaseous) body? While a multitude of features of NGC 1316 firmly establish its being a merger remnant (e.g., tidal tails, shells and ripples, small effective radius; see Introduction), the complicated structure of NGC 1316 has hampered an accurate reconstruction of its merger history.
However, recent numerical simulations of major disk-disk mergers (e.g., Hibbard & Mihos 1995; Barnes & Hernquist 1996) reveal several features that are very similar to those in NGC 1316. In particular, we would like to point out that several properties of NGC 1316 are remarkably consistent with it being an evolved remnant of a merger event similar to the one which formed NGC 7252 (0.5 – 1 Gyr ago, cf. Schweizer & Seitzer 1998). These consistencies go far beyond the similarity of the masses and metallicities of their respective bright globular clusters.
To set the stage for this comparison, we mention the results of Hibbard et al. (1994)’s optical, X-ray, and H i observations of NGC 7252. H i exists in large amounts in its tidal tails. However, H i is not detected in its main stellar body. X-ray emission from hot (106 – 107 K) gas is detected from the main stellar body, with a luminosity that is higher than the typical X-ray luminosity of a spiral galaxy of the same optical luminosity as NGC 7252. To explain the H i observations, Hibbard & Mihos (1995) performed -body simulations of NGC 7252. They successfully modeled the H i velocity reversal in the tails as gaseous material from the pre-merger disks that has reached its orbital turnaround point and is falling back towards the central regions of the merger remnant. Furthermore, their best-fitting numerical model for NGC 7252 raised several issues relevant to the current comparison with NGC 1316, which are discussed below.
-
1.
The fate of cold gas in the progenitor disks. Extrapolating from the current H i content of NGC 7252’s tidal tails, Hibbard & Mihos (1995) found that several 109 M⊙ of atomic gas had already flown inward since the merger took place. As no H i is found in the inner regions, this atomic gas must have been converted into other forms. Indeed, hydrodynamical simulations have shown that in the rapidly changing potential of major mergers, the gas is unable to avoid collisions, thus dissipating energy and moving inward (e.g., Mihos & Hernquist 1994). The high-density clouds within this infalling gas may well be compressed into molecular form (and subsequently form stars and/or star clusters, depending on the gas compression achieved (Jog & Solomon 1992; Elmegreen & Efremov 1997)), while the low-density gas may shock-heat to the virial temperature (radiating in the soft X-rays). Indeed, NGC 7252 contains a large amount of cold molecular gas in its inner regions (Dupraz et al. 1990) as well as extended X-ray-emitting gas (Hibbard et al. 1994). Radio continuum data of the central regions of NGC 7252 (where the molecular gas is found, cf. Hibbard et al. 1994) indicates a modest star formation rate of 1 – 2 M⊙ yr-1 (Condon 1992). At this rate, the remaining molecular gas would turn into stars within 2 – 4 Gyr (Dupraz et al. 1990). During that time, one would expect the X-ray luminosity to grow as the remaining atomic and molecular gas contents are shock-heated or evaporated by electrons within the already existing hot plasma (e.g., Goudfrooij & Trinchieri 1998). Furthermore, if the merger produced a remnant with a deep enough potential well, the hot plasma would be supplemented by gas donated by mass loss from evolving giant stars and SNe Ia and virialized in the potential well of the remnant (e.g., Brighenti & Mathews 1999).
The observed properties of NGC 1316 fit in remarkably well with this evolutionary merger scenario: CO observations by Sage & Galletta (1993) revealed the presence of 1 109 M⊙ of molecular gas. While this is a large amount relative to the molecular gas content of “normal” giant elliptical galaxies (see, e.g., Knapp & Rupen 1996), the molecular gas is found to be already depleted in the central region, being concentrated in the dusty regions at 30 – 50 arcsec from the centre instead (Sage & Galletta 1993). In the context of the scenario presented above, this is entirely consistent with the situation expected a few Gyr after the merger took place. Furthermore, a recent analysis of optical spectra of the central 3′′ of NGC 1316 reveals a stellar population with a luminosity-weighted age of 2 Gyr and a metallicity that is as high as other giant elliptical galaxies of similar luminosity (Kuntschner 2000). This is again entirely consistent with the scenario of an evolved major merger: The merger occurred 3 – 3.5 Gyr ago (as indicated by the age of the bright globular clusters) after which stars continued forming within the molecular gas in the central regions for a few Gyr (the latter process has now apparently largely ceased). In fact, the unusually small core radius and effective radius of NGC 1316 (Schweizer 1980; Caon et al. 1994) are most probably due to this star formation episode in the central regions. Finally, the predicted build-up of hot, X-ray-emitting gas since the merger event has indeed occurred in NGC 1316: analysis of ROSAT observations have shown the presence of 109 M⊙ of hot (107 K) gas, part of which is (still?) distributed in tails and loops around the galaxy (Kim, Fabbiano & Mackie 1998).
-
2.
Tidal features are long-lived. Another important result of the numerical simulations of NGC 7252 by Hibbard & Mihos (1995) was that the tidal tails are not freely expanding. Instead, the most tightly bound bases of the tails were found to turn around most quickly, followed gradually by the material at larger distances from the centre. The rate of return was found to fall off roughly as , implying that tidal features such as those in NGC 7252 stay visible for several Gyr. In the particular case of NGC 7252 they found that at a time of 4 Gyr after the merger222Assuming H0 = 75 km s-1 Mpc-1, roughly 20% of the current B-band luminosity of the tidal tails remains outside 4 effective radii from the galaxy centre. It is therefore quite plausible that at least some of the large tidal tails and loops around NGC 1316 still stem from a major merger event similar to the one that formed NGC 7252, i.e., one during which the 3 Gyr old, solar-metallicity globular clusters were formed. However, we do not mean to imply that all tails and loops in NGC 1316 necessarily stem from one merger event. In particular, the tidal tail located 65 southwest of the centre (just outside our CCD field of view, but shown in Figures 2 and 6 in Schweizer 1980, denoted L1) likely stems from a significantly more recent interaction with a small, gas-rich galaxy (cf. Mackie & Fabbiano 1998).
6.3 Relevance to the nature of bimodal colour distributions in giant ellipticals
Assuming that the luminous, metal-rich globular clusters in NGC 1316 were formed 3 Gyr ago during a major merger involving two spiral galaxies, what does the expected colour distribution of the resulting globular cluster system look like? Is it consistent with the observed one? Will it evolve into a bimodal colour distribution as seen in many “normal” giant ellipticals?
We have seen in Section 5.1 and Figure 2 that the observed colour distribution of genuine clusters in NGC 1316 is not bimodal but spans a rather narrow range around = 1.85 (cf. also Grillmair et al. 1999), consistent with the colour predicted by the BC96 models for a 3 Gyr old, single-burst population of solar metallicity. In contrast, old, metal-poor, Milky Way halo globular clusters have colours around 1.5 – 1.6. However, the post-merger cluster system of NGC 1316 should still contain many of the bulge/halo globular clusters that were associated with the progenitor galaxies. Is the observed colour-magnitude diagram consistent with the presence of such “old” globulars as well? To address this question, we plot the predicted time evolution of the colour and the absolute magnitude for single-burst populations older than 1 Gyr in Figure 12 (again using the BC96 models). For 14 Gyr old clusters, the observed colour interval is found to be consistent with a metallicity range of , while the mean colour would indicate . While this seems somewhat higher than the median metallicity of the sample of halo globular clusters in our Galaxy ( = 0.03 , cf. Harris 1996333Compiled at http://www.physics.mcmaster.ca/Globular.html), it is also somewhat lower than the median metallicity of the globular cluster system that is associated with the bulge of our Galaxy ( = 0.25 ; Minniti 1995). This actually suggests that the old clusters in NGC 1316 may be a mixture of clusters from two progenitor spiral galaxies with different bulge-to-disk ratios. To assess the reality of this suggestion, we encourage the development of numerical simulations of interactions of galaxies having bulge and halo globular cluster systems. The result of such simulations can be expected to significantly further our understanding of the nature of globular cluster systems with bimodal colour distributions, and their associated power as witness of the processes occurring during galaxy formation.

Finally, the lower panel of Figure 12 depicts the time evolution of the absolute magnitude (as well as at the distance of NGC 1316) for a globular cluster similar to Cen ( = 5 106 M⊙, Meylan et al. 1995). Taking this to be a typical brightest globular cluster of any spiral galaxy, one can see that the “old”, metal-poor clusters are expected to be fainter than 21.0. After the second-generation, solar-metallicity clusters evolve to an age of 14 Gyr, the BC96 models predict a cluster like Cen to be 21.7 and 2.2, i.e., those clusters will have 0.7 mag fainter and 0.3 mag redder (for a given cluster mass) than the clusters associated with the progenitor galaxies. These numbers are remarkably consistent with those of typical globular cluster systems (associated with giant ellipticals) which exhibit bimodal colour distributions (e.g., Zepf, Ashman & Geisler 1995; Forbes et al. 1998; Grillmair et al. 1999).
We conclude that the observed colour distribution of clusters in NGC 1316 is entirely consistent with that expected from a mixture of (i) intermediate-age clusters of age 3 Gyr having near-solar metallicities and (ii) “old” (14 Gyr), metal-poor clusters that were associated with progenitor galaxies. As such, the colour distribution of this cluster system is expected to evolve into a bimodal one, having properties consistent with those of well-studied giant ellipticals. The details of the appearance of the final colour distribution of the system will depend on the ratio of the number of newly formed clusters to the number of “old” clusters, which is little constrained at this point. We do know, however, that the massive end of the mass function of the newly formed clusters is at least as well populated as in the Milky Way and M 31 (i.e., as systems with several hundred clusters).
7 Main conclusions
We have obtained spectra for 37 candidate star clusters in the field of the giant early-type galaxy NGC 1316, an obvious merger remnant featuring extensive shells, tails, and dusty filaments. Our main conclusions are as follows.
-
•
The radial velocity measurements reveal that 24 targets are genuine star clusters, and 13 targets are Galactic foreground stars. Almost all (22/24) genuine star clusters fall in the narrow colour range , i.e., only 2 red targets with are highly reddened star clusters, the rest are foreground stars.
-
•
For the star cluster sample, we measure a mean heliocentric velocity km s-1 and a velocity dispersion km s-1 within a galactocentric radius of 24 kpc. Partly responsible for the velocity dispersion is a significant rotation in the star cluster system, with a mean velocity of km s-1 along a position angle of . Using the projected mass estimator and assuming isotropic orbits, the estimated total mass is () 1011 M⊙ within a radius of 24 kpc. The mass is uncertain by about a factor of two, depending on the orbital assumptions and adopted distance. The above mass implies a / ratio in the range 3 – 6, which is low for giant elliptical galaxies. This may indicate that the stellar population of the integrated light of NGC 1316 is, in a luminosity-weighted sense, younger than usual.
-
•
For three bright star clusters in our sample, the signal-to-noise ratio is good enough to measure equivalent widths of H and the Ca ii triplet absorption lines with confidence. Comparing those line strengths as well as measured broad-band colours with recent single-burst stellar population models (BC96), the metallicities of those 3 star clusters are found to be solar to within 0.15 dex, and their most likely age is 3 Gyr.
-
•
We discuss the properties of the main body of NGC 1316 itself and conclude they are consistent with having hosted a major merger 3 Gyr ago as well. The presence of intermediate-age globular clusters in NGC 1316 shows once again that globular clusters with near-solar metallicity do form during galactic mergers, and, moreover, that they can survive disruption processes taking place during the merger (e.g., dynamical friction, tidal disruption), as well as evaporation. In this respect, NGC 1316 provides a hitherto “missing” evolutionary link between the recently studied young merger remnants of 0.5 Gyr age such as NGC 3921 and NGC 7252 on one side, and “old” giant ellipticals featuring bimodal colour distributions on the other side.
Acknowledgments.
PG is grateful to the European Southern Observatory for an invited visitorship during which part of this research was carried out, and for allocating observing time to this project. We acknowledge enlightening discussions with François Schweizer, Claudia Maraston, and Adam Riess. We have made use of the NASA/IPAC Extragalactic Database (NED) which is operated by the Jet Propulsion Laboratory, Caltech, under contract with the National Aeronautics and Space Administration. JM and PG would like to thank the director of STScI for financial support through the Director’s Discretionary Research Fund. The work of DM is partly supported by the Chilean FONDECYT No. 01990440.
References
- [1973] Allen, C. W., 1973, Astrophysical Quantities. Athlone, London
- [1998] Arnaboldi, M., Freeman, K. C., Gerhard, O., et al., 1998, ApJ, 507, 759
- [1992] Ashman, K. M., Zepf, S. E., 1992, ApJ 384, 50
- [1998] Ashman, K. M., Zepf, S. E., 1998, Globular Cluster Systems. Cambridge University Press, Cambridge
- [1981] Bahcall, J. N., Tremaine, S., 1981, ApJ, 224, 805
- [1996] Barnes, J. E., Hernquist, L., 1996, ApJ, 471, 115
- [1987] Bica, E., Alloin, D., 1987, A&A, 186, 49
- [1985] Bosma, A., Smith, R. M., Wellington, K. J., 1985, MNRAS, 212, 301
- [1996] Bressan, A., Chiosi, C., Tantalo, R., 1996, A&A, 311, 425
- [1999] Brighenti, F., Mathews, W. G., 1999, ApJ, 512, 65
- [1991] Brodie, J. P., Huchra, J. P., 1991, ApJ, 379, 157
- [1998] Brodie, J. P., Schroder, L. L., Huchra, J. P., Phillips, A. C., Kissler–Patig, M., Forbes, D. A., 1998, AJ, 116, 691
- [1996] Bruzual, G. A., Charlot, S., 1996, private communication (BC96)
- [1984] Burstein, D., Heiles, C., 1984, ApJS, 54, 33
- [1985] Campins, H., Rieke, G. H., Lebofsky, M. J., 1985, AJ, 90, 896
- [1994] Caon, N., Capaccioli, M., D’Onofrio, M., 1994, A&AS, 106, 199
- [1999] Carlson, M. N., Holtzman, J. A., Grillmair, C. J., et al., 1999, AJ, 117, 1700
- [1997] Cohen, J. G., Rhyzov, A., 1997, ApJ, 486, 230
- [1998] Cohen, J. G., Blakeslee, J. P., Rhyzov, A., 1998, ApJ, 496, 308
- [1992] Condon, J. J., 1992, ARA&A, 30, 575
- [1991] de Vaucouleurs, G., de Vaucouleurs, A., Corwin, G., et al., 1991, Third Reference Catalog of Bright Galaxies. Springer-Verlag, New York (RC3)
- [1989] Díaz, A. I., Terlevich, E., Terlevich, R., 1989, MNRAS, 239, 325
- [1997] D’Onofrio, M., Capaccioli, M., Zaggia, S. R., Caon, N., 1997, MNRAS, 289, 847
- [1997] Dupraz, C., Casoli, F., Combes, F., Kazes, I., 1990, A&A, 228, L5
- [1997] Elmegreen, B. G., Efremov, Yu. N., 1997, ApJ, 480, 235
- [2000] Ferrarese, L., Ford, H. C., Huchra, J. P., et al., 2000, ApJS, 128, 431
- [1997] Forbes, D. A., Brodie, J. P., Grillmair, C. J., 1998, AJ, 113, 1652
- [1998] Forbes, D. A., Grillmair, C. J., Williger, G. M., Elson, R. A. W., Brodie, J. P., 1998, MNRAS, 293, 325
- [1998] García-Vargas, M. L., Mollá, M., Bressan, A., 1998, A&AS, 130, 513
- [1996] Geisler, D., Lee, M. G., Kim, E., 1996, AJ, 111, 1529
- [1996] Goudfrooij, P., Emsellem, E., 1996, A&A, 306, L45
- [1998] Goudfrooij, P., Trinchieri, G., 1998, A&A, 330, 123
- [2000] Goudfrooij, P., Alonso, M. V., Minniti, D., 2000, in preparation (Paper II)
- [1994] Grillmair, C. J., Freeman, K. C., Bicknell, G. V., et al., 1994, ApJ, 422, L9
- [1999] Grillmair, C. J., Forbes, D. A., Brodie, J. P., Elson, R. A. W., 1999, AJ, 117, 167
- [1994] Hamuy, M., Suntzeff, N. B., Heathcote, S. R., Walker, A. R., Gigoux, P., Phillips, M. M., 1994, PASP 106, 566
- [1991] Harris, W. E., 1991, ARA&A 29, 543
- [1996] Harris, W. E., 1996, AJ, 112, 1487
- [1981] Harris, W. E., van den Bergh, S., 1981, AJ 86, 1627
- [1985] Heisler, J., Tremaine, S., Bahcall, J. N., 1985, ApJ, 298, 8
- [1995] Hernquist, L., Quinn, P. J., 1988, ApJ, 331, 682
- [1992] Hernquist, L., Spergel, D. N., 1992, ApJ, 399, L117
- [1995] Hibbard, J. E., Mihos, J. C., 1995, AJ, 110, 140
- [1996] Hibbard, J. E., van Gorkom, J. H., 1996, AJ, 111, 655
- [1994] Hibbard, J. E., Guhathakurta, P., van Gorkom, J. H., Schweizer, F., 1994, AJ, 107, 67
- [1996] Ho, L. C., Filippenko, A. V., 1996, ApJ, 466, L83
- [1995] Hui, X., Ford, H. C., Freeman, K. C., Dopita, M. A., 1995, ApJ, 449, 592
- [1992] Jog, C. J., Solomon, P. M., 1992, ApJ, 387, 152
- [1998] Kavelaars, J. J., Harris, W. E., Hanes, D. A., Hesser, J. E., Pritchet, C. J., 2000, ApJ, 533, 125
- [1998] Kim, D.-W., Fabbiano, G., Mackie, G., 1998, ApJ, 497, 699
- [1997] Kissler–Patig, M., Kohle, S., Hilker, M., Richtler, T., Infante, L., Quintana, H., 1997, A&A, 319, 470
- [1998] Kissler–Patig, M., Gebhardt, K., 1998, AJ, 116, 2237
- [1998] Kissler-Patig, M., Brodie, J. P., Schroder, L. L., Forbes, D. A., Grillmair, C. J., Huchra, J. P., 1999, AJ, 115, 105
- [1999] Kissler–Patig, M., Grillmair, C. J., Meylan, G., Brodie, J. P., Minniti, D., Goudfrooij, P., 1999, AJ, 117, 1206
- [1996] Knapp, G. R., Rupen, M. P., 1996, ApJ, 460, 271
- [2000] Kuntschner, H., 2000, MNRAS, 315, 184
- [1997] Lejeune, T., Cuisinier, F., Buser, R., 1997, A&AS, 125, 229
- [1998] Mackie, G., Fabbiano, G., 1998, AJ, 115, 514
- [1998] Maraston, C., 1998, MNRAS, 300, 872
- [2000] Maraston, C., et al., 2000, submitted to A&A
- [1995] Meurer, G. R., Heckman, T. M., Leitherer, C., Kinney, A., Robert, C., Garnett, D. R., 1995, AJ, 110, 2665
- [1997] Meylan, G., Heggie, D. C., 1997, A&AR, 8, 1
- [1995] Meylan, G., Mayor, M., Duquennoy, A., Dubath, P., 1995, A&A, 303, 761
- [1997] Meylan, G., Jablonka, P., Djorgovski, S. G., et al., 1997, BAAS, 191, 4415
- [2000] Meylan, G., Jablonka, P., Djorgovski, S. G., et al., 2000, in preparation
- [1994] Mihos, J. C., Hernquist, L., 1994, ApJ, 431, L9
- [1995] Minniti, D., 1995, AJ, 109, 1663
- [1998] Minniti, D., Kissler–Patig, M., Goudfrooij, P., Meylan, G., 1998, AJ, 115, 121
- [1990] Mould, J. R., Oke, J. B., de Zeeuw, P. T., Nemec, J. M., 1990, AJ, 99, 1823
- [2000] Puzia, T. H., Kissler-Patig, M., Brodie, J. P., Schroder, L. L., 2000, AJ, 120, 777
- [1984] Quinn, P. J., 1984, ApJ, 279, 596
- [1994] Reed, L. G., Harris, G. L. H., Harris, W. E., 1994, AJ, 107, 555
- [1988] Rich, R. M., 1988, AJ, 95, 828
- [1998] Riess, A. G., Filippenko, A. V., Challis, P., et al., 1998, AJ, 116, 1009
- [1993] Sage, L. J., Galletta, G., 1993, ApJ, 419, 544
- [1955] Salpeter, E. E., 1955, ApJ, 121, 161
- [1987] Sandage, A. R., Tammann, G. A., 1987, A Revised Shapley-Ames Catalog of Bright Galaxies. Carnegie Institution of Washington, Washington, D.C.
- [1996] Sanders, D. B., Mirabel, I. F., 1996, ARA&A, 34, 749
- [1986] Scalo, J. M., 1986, Fundam. Cosmic Phys., 11, 1
- [1980] Schweizer, F., 1980, ApJ, 237, 303
- [1981] Schweizer, F., 1981, ApJ, 246, 722
- [1998] Schweizer, F., 1998, in Friedli D., Martinet L., Pfenniger D., eds, “Galaxies: Interactions and Induced Star Formation”. Springer, Berlin, p. 105
- [1998] Schweizer, F., Seitzer, P., 1998, AJ, 116, 2209
- [1996] Shaya, E. J., Dowling, D. M., Currie, D. G., et al., 1996, AJ, 111, 2212
- [1998] Sharples, R. M., Zepf, S. E., Bridges, T. J., et al., 1998, AJ, 115, 2337
- [1991] Thomson, R. C., 1991, MNRAS, 253, 256
- [1979] Tonry, J., Davis, M., 1979, AJ, 84, 1511
- [1995] van den Bergh, S., 1995, ApJ, 450, 27
- [1996] Vazdekis, A., Casuso, E., Peletier, R. F., Beckman, J. E., 1996, ApJS, 106, 307
- [1999] Whitmore, B. C., 1999, in Barnes J. E., Sanders D. B., eds, “Galaxy Interactions at Low and High Redshift”. Kluwer, Dordrecht, p. 251
- [1995] Whitmore, B. C., Schweizer, F., 1995, AJ, 109, 960
- [1995] Whitmore, B. C., Sparks, W. B., Lucas, R. A., Macchetto, F. D., Biretta, J. A., 1995, ApJ, 454, L73
- [1999] Whitmore, B. C., Zhang, Q., Leitherer, C., Fall, S. M., Schweizer, F., Miller, B. W., 1999, AJ, 118, 1551
- [1994] Worthey, G., 1994, ApJS, 95, 107
- [1990] Wright, G. S., James, P. A., Joseph, R. D., McLean, I. S., 1990, Nat, 344, 417
- [1993] Zepf, S. E., Ashman, K. M., 1993, MNRAS, 264, 611
- [1995a] Zepf, S. E., Carter, D., Sharples, R. M., Ashman, K. M., 1995, ApJ, 445, L19
- [1995b] Zepf, S. E., Ashman, K. M., Geisler, D., 1995, ApJ, 443, 570
- [1999] Zepf, S. E., Ashman, K. M., English, J., Freeman, K. C., Sharples, R. M., 1999, AJ, 118, 752