Radio Halo and Relic Candidates from the Westerbork Northern Sky Survey
Abstract
We have undertaken a systematic search for diffuse radio halos and relics in all of the Abell clusters that are visible in the Westerbork Northern Sky Survey (WENSS). In this survey we found 18 candidates, 11 of which are already known from the literature, and 7 for which we provide the first evidence of diffuse radio emission. All the clusters in this sample show other evidence for a recent or ongoing merger. We also investigate the correlation between cluster X-ray luminosity and radio power of halos. We develop a very simple model for merger shocks that reproduces the sense of this correlation, although it is probably not as steep as the correlation in the data. We discuss the implications of X-ray–radio correlations for future detections of radio halos.
1 Introduction
A number of clusters of galaxies are known to contain large-scale diffuse radio sources which have no obvious connection to the clusters’ population of galaxies. These sources are referred to as radio halos when they appear projected on the center of the cluster, and are called relics when they are found on the cluster periphery. Because of projection effects, the distinction between halos and relics is physically debatable, but does provide a convenient classification for their discussion. It is also possible that halos and relics in fact have different physical origins, as we discuss below. Halos (and relics; we will use “halos” hereafter for brevity) are believed to be produced by synchrotron emission from a population of relativistic electrons which have been accelerated or reaccelerated, possibly by shocks in the intracluster medium (e.g., Jaffe 1977; Roland 1981; Schlickeiser et al. 1987). These shocks may be the product of cluster mergers. In fact, all known halos are found in clusters which show other signs of being in some stage of a merger (e.g., Feretti 1999; Schuecker & Böhringer 1999). In the early stages of mergers, halos are often found on the border between the subclusters, where the cluster gas is first being shocked (e.g., Abell 85; Slee & Reynolds 1984). In more advanced mergers, more conventional centrally located halos (e.g., Coma) and peripheral relics (e.g., Abell 3667) are found.
The most common explanation of the physical origin of halos and relics is that they originate from particle acceleration in merger shocks, but other theories have been suggested. Enßlin et al. (1998) suggest that relics may trace shocks created in the initial structure formation of the Universe. Liang et al. (2000) posits that turbulent reacceleration may maintain the population of cosmic rays necessary to produce a halo after they have been accelerated initially by merger shocks. There is also disagreement over whether the cosmic ray electrons are accelerated directly from the thermal population or are re-accelerated cosmic rays previously produced in starbursts and AGN. Alternately, the secondary electron model (Dennison 1980; Blasi & Colafrancesco 1999 and references therein) proposes that the necessary electrons are created as a result of interactions between cosmic ray protons and the intracluster gas. The secondary electron model is unique in that it does not require a merger to create a radio halo.
Halos and relics are rare phenomena, with only about 10–20 having been known until quite recently. With the completion of the NRAO VLA Sky Survey (NVSS: Condon et al. 1998) and Westerbork Northern Sky Survey (WENSS: Rengelink et al. 1997), systematic searches for additional sources have been possible, yielding about 25 new halos and relics. Evidence on the exact origin of halos and relics is still unclear, mostly because of their small numbers. With a larger sample, however we can begin to determine if the merger shock picture of their formation is correct, and perhaps even disentangle the different mechanisms for halo and relic formation, if they are in fact different phenomena.
We assume km s-1 Mpc-1 and throughout this paper.
2 Sample and Source Selection
We conducted our search for new halos and relics using the publicly available images of the WENSS. The survey has an angular resolution of at declination , a typical noise level of 3.6 mJy beam-1, and covers the sky north of .
Our search was strictly limited to galaxy clusters in the ACO catalog (Abell 1958; Abell, Corwin & Olowin 1989) that fall within the region covered by the WENSS. This gave us a sample of 1001 clusters up to a redshift of . With the good coverage of the survey, the images were sensitive to extended structures of up to in diameter. We were therefore able to detect cluster-wide halos with a typical size of 1 Mpc at redshifts , which covers the entire Abell catalog. Sources 1 Mpc in size do not become unresolved by the WENSS beam until a redshift much greater than the limit of the Abell catalog.
We searched for diffuse sources using images from the WENSS on their own as well as using these images overlaid on images from the Digital Sky Survey (DSS). Our criteria for a positive detection were that the sources had to a) have regions of surface brightness greater than the 2 level, b) be resolved, c) not be associated with an optically identified galaxy, d) not be clearly associated with a known extended radio galaxy, and e) not be an obvious blend of unresolved sources. We used images from the NVSS, and from the FIRST survey where available (Becker, White, & Helfand 1995) to check for the existence of point sources. In clusters within about of a very bright (peak-flux-to-rms ) source, uncleaned sidelobe structure had the potential for causing confusion, but the large sizes of the WENSS images enabled us to identify these cases and avoid confusion. We further compared the WENSS images to images from the ROSAT All-Sky Survey (RASS; Voges 1992; Trümper 1993) for information about the X-ray morphology of the clusters.
For sources which are resolved but smaller than about , the WENSS is surface brightness limited. Figure 2 shows the mean surface brightnesses of the sources in our sample as a function of redshift. The dashed line is the nominal 1 surface brightness limit of WENSS (3.6 mJy beam-1). The mean surface brightness was determined for each source by spreading its integrated flux evenly over a convex region which just encloses the 2 surface brightness contours for that source. In reality, however, few of the sources fill this region completely, and most of them have splotchy surface brightness distributions with peaks which are much higher than this average value. This is the reason that our survey limit on the mean surface brightness appears to be be slightly below the WENSS noise limit. Note that our cluster survey would not be sensitive to sources which are very close or very large () or sources which are very small or very distant, which would be unresolved (1′).
![[Uncaptioned image]](/html/astro-ph/0010251/assets/x1.png)
Mean surfaces brightnesses and redshifts are shown for the detected sources, with halos indicated by squares and relics by triangles. The mean surface brightness assumes that the flux is distributed over a convex region which just encloses the 2 surface brightness contours. The nominal 1 surface brightness limit of the WENSS (3.6 mJy beam-1) is indicated by the dashed line.
3 Halo and Cluster Candidates
Using the criteria detailed above, we found a sample of 16 clusters containing candidate halos or relics. Of this sample, 7 were not known prior to this study, while 9 had previously been discovered. Of the previously known halos and relics which fell into our sample, all but one (Abell 2218, see §4) were detected in this study. Abell 2218 is included in our analysis for completeness. The halo in Abell 2218 was not detected because it was nearly unresolved in WENSS. Five of the seven new detections are associated with clusters which are not part of the Ebeling et al. (1996) catalog of X-ray bright clusters, and therefore were not in the NVSS sample (Giovannini et al. 1999) that comprises about half of the previously known halos and relics in our sample.
Table 1 lists the candidate clusters. For each cluster, we list the name, redshift , position, X-ray luminosity in the 0.1–2.4 keV rest frame energy range, Rood-Sastry (1971) class, Bautz-Morgan (1970) class, radio morphology, and whether the cluster halo/relic had been detected previously. Data in columns 2, 3, and 4 are taken from Ebeling et al. (1996) except where noted. The X-ray luminosities in column 5 came from the literature (sources noted), except for A 796, where the luminosity was determined from the RASS flux. Column 8 gives the morphology of the radio source: “H” for a halo, “R” for a relic, and “u” for uncertain. According to convention, we classified diffuse sources as halos if they were centered on the cluster and as relics if they appeared on the cluster periphery. Sources whose status as a halo or relic are uncertain were labeled as such. These include faint sources, sources which may be a blend of unresolved sources, and sources which have tentative but not obvious associations with optical sources. Uncertain sources comprise about half of our sample of new detections.
| Name | RA (J2000) | Dec. | (0.1–2.4 keV) | RSaaRS types are as follows: cD = single cD galaxy; B = “binary,” two dominant galaxies; F = “flat,” no dominant galaxy; C = “clumpy” spatial distribution of galaxies; L = “linear” distribution of galaxies; I = “irregular” galaxy distribution. | BMbbBautz-Morgan types are as follows: type II clusters have no cD galaxy but have one or more Virgo-type giant ellipticals; type III clusters have no dominant galaxies; type II-III are intermediate; a colon after the type indicates an uncertain type estimate. | Radio | Previously | |
|---|---|---|---|---|---|---|---|---|
| (h m s) | ( erg s-1) | MorphologyccRadio morphology notation is: H = halo; R = relic; u = uncertain. | Detected? | |||||
| A 665 | 0.1818 | 08 30 47.4 | +65 51 14 | 14.786 | I c | III: | H | y |
| A 697 | 0.2822 | 08 42 57.6 | +36 21 59 | 16.305 | F | II-III | u | n |
| A 725 | 0.09217 | 09 01 10.1 | +62 37 20 | 0.801 | I c | R | n | |
| A 773 | 0.2170 | 09 17 54.0 | +51 42 58 | 12.356 | B | II-III: | H | y |
| A 786 | 0.12418 | 09 28 49.7 | +74 47 55 | 1.531 | F | R | y | |
| A 796 | 0.1475eeRedshift estimated using the method described by Ebeling et al. (1996); these clusters’ positions are taken from Abell (1958) except where another reference is indicated. | 09 28 00.0 | +60 23 00 | 1.38 | C | III | u | n |
| A 1240 | 0.1566eeRedshift estimated using the method described by Ebeling et al. (1996); these clusters’ positions are taken from Abell (1958) except where another reference is indicated. | 11 23 37.6 | +43 05 523 | 1.363 | C | III | R+R | n |
| A 1452 | 0.06308 | 12 03 38.8 | +51 44 18 | C | u | n | ||
| A 1758a | 0.2800 | 13 32 45.3 | +50 32 53 | 11.224 | F | u | y | |
| A 1914 | 0.1712 | 14 26 02.2 | +37 50 06 | 17.936 | L | II: | H | y |
| A 2034 | 0.1130 | 15 10 11.7 | +33 29 12 | 6.864 | L | II-III: | R | n |
| A 2061 | 0.0777 | 15 21 17.0 | +30 38 24 | 3.924 | L | III: | R | n |
| A 2218 | 0.1710 | 16 35 52.8 | +66 12 59 | 8.776 | C | II: | H | y |
| A 2219 | 0.2281 | 16 40 22.5 | +46 42 22 | 19.804 | F | III | u | y |
| A 2255 | 0.0809 | 17 12 45.1 | +64 03 43 | 5.686 | C | II-III: | H | y |
| A 2256 | 0.0581 | 17 04 02.4 | +78 37 55 | 6.996 | B | II-III: | H+R | y |
| A 2319 | 0.0555 | 19 21 05.8 | +43 57 50 | 12.996 | cD | II-III | H | y |
In Table 2, we list the properties of the halo and relic candidates themselves. Clusters with multiple sources have one entry for each source. Columns 2 and 3 list the WENSS and NVSS fluxes, respectively, as determined by the WENSS 2 surface brightness contours. In clusters where point sources were superposed on the likely extent of the diffuse emission, we could not satisfactorily subtract off those sources due to substructure in the beam. Instead, we masked out the sources and added a systematic error to our measurement which assumes that the surface brightness in the masked regions is equal to the average in the unmasked area. This may in some cases underestimate the actual error if sidelobes from these sources are present in the unmasked area, or if the surface brightness in the masked region differs significantly from the mean. Col. 4 gives the spectral index derived from these fluxes. Here, the radio power varies with frequency as . Col. 5 lists the monochromatic radio power of the source at 327 MHz in the cluster rest frame. The derived spectral index is used to correct for the redshift, assuming that the same spectral index holds for lower observed frequencies. The position in columns 6 and 7 is the estimated center of the diffuse source. Columns 8 and 9 list the largest angular size of the source and the corresponding largest linear size at the redshift of the cluster, both evaluated at 327 MHz. Column 10 gives the projected distance of the source from the cluster center (see Table 1) for relic sources only.
| Name | RA (J2000) | Dec. | Distance | ||||||
|---|---|---|---|---|---|---|---|---|---|
| (mJy) | (mJy) | () | (h m s) | () | (′) | (kpc) | (Mpc) | ||
| A 665 | 08 30 58 | +65 50 | 8.0 | 1900 | |||||
| A 697 | 08 42 56 | +36 22 | 2.9 | 920 | |||||
| A 725 | 09 01 29 | +62 38 | 3.2 | 440 | 0.31 | ||||
| A 773 | 09 18 04 | +51 42 | 5.3 | 1400 | |||||
| A 786 | 09 22 16 | +75 00 | 8.2 | 1400 | 5.0 | ||||
| A 796 | 09 27 38 | +60 23 | 6.1 | 1200 | |||||
| A 1240N | 11 23 28 | +43 10 | 4.0 | 850 | 1.3 | ||||
| A 1240S | 11 23 47 | +43 01 | 4.6 | 960 | 1.5 | ||||
| A 1452 | 12 03 18 | +51 45 | 7.9 | 780 | |||||
| A 1758 | 13 32 44 | +50 32 | 4.3 | 1300 | |||||
| A 1914aaDiscrete sources superposed on diffuse emission have been masked out as described in the text. | 14 25 58 | +37 48 | 6.8 | 1500 | |||||
| A 2034 | 15 10 17 | +33 31 | 5.7 | 920 | 0.35 | ||||
| A 2061 | 15 20 06 | +30 29 | 7.7 | 920 | 2.1 | ||||
| A 2218 | 16 35 46 | +66 12 | 1.5 | 340 | |||||
| A 2219 | 16 40 11 | +46 44 | 2.9 | 810 | |||||
| A 2255aaDiscrete sources superposed on diffuse emission have been masked out as described in the text. | 17 12 54 | +64 04 | 7.6 | 930 | |||||
| A 2256RaaDiscrete sources superposed on diffuse emission have been masked out as described in the text. | 17 02 57 | +78 43 | 15.8 | 1450 | 0.66 | ||||
| A 2256HaaDiscrete sources superposed on diffuse emission have been masked out as described in the text. | bbPower calculated by assuming the spectral index of given by Costain et al. (1972) with an associated error of . | 17 04 46 | +78 39 | 7.6 | 700 | ||||
| A 2319aaDiscrete sources superposed on diffuse emission have been masked out as described in the text. | 19 21 11 | +43 56 | 6.6 | 580 |
In the cases of many of the well studied and more diffuse sources, they are more extended than we observe them to be in either the WENSS or the NVSS. These sources contain very low surface brightness emission around their edges, and what we see are only the brighter cores. Therefore both our size measurements and our flux measurements are known to be underestimated in some cases and may be in others as well.
4 Notes on Individual Sources
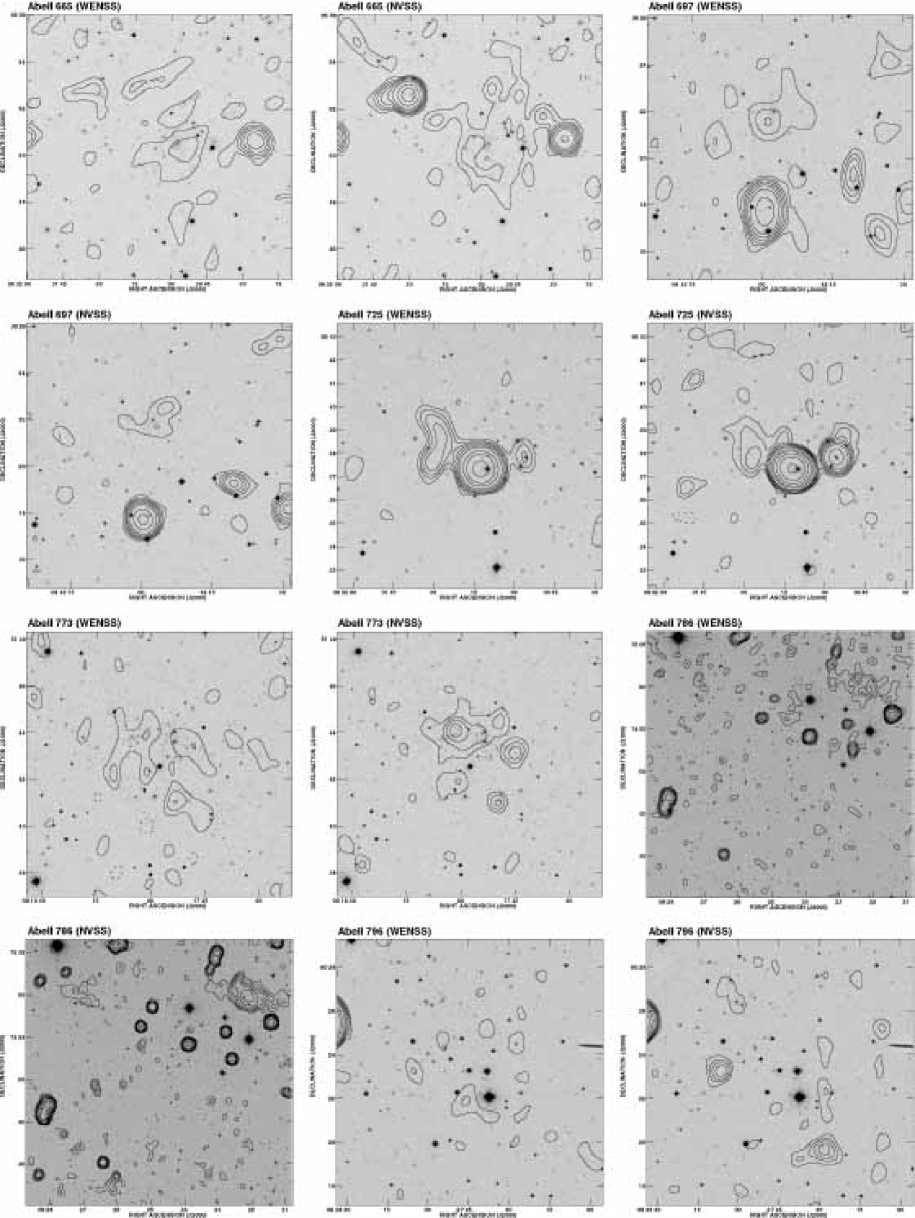
A 665. The halo is detected at better than the level in the WENSS, only slightly less significantly than in the NVSS. The spectral index we find is consistent with the lower limit of found by Moffet & Birkinshaw (1989).
A 697. The diffuse emission is located in the cluster center and extends to the NW. The peak of the emission is roughly coincident with the X-ray centroid of the cluster. The absence of point sources in this region in the FIRST survey and the lack of bright ellipticals in the DSS suggest that the diffuse emission is in fact real, despite its low flux. Because of the large uncertainties in its flux, however, we will consider it to be uncertain until deeper, more detailed observations can be made.
A 725. The brightest radio source in the cluster is associated with the bright elliptical at the cluster center. The relic is seen as an arc of diffuse emission to the NE of this source. The X-ray gas as seen in the RASS is slightly elongated along the axis connecting the relic and the cluster center. It has one of the steepest spectra of any source in our sample.
A 773. The diffuse emission is quite splotchy and irregular in the WENSS image but is detected at the 5 level. Its existence had been previously known from the NVSS (Giovannini et al. 1999).
A 786. This relic (upper right corner in Figure 2) is at an unusually large projected distance ( Mpc) from the center of the cluster. Its association with the cluster is based on the relic being coincident in projection with two galaxies of similar redshift to that of the cluster. The cluster is a member of Rood Group #27 (Rood 1976), although the other Abell clusters in the group lie to the southwest of A 786. Based on the presence of the galaxies at the position of the relic, the supercluster also is likely to extend to the northwest.
The cluster’s X-ray morphology indicates that it is a double cluster, with the position given in Table 1 lying between the two X-ray clusters.
The spectral index we measure is consistent with the value determined by Harris et al. (1993).
A 796. The centrally located diffuse emission in this cluster is quite large and has very low surface brightness. Deeper imaging will be needed to confirm the presence of a halo in this cluster.
A 1240. Two roughly symmetric relics are found in this cluster. They are indicated in Table 2 by their positions relative to the cluster center, north or south. They appear to either side of the cluster center at projected distances of and Mpc. To compare the radio morphology with that of the X-ray emitting intracluster gas, we extracted a pointed ROSAT PSPC observation from the archive. This 11.9 ksec exposure (RP900383) was aimed at another target, and A 1240 is located about 27′ from the center of the field. As a result of the poorer angular resolution and supporting rib structure at this location in the detector, the image is of lower quality than if the field had been centered on A 1240. The X-ray image was corrected for particle background and exposure using the HEASARC ftools software package. The resulting X-ray image in the R4R7 (roughly, 0.5-2.0 keV) band was adaptively smoothed with a minimum signal-to-noise ratio of 3 per smoothing beam.
![[Uncaptioned image]](/html/astro-ph/0010251/assets/x2.png)
Adaptively smoothed ROSAT PSPC image of Abell 1240 (greyscale) with superposed WENSS image contours. The greyscale is a square root scaling and ranges from 0 to counts sec-1 pixel-1; the pixels are 15″15″. The radio image is shown in 2- and 3.5- surface brightness contours.
The smoothed image is shown in Figure 4, superposed with the WENSS contours. The ROSAT observation of the cluster show a double X-ray morphology consistent with a slightly asymmetric merger. Both of the radio relics are located on the edge of the cluster X-ray gas; both have similar luminosities and spectra. The axis of symmetry of the relics is roughly aligned with the apparent axis of the merger. Hydrodynamic simulations of off-center mergers (Ricker & Sarazin 2000) show a similar slight misalignment of the axis connecting the merger shocks with that of the cluster centers. Although projection effects introduce some uncertainty, the location of the relics is consistent with the expected location of merger shocks. This cluster joins Abell 3667 and Abell 2345 in a growing class of clusters with symmetric double radio relics.
A 1452. This possible halo is quite large, but not very powerful. It has relatively low surface brightness and is fairly splotchy. Deeper imaging is needed to confirm the presence of diffuse emission in this cluster.
A 1758a. The brightest source is identified with a Narrow Angle Tail galaxy (O’Dea & Owen 1985) with the tail pointing to the SE. The bulk of the remaining emission is resolved into two sources in the FIRST image, but the faint emission to the south of these and between these and the tailed galaxy may be diffuse emission unrelated to the point sources, or it may be a blend of fainter point sources. The presence of diffuse emission is therefore considered uncertain.
A 1914. A very steep spectrum source has been known to exist in this cluster for quite some time (e.g., Kulkarni et al. 1990). The center of this cluster contains a number of point sources visible in the FIRST images, at least two of which overlap the radio halo. Accurately masking the point sources in the WENSS image was difficult due to their small separation, so the actual error in our measurement may be slightly greater than that quoted in Table 2.
A 2034. The extended emission is located north of the cluster center. It is coincident with a discontinuity in the X-ray surface brightness which may indicate the presence of a merger shock. Forthcoming observations of the cluster with XMM-Newton and Chandra will be able to confirm the existence of a merger shock at this location.
A 2061. The diffuse emission in this cluster is visible as two closely separated sources SW of the cluster center. The two regions are most likely part of a single radio relic. The FIRST survey shows two point sources: one just south of the relic, the other just north. This second source is too faint to be clearly visible in the WENSS, but is obvious in the NVSS.
As the cluster’s RS type indicates, it is quite elongated, with the position angle of the galaxy distribution extending in the direction of the relic. The X-ray gas also has a bimodal distribution (Crawford et al. 1999). The RASS image shows that this extension has the same orientation as that of the optical galaxy distribution.
A 2218. This fairly small halo was first detected by Moffet & Birkinshaw (1989). It is nearly unresolved in WENSS and is quite faint, causing it to be missed by our survey, but we include it here for the sake of completeness. This was the only halo or relic found in the literature which was part of our initial sample but which we failed to detect in the WENSS.
A 2219. This possible halo was first discovered in the NVSS (Giovannini et al. 1999) but was considered uncertain. The WENSS data improve the situation somewhat, as the halo candidate appears at slightly better than the 3 level as an arc of emission to the west and NW of the cluster. The emission to the SW that is visible in the NVSS appears to be a blend of point sources which are resolved by the FIRST survey, but these sources cannot explain the diffuse emission to the NW. Since the halo candidate was still not detected with a high signal-to-noise, we continue to consider this candidate as uncertain.
A 2255. The spectral index we measure is consistent with the integrated derived by Feretti et al. (1997a). The somewhat steeper value we find is probably caused by including the “hole” region in which there is no significant emission at 20 cm. This cluster also contains a relic (e.g., Burns et al. 1995) which is not visible in either the WENSS or NVSS images at a level which is considered significant.
A 2256. This cluster contains perhaps the most spectacular diffuse radio source in our sample. It contains a large radio relic to the west of the cluster. We find a steeper spectral index for the relic than that reported by Röttgering et al. (1994), although the increased sampling of short spacings in the WENSS as compared to their observations at 90 cm with the VLA B-array probably accounts for the discrepancy.
We also observe a central radio halo which was detected by Bridle & Fomalont (1976) at 610 MHz, and which is easily visible in the WENSS. Because of its very low surface brightness (it is rarely brighter than 2 mJy beam-1 in the WENSS image) and its ultra-steep spectrum, this halo has largely been ignored by subsequent studies of A 2256, which have instead focused on the relic and the numerous head-tail galaxies in the cluster. Costain et al. (1972) found the spectral index of A 2256 between 22.25 and 81.5 MHz to be , suggesting the presence of a centrally located ultra-steep spectrum source. Their data also suggest that this source is of comparable size to, or slightly bigger than the observed extent of the halo at 327 MHz. Based on this steep spectral index and the halo’s flux at 610 MHz (Bridle & Fomalont 1976), we would expect a flux more than 2.5 times what we observe at 327 MHz. However, since the halo is quite faint and is perhaps slightly larger than is evident from the WENSS image, our measurement should be taken as a lower limit to the actual flux of the halo. The flux of the halo at 1400 MHz is expected to be below the sensitivity of the NVSS, and indeed it is not seen there at all.
The halo and relic measurements are listed separately in Table 2 and are named accordingly.
A 2319. This halo was studied extensively by Feretti et al. (1997b). It is much more extended than it appears in either the WENSS or NVSS, so much of the total flux in the halo is missing in our measurements from both surveys.
5 The Radio–X-ray Correlation
5.1 Correlations for Clusters with Radio Detections
We now consider the correlation between the radio power of a cluster halo or relic and the cluster’s other properties. We begin by limiting our statistical analyses to the radio measurements done in this study, because of the difficulty of developing a consistent sample of low-frequency radio data on radio halos and relics based on previous observations. Most previous large surveys of these objects have been done at 20 cm. We then discuss correlations at higher frequencies and attempt to apply them to our 327 MHz data.
We find no significant correlation between the radio power of the source and the RS type or the Abell Richness class of the cluster. The distribution of halo/relic candidates in redshift space is uniform, but given the small number of clusters in which we detect diffuse radio emission, this result is probably not meaningful.
![[Uncaptioned image]](/html/astro-ph/0010251/assets/x3.png)
Monochromatic radio power at 327 MHz in the cluster rest frame plotted against X-ray luminosity in the 0.1–2.4 keV rest frame band. The solid line is the best fit to the halo data, using a fixed logarithmic slope of 2.15 derived from the 20 cm data in Feretti (2000).
We do not find a correlation between radio power and X-ray luminosity when halos and relics are considered together (Figure 5.1). When considered separately, we find a correlation coefficient of for halos, consistent with no correlation. This may, however, be a result of missing flux from having few short baselines, as more complete data at 1.4 GHz (Feretti 2000; Liang et al. 2000) do show a correlation. Relics show no sign of a correlation either, although the X-ray data for these clusters is quite poor. It should be noted that the clusters in which we find the first evidence of diffuse radio emission all display relatively faint halos or relics and generally have X-ray luminosities which are comparable to or slightly fainter than those of clusters already known to have halos or relics. With better radio data for these sources, they may extend the correlation found at 1.4 GHz.
5.2 A Simple Merger Model for the Radio–X-ray Correlation
We now consider a very simple analytic model for the radio luminosity as a function of X-ray luminosity, on the assumption that the radio emitting electrons are accelerated in cluster mergers. In general, a cluster of mass may undergo mergers with clusters or groups having any mass . (We take the mass to apply to the larger subcluster in the merger.) However, mergers with much smaller subclusters are unlikely to produce very strong shocks with large energy fluxes. Thus, we consider only major mergers with , and for simplicity we assume that the mergers are symmetric (). Mergers occur with a distribution of impact parameters , which can affect the strength of the shocks produced (e.g., Ricker & Sarazin 2000). To simplify the model, we assume that the mergers occur with (zero impact parameter, or a head-on merger). A distribution of values of and should introduce dispersion into the correlation between X-ray and radio luminosities, but should not affect the correlation itself. Let us characterize each of the subclusters by the mass , characteristic radius , and velocity dispersion .
To begin with, we assume that the radio emitting electrons have short lifetimes and are accelerated by cluster merger shocks. Radio observations of Galactic supernova remnants indicate that shocks at velocities similar to those in cluster mergers convert 3% of the shock energy flux into accelerating relativistic electrons (e.g., Blandford & Eichler 1987). Thus, we will assume that the rate as which energy is deposited by accelerating cosmic ray electrons is
| (1) |
where is the rate at which energy is being deposited in merger shocks, and is the fraction of the shock energy that goes into accelerating cosmic rays, and is assumed to be constant. Assume the two subcluster approach with a velocity . Then, the rate of energy deposition by shocks is approximately
| (2) |
where is the pre-shock density of the thermal gas in the intracluster medium (ICM), and is the cross-sectional area of the merger shocks. The merger velocity of subclusters is determined by their infall velocity from the turnaround radius in the Hubble flow, and is close to the escape velocity. Thus, .
The average density of the thermal gas is
| (3) |
where is the total gas mass in the cluster. We write the gas mass as
| (4) |
where is the cluster gas fraction. The X-ray observations of rich clusters indicate that constant (e.g., Arnaud & Evrard 1999).
We will assume that the magnetic field strength in the cluster radio source is 3 G, so that the main loss process for the radio emitting electrons is inverse Compton (IC) scattering of cosmic microwave background photons. Then the lifetime of an electron with an energy of is (e.g., Sarazin 1999)
| (5) |
The average frequency of synchrotron radiation produced by an electron with a Lorentz factor of is , where is the pitch angle of the electron (e.g., Rybicki & Lightman 1979). This gives
| (6) |
so that the electrons which produce the radio emission we observe have and short lifetimes yr. Since these times are shorter than the durations of cluster mergers, one expects to find radio emission only during the merger. This result has been found previously based on more detailed models (e.g., Sarazin 1999; Takizawa & Naito 2000).
The total energy in cosmic ray electrons is then
| (7) |
It is also useful to replace the radius , which is poorly defined observationally, with the gas temperature . The gas in clusters is in hydrostatic equilibrium, which implies that
| (8) |
The total energy of cosmic ray electrons then varies as
| (9) |
Alternatively, we can use the cluster X-ray luminosity to parameterize the size of the cluster. The X-ray luminosity–temperature relationship is approximately (e.g., Arnaud & Evrard 1999). Thus, the energy in relativistic electrons varies as
| (10) |
The diffuse radio emission from a cluster depends both on the population of relativistic electrons and on the magnetic field. We consider two simple models for the variation in the field strength from cluster to cluster. First, we assume that the magnetic field is constant from cluster to cluster. In this case, electrons with the same energy or Lorentz factor produce radio emission at the same frequencies in all clusters, and the total magnetic energy density is the same in all clusters. Then, the radio luminosity , so that the radio power at an emitted frequency varies as
| (11) |
These relations are too flat to fit the observed relations (Fig. 5.1; Feretti 2000; Liang et al. 2000).
As an alternative model, we assume that the magnetic field varies from cluster to cluster in such a way that the magnetic pressure is a fixed proportion of the gas pressure in the intracluster medium. This might occur as a result of turbulence generated in merger shocks. Then, the magnetic field strength varies as
| (12) |
Assuming that clusters form from large scale structure and that the gas is hydrostatic implies that the cluster mass and gas temperature are related by (Bryan & Norman 1998), and this is consistent with the observations of clusters (Horner, Mushotzky, & Scharf 1999). This implies that
| (13) |
Varying the magnetic field also varies the energy of the electrons which contribute to the radio emission at a given observing frequency according to equation (6), and this affects the number of electrons effective at synchrotron emission at this frequency. We assume that the electron population is a power-law in , with being the total number of electrons with energies in the range to . We determine the power-law index from the observed radio spectral index , which gives . Although the spectral indices vary from cluster to cluster, we assume that there is no consistent variation with cluster X-ray luminosity or temperature . We assume the electron populations is in steady-state, which implies that the total number of particles or the normalization of the electron spectrum varies as
| (14) |
From synchrotron theory, the radio power at a frequency varies as
| (15) |
where is the cyclotron frequency. This leads to
| (16) |
These relations between radio power and or are somewhat steeper than those produced by a constant magnetic field (eq. 11), but are only a small improvement in terms of fitting the data. We first tried varying , and found a best fit for , which is unreasonably steep. We then fit the – data in Feretti (2000) using this relation for several values of that are consistent with our data. An example of these fits is shown in Figure 5.2. Since the slope is not very sensitive to , we show a fit for only one typical value—other values give a similar fit. This fit differs from the best fit by about 2.5.
![[Uncaptioned image]](/html/astro-ph/0010251/assets/x4.png)
Monochromatic power at 1.4 GHz of well-studied radio halos from Feretti (2000) as a function of X-ray luminosity. The solid line is a least squares fit to the data assuming a power-law relation. The dotted line is a fit using our simple shock model for .
For the purposes of considering the radio detectability of halos, it is worth considering how the radio surface brightness and radio halo size might vary with X-ray luminosity or temperature. The physical radius of a cluster is expected to vary with temperature as (e.g., Mohr, Mathiesen, & Evrard 1999). If the temperature vs. X-ray luminosity relation is as assumed above, the cluster size varies as . If we assume that the size of the radio halo is proportional to the cluster size , then for a fixed magnetic field, and when the magnetic pressure increases in proportion to the gas pressure. These relations are even flatter than those for the radio power.
5.3 Limits from Clusters with Radio Non-Detections
The discussion so far has concentrated on the radio–X-ray correlations for clusters with detected radio halos. However, radio halos are relatively rare, and most clusters do not show diffuse radio emission at a detectable level. In a model where the radio-emitting electrons are accelerated during cluster mergers this is easily understood, since these electrons have short lifetimes and will only be present during the period of stronger merger hydrodynamical interaction. Since clusters showing X-ray evidence for strong merger shocks are also relatively rare and all radio halo clusters appear to be undergoing mergers, this can explain, at least qualitatively, the low rate of occurrence of radio halos and relics.
We also find that luminous halos and relics are generally not found in clusters with low X-ray luminosities. The NVSS radio survey at 20 cm found a similar result (Giovannini et al. 1999). This relationship between X-ray luminosity and the detection of a halo or relic appears in several other forms, as well. The Abell clusters north of that fall into the Ebeling et al. (1996) X-ray–bright cluster sample comprise less than 20% of our initial sample, but make up 65% of the clusters in which we find diffuse emission. If X-ray luminosity and the radio halo luminosity were uncorrelated and the halo detection rate from the Ebeling et al. (1996) sample held for fainter clusters, we would expect to find a radio halo or relic in about 200 of the clusters we studied.
Surely, some of the low X-ray luminosity clusters in the Abell catalog are also undergoing mergers, and may have particle acceleration. Why are these lower luminosity clusters not detected in radio? The observations of clusters indicate that there is a steep correlation of radio power with X-ray luminosity or temperature; our simple merger shock model also implies a steep correlation, although probably not as steep as the data. Here, we consider the possibility that the failure to detect radio halos in low X-ray luminosity clusters results from this correlation and the radio sensitivity of our survey. We assume that the correlation between radio halo and X-ray luminosity seen for bright clusters (Feretti 2000) continues to lower X-ray luminosities.
The surface brightness sensitivity limit of our search technique is taken to be that of the WENSS, shown in Figure 2. We determine the predicted surface brightnesses of clusters as a function of X-ray luminosity and redshift. For a cluster with a given X-ray luminosity, we used the radio power vs. X-ray luminosity relation (Figure 5.1) to determine its radio power at 327 MHz.
To determine the predicted mean radio surface brightness of the halo, we also need to know its physical size. It seems likely that that bigger clusters, which have larger X-ray luminosities, will also have larger radio halos. For example, it may be that radio halo sizes are proportional to the overall sizes of clusters. As discussed in § 5.2, this leads to the radio halo size varying with X-ray luminosity roughly as . In our sample of radio halos, there is no clear evidence for a variation of the size of the halo with the X-ray luminosity of the cluster. However, it may be that our sample is too small, or that the sizes deduced from the WENSS images are too uncertain. Figure 5.3 plots the sizes of the radio halos from the sample in Feretti (2000) as a function of the cluster X-ray luminosity. This sample does show some evidence for a size-luminosity relationship. The dashed curve is the best-fit relation which follows the cluster radius vs. X-ray luminosity relation, . The solid curve is the best-fit power-law relation with an arbitrary exponent. This best-fit corresponds roughly to .
![[Uncaptioned image]](/html/astro-ph/0010251/assets/x5.png)
Largest linear radio size vs. X-ray luminosity for the halos in Feretti (2000). The solid line is the best least squares fit to the data for a power-law relationship. The dotted line is the best fit with an exponent of , which would apply if the radio halo size was proportional to the cluster size.
The sizes shown in Figure 5.3 are largest linear size () values. Typically, the regions covered by the radio halos are not circular. For the halo sources in our survey, the average area of the source (the area used to determine its mean surface brightness in Figure 2) is given by . We use the same factor to determine the predicted area of a source of a given X-ray luminosity; its mean surface brightness at 327 MHz in the cluster rest frame is then determined by dividing the predicted radio power by the predicted area of the halo. For the observed radio power and radio size vs. X-ray luminosity relations, the predicted mean radio surface brightness is a monotonically increasing function of the X-ray luminosity.
For a cluster at a redshift of , the observed surface brightness at an observing frequency of 327 MHz is reduced by a factor of . We assume a typical spectral index of to determine the observed surface brightness. This observed mean surface brightness was compared to the surface brightness limit of our survey (Figure 2), and the X-ray luminosity of the faintest detectable cluster was determined. This limiting is plotted versus redshift as the solid curve in Figure 5.3. This limit is incorrect for very small redshifts where the halos may be too large in angular size, and at very large redshift where the halos might be unresolved. The sense of these differences is to make the clusters harder to detect.
It is clear that the detections are roughly consistent with the survey sensitivity and the radio–X-ray correlations. Abell 2255 is the only cluster to lie at or below the limit, but as Figure 5.1 shows, this cluster deviates substantially from the best-fit – relation with a low X-ray luminosity given its radio power. It is clear that radio halos in fainter X-ray clusters ( ergs s-1) would be too weak to be observed, if they follow the radio–X-ray correlations observed for brighter clusters. Of course, there may be other selection effects affecting the detection rates of clusters. For example, some of the radio halo detections have resulted from deep radio observations of Sunyaev-Zel’dovich clusters to remove radio sources (e.g., Moffet & Birkinshaw 1989; Liang et al. 2000). Since the S-Z clusters tend to be selected as the hottest, highest X-ray luminosity clusters, this might explain part of the correlation of radio halo detections with cluster X-ray temperature or luminosity.
![[Uncaptioned image]](/html/astro-ph/0010251/assets/x6.png)
X-ray luminosity of halo clusters in the 0.1–2.4 keV rest frame as a function of redshift. The solid curve gives the lower limit on cluster X-ray luminosity for a detection of a halo with in the WENSS survey, assuming the halo radio power and size vary with X-ray luminosity as shown in Figures 5.1 and 5.3.
6 Conclusions
We have discovered 7 new candidate radio halos and relics in a search of Abell clusters in the WENSS. We also confirm the presence of diffuse emission in 7 clusters and find further evidence of such emission in 2 more clusters where the presence of a halo has been posited but remains uncertain. Our search technique detected all but one previously known source that fell within our sample. More detailed radio observations of the new radio halos and relics would be very useful to accurately determine their structure.
We argue that radio halos or relics are only found in clusters which are currently undergoing a cluster merger. All the clusters in our sample show evidence for a merger from either their X-ray surface brightness distribution or their galaxy distribution. This can explain the relative rarity of diffuse radio emission in clusters.
We also find weak evidence for the observed correlation between monochromatic power of radio halos and cluster X-ray luminosity. We present a very simple model for the correlation of radio power with X-ray luminosity or temperature in clusters which are currently merging, on the assumption that the radio-emitting electrons are accelerated by merger shocks. We consider two cases for this model: one in which the magnetic field is the same for all clusters and one in which the field varies as a fixed proportion of the gas pressure. The latter model is marginally more successful at fitting the data. This argument predicts a strong radio–X-ray luminosity correlation, although not as steep as the one observed at 20 cm.
Our survey is the first to look for halos in a large sample of clusters with low X-ray luminosity. In general, radio halos and relics are not found in low X-ray luminosity clusters. We argue that this is the result of the steep radio power vs. X-ray luminosity correlation. If this is true, many more low luminosity clusters could be detected as diffuse radio sources if the sensitivities of the surveys could be greatly increased. Clearly, deeper imaging with high sensitivity at short () spacings is necessary to test whether the correlation holds at lower X-ray luminosities.
References
- (1)
- (2) Abell, G. O. 1958, ApJS, 3, 211
- (3)
- (4) Abell, G. O., Corwin, H. G., & Olowin, R. P. 1989, ApJS, 70, 1
- (5)
- (6) Arnaud, M., & Evrard, A. E. 1999, MNRAS, 305, 631
- (7)
- (8) Bautz, L. P., & Morgan, W. W. 1970, ApJ, 162, 149
- (9)
- (10) Becker, R. H., White, R. L., & Helfand, D. J. 1995, ApJ, 450, 559
- (11)
- (12) Blandford, R. D., & Eichler, D. 1987, Phys. Rep., 154, 1
- (13)
- (14) Blasi, P., & Colafrancesco, S. 1999, Astroparticle Phys., 12, 169
- (15)
- (16) Böhringer, H., et al., 2000, ApJS, submitted (astro-ph/0003219)
- (17)
- (18) Bridle, A. H., & Fomalont, E. B. 1976, A&A, 52, 107
- (19)
- (20) Bryan, G. L., & Norman, M. L. 1998, ApJ, 495, 80
- (21)
- (22) Burns, J. O., Roettiger, K., Pinkney, J., Perley, R. A., Owen, F. N., Voges, W. 1995, ApJ, 446, 583
- (23)
- (24) Condon, J. J., Cotton, W. D., Greisen, E. W., Yin, Q. F., Perley, R. A., Taylor, G. B., & Broderick, J. J. 1998, AJ, 115, 1693
- (25)
- (26) Costain, C. H., Bridle, A. H., & Feldman, P. A. 1972, ApJ, 175, 15
- (27)
- (28) Crawford, C. S., Allen, S. W., Ebeling, H., Edge, A. C., & Fabian, A. C. 1999, MNRAS, 306, 857
- (29)
- (30) Crawford, C. S., Edge, A. C., Fabian, A. C., Allen, S. W., Böhringer, H., Ebeling, H., McMahon, R. G., & Voges, W. 1995, MNRAS, 274, 75
- (31)
- (32) David, L. P., Forman, W., & Jones, C. 1999, ApJ, 519, 533
- (33)
- (34) Dennison, B. 1980, ApJ, 239, 93
- (35)
- (36) Ebeling, H., Edge, A. C., Böhringer, H., Allen, S. W., Crawford, C. S., Fabian, A. C., Voges, W., & Huchra, J. P. 1998, MNRAS, 301, 881
- (37)
- (38) Ebeling, H., Voges, W., Böhringer, H., Edge, A. C., Huchra, J. P., & Briel, U. G. 1996, MNRAS, 281, 799
- (39)
- (40) Enßlin, T. A., Biermann, P. L., Klein, U., & Kohle, S. 1998, A&A, 332, 395
- (41)
- (42) Feretti, L. 1999, in Proc. Diffuse Thermal and Relativistic Plasma in Galaxy Clusters, ed. H. Böringer, L. Feretti, & P. Schuecker (MPE Rep. 271) (Garching: Max Planck Institut für Extraterrestrische Physik), 1
- (43)
- (44) Feretti, L. 2000, preprint (astro-ph/0006379)
- (45)
- (46) Feretti, L., Böhringer, H., Giovannini, G., & Neumann, D. 1997a, A&A, 317 432
- (47)
- (48) Feretti, L., Giovannini, G., & Böhringer, H. 1997b, New Astronomy, 2, 501
- (49)
- (50) Giovannini, G., Tordi, M., & Feretti, L. 1999, New Astronomy, 4, 141
- (51)
- (52) Harris, D. E., Stern, C. P., Willis, A. G., & Dewdney, P. E. 1993, AJ, 105, 769
- (53)
- (54) Horner, D. J., Mushotzky, R. F., & Scharf, C. A. 1999, ApJ, 520, 78
- (55)
- (56) Jaffe, W. J. 1977, ApJ, 212, 1
- (57)
- (58) Kulkarni, V. K., Mantovani, F., & Pauliny-Toth, I. I. K. 1990, A&A, 82, 41
- (59)
- (60) Liang, H., Hunstead, R. W., Birkinshaw, M., & Andreani, P. 2000, ApJ, in press
- (61)
- (62) Moffet, A. T., & Birkinshaw, M. 1989, AJ, 98, 1148
- (63)
- (64) Mohr, J. J., Mathiesen, B., & Evrard, A. E. 1999, ApJ, 517, 627
- (65)
- (66) O’Dea, C. P., & Owen, F. N. 1985, ApJ, 90, 927
- (67)
- (68) Owen, F. N., Ledlow, M. J., & Keel, W. C. 1995, AJ, 109, 14
- (69)
- (70) Rengelink, R. B., Tang, Y., de Bruyn, A. G., Miley, G. K., Bremer, M. N., Röttgering, H. J. A., & Bremer, M. A. R. 1997, A&AS, 124, 259
- (71)
- (72) Ricker, P. M., & Sarazin, C. L. 2000, in preparation
- (73)
- (74) Roland, J. 1981, A&A, 93, 407
- (75)
- (76) Rood, H. J. 1976, ApJ, 207, 16
- (77)
- (78) Rood, H. J., & Sastry, G. N. 1971, PASP, 83, 313
- (79)
- (80) Röttgering, H., Snellen, I., Miley, G., de Jong, J. P., Hanisch, R. J., & Perley, R. 1994, ApJ, 436, 654
- (81)
- (82) Rybicki, G. B., & Lightman, A. P. 1979, Radiative Processes in Astrophysics, (New York: Wiley), 167–194
- (83)
- (84) Sarazin, C. L. 1999, ApJ, 520, 529
- (85)
- (86) Schlickeiser, R., Sievers, A., & Thiemann, H. 1987, A&A, 182, 21
- (87)
- (88) Schuecker, P., & Böhringer, H. 1999, in Proc. Diffuse Thermal and Relativistic Plasma in Galaxy Clusters, ed. H. Böringer, L. Feretti, & P. Schuecker (MPE Rep. 271) (Garching: Max Planck Institut für Extraterrestrische Physik), 43
- (89)
- (90) Slee, O. B., & Reynolds, J. E. 1984, Publ. Astr. Soc. Austr., 5, 516
- (91)
- (92) Struble, M. F., & Rood, H. J. 1987, ApJS, 63, 543
- (93)
- (94) Takizawa, M., & Naito, T. 2000, ApJ, 535, 586
- (95)
- (96) Trümper, J. 1993, Science, 260, 1769
- (97)
- (98) Voges, W. 1992, Proc. of Satellite Symposium 3, ESA ISY-3, 9
- (99)
![[Uncaptioned image]](/html/astro-ph/0010251/assets/x8.png)
Fig. 2 cont’d
![[Uncaptioned image]](/html/astro-ph/0010251/assets/x9.png)
Fig. 2 cont’d