SuperMassive Black Holes in Bulges111Based on observations with the Hubble Space Telescope obtained at STScI, which is operated by AURA, Inc., under NASA contract NAS5-26555.
Abstract
We present spatially extended gas kinematics at parsec-scale resolution for the nuclear regions of four nearby disk galaxies, and model them as rotation of a gas disk in the joint potential of the stellar bulge and a putative central black hole. The targets were selected from a larger set of long-slit spectra obtained with the Hubble Space Telescope as part of the Survey of Nearby Nuclei with STIS (SUNNS). They represents the 4 galaxies (of 24 ) that display symmetric gas velocity curves consistent with a rotating disk. We derive the stellar mass distribution from the STIS acquisition images adopting the stellar mass-to-light ratio normalized so as to match ground-based velocity dispersion measurements over a large aperture. Subsequently, we constrain the mass of a putative black hole by matching the gas rotation curve, following two distinct approaches. In the most general case we explore all the possible disk orientations, alternatively we constrain the gas disk orientation from the dust-lane morphology at similar radii. In the latter case the kinematic data indicate the presence of a central black hole for three of the four objects, with masses of M⊙, representing up to % of the host bulge mass. For one object (NGC 2787) the kinematic data alone provide clear evidence for the presence of a central black hole even without external constraints on the disk orientation. These results illustrate directly the need to determine black-hole masses by differing methods for a large number of objects, demonstrate that the variance in black hole/bulge mass is much larger than previously claimed, and reinforce the recent finding that the black-hole mass is tightly correlated with the bulge stellar velocity dispersion .
1 Introduction
Over the last few years evidence has mounted that supermassive black holes (SMBH) are nearly ubiquitous in galactic centers. This finding has resulted from high-resolution observations of various kinematical tracers of the central gravitational potential, such as stars, ionized gas, or water masers (see, e.g., Ho 1999 for a review). Additional support for this picture is provided by spectroscopic surveys demonstrating that weak active galactic nuclei (AGN) activity is common in nearby galaxies, especially among early-type systems (E-Sb; Ho, Filippenko, & Sargent 1997a and references therein). An important fraction of these nuclei further exhibit broad-line emission and/or compact X-ray or radio sources that are the hallmarks of quasar activity, presumably powered by accretion onto a black hole (e.g., Ho, et al. 1997b; Terashima, Ho, & Ptak 2000; Nagar et al. 2000).
If SMBHs are indeed an integral part of galaxies and their formation, a natural question is whether the black-hole mass is related to larger properties of the host galaxy. A correlation between and stellar mass of the spheroidal component was suggested by Kormendy (1993), and later quantified by Kormendy & Richstone (1995), Magorrian et al. (1998), and Ho (1999). As investigated recently by Kauffmann & Haehnelt (2000), such a correlation might arise naturally in hierarchical scenarios for galaxy formation, and is expected if local SMBHs are the dormant relics of past quasar activity. Evidence of a close connection between galaxy structure and SMBHs has been bolstered by recent reports of a correlation between and the velocity dispersion of the surrounding stellar bulge (Ferrarese & Merritt 2000, hereafter FM00; Gebhardt et al. 2000a, hereafter G00).
The largest compilation of SMBH mass estimates obtained with a single technique, namely axisymmetric two-integral models for the central stellar kinematics, is that of Magorrian et al. (1998). For most of the 32 early-type galaxies of their sample, they found that Hubble Space Telescope (HST) photometric and ground-based kinematical data were consistent with the presence of a central supermassive black hole. Based on their data they claim that Mbulge with a scatter of only a factor of . While the restrictive orbital assumptions in their modeling can lead to an overestimate of the black-hole mass (Magorrian et al. 1998), their high detection rate nonetheless underscores the apparent prevalence of SMBHs and their close connection to the surrounding stellar bulge.
Despite this recent progress, the demography of SMBHs is far from complete. Most of the reported SMBHs have been detected in bulge-dominated systems, and it is not clear if the relation holds also in the case of disk-dominated galaxies. This issue is important in light of theories for bulge formation via secular evolution of disk structures (e.g., Norman, Sellwood, & Hasan 1996). In addition, it is still not fully understood whether the apparent lack of low-mass central black holes in very massive galaxies is due to selection effects, in which case the correlated distribution of points in the plane actually represents only an upper envelope. In Seyfert nuclei and quasars, measurements of derived from reverberation mapping experiments provide intriguing evidence that the average ratio in active galaxies is systematically lower than in normal ones (Ho 1999; Wandel 1999; Kaspi et al. 2000, Gebhardt et al. 2000b), even though this discrepancy may disappear in the ratio (Gebhardt et al. 2000b). Independent determinations of in active galaxies are desirable for confirmation of these results. Black-hole mass estimates and the corresponding Eddington luminosity are also of fundamental importance for testing theories of accretion physics in AGNs, since models typically predict a strong dependence of accretion disk structure on , or alternatively (e.g., Narayan, Mahadevan, & Quataert 1998).
In order to address these and other issues we initiated a Survey of Nearby Nuclei with STIS (SUNNS) on HST, with kinematic information obtained from measurements of nebular emission lines. Because of its collisional nature, gas promises a conceptually easier way to trace the gravitational potential of a galaxy nucleus than stars, because nearly circular orbits can be assumed; at the same time, however, gas is more susceptible to non-gravitational forces and may not be in equilibrium. Use of emission-line tracers to constrain a central mass concentration is thus limited to cases where strong evidence exists that the gas dynamics are dominated by gravity.
The paper is organized as follows. In §1 we present the spectroscopic and photometric STIS observations, and in §2 we describe our modeling of the ionized gas kinematics. We present our results in §3 and draw our conclusions in §4.
2 Observations and data reduction
In carrying out SUNNS, long-slit spectra were obtained with STIS for the central regions of 24 nearby, weakly active galaxy nuclei. Full details of the observations and data calibration are reported by Rix et al. (2001 in prep). The observations were acquired in 1998 and 1999, with the slit placed across each nucleus along an operationally determined position angle (P.A.), which is effectively random with respect to the projected major axis of any galaxy subsystem. After initial 20-s acquisition exposures with the Long Pass filter (roughly equivalent to ), from which we derive surface photometry of the nuclei, two spectral exposures totaling minutes and three exposures totaling minutes were obtained with the G430L and G750M gratings, respectively. The resulting spectra span 3300 – 5700 Å and 6300 – 6850 Å with spectral resolution for extended sources of 10.9 Å and 2.2 Å, respectively. The telescope was offset by 005 ( 1 pixel) along the slit direction between repeated exposures to aid in the removal of hot pixels.
The two-dimensional (2-D) spectra were bias- and dark-subtracted, flat-fielded, aligned, and combined to single blue and red spectra, cleaned of remaining cosmic rays and hot pixels, and corrected for geometrical distortion. The data were wavelength- and flux-calibrated with standard STSDAS procedures. The exact reduction steps differed slightly from image to image, in particular the image combining, dithering, and hot pixel removal. A detailed discussion of the reduction steps and the 2-D spectra will appear in Rix et al. (2001 in prep). For the kinematic analysis reported here, we used only the red, high-resolution spectra. We determined the radial velocity of the ionized gas as a function of position along the slit from Doppler shifts of the H and [N II] 6548, 6583 emission lines. Measurement of these features was carried out using the program SPECFIT as implemented in IRAF (Kriss 1994), assuming a common velocity frame and Gaussian profile for the three lines, and a [N II] doublet ratio (1:3) dictated by atomic parameters. SPECFIT employs -minimization methods that provide error estimates for the measured velocities.
Of the target galaxies, 12 displayed spatially resolved nebular emission at a level that was detectable in our data. For these sources, many of the measured gas velocity profiles showed distinct asymmetries and other features that appear inconsistent with steady-state orbital motion. We consequently selected for further study only those objects for which the gas velocity curves were extended, single valued, and nearly reflection-symmetric about the center of the galaxy; six objects met these criteria. We subsequently eliminated two of the remaining objects (NGC 3351 and NGC 4548) from the present study since surface photometry indicates that their central regions exhibit large deviations from sphericity or strong isophotes twisting. We defer discussion of these sources to a later analysis. The remaining four objects that we present here are NGC 2787, NGC 4203, NGC 4459, and NGC 4596. Global parameters for these galaxies are given in Table 1, while their surface brightness, ellipticity, and position angle profiles are shown in Fig.1. These radial profiles were obtained with the task ELLIPSE in IRAF, after masking the most prominent dust features (e.g. NGC 2787). We adopted ellipses with linearly spaced semi-major axes, with a minimum radius of 0.5 pixel.
3 The modeling of the ionized gas kinematics
We used the data to derive constraints on the presence and mass of a SMBH by modeling the gas kinematics in the combined gravitational potential of the stars and of a central dark mass. The projected light distribution in the centers of these galaxies is relatively round (axis ratio ), and we consequently assumed spherical symmetry for the stellar mass distribution. This approximation is sufficient to roughly estimate the stellar mass-to-light ratio within . We further assumed that the circumnuclear ionized gas is moving on planar, closed and hence nearly circular orbits in the total gravitational potential. The spatial gas distribution was taken to be a disk, whose orientation is specified by its inclination with respect to the sky plane, and by the angle between the directions of its projected kinematic major axis and the slit position.
To derive the stellar portion of the gravitational potential, we proceeded in several steps:
3.1 Stellar Mass Profile
We derived the deprojected stellar luminosity density from the observed surface brightness profile in the STIS acquisition image. The intrinsic surface brightness profile was modeled as a sum of Gaussian components (Monnet, Bacon, & Emsellen 1992), which were convolved with the HST point-spread function (PSF). The PSF itself was also represented as a sum of Gaussians, and was derived from stars present in the STIS acquisition images. This yielded a PSF very similar to the synthetic ones obtained using the Tiny Tim package (Krist & Hook 1999) and with stellar spectral energy distributions. The convolved model was then compared with in order to determine the optimal scaling coefficients for the Gaussian components. In practice, we constrained the Gaussian width coefficients, , to be a set of logarithmically spaced values, thus simplifying the multi-Gaussian decomposition into a general non-negative linear least-square problem for the corresponding Gaussian amplitudes, . The resulting deconvolved is then readily deprojected to obtain . For a radially constant mass-to-light ratio , a multi-Gaussian description also results for the stellar mass density , whose contribution to the total potential can be computed conveniently in terms of error functions.
In applying this method to NGC 2787, NGC 4203, and NGC 4596, we found a point-like, presumably non-thermal light component in addition to the extended stellar light. We note that the absence of such a component in NGC 4459 is consistent with its comparatively weak indications of AGN activity, reflected in its spectroscopic classification as an H II/LINER transition object. Central point sources manifest themselves by abrupt changes in the surface brightness profile slope in the innermost 1-2 pixels, and are well fit by PSF-convolved point sources. We consequently removed this component from the measured in order to measure only stellar light. As an example, in Figure 2 we show the multi-Gaussian fit to for NGC 4203, along with the recovered luminosity density profile and the shape of the corresponding circular velocity curve .
3.2 Stellar Mass-to-Light Ratio
Values of can be constrained dynamically using measurements of the stellar velocity dispersion averaged over a size scale sufficiently large that a plausible SMBH will not dominate the potential. We used ground-based measurements through apertures of several square arcseconds for this purpose (Table 1). We assumed a constant for each galaxy and solved the Jeans equation in the spherical isotropic case (Binney & Tremaine (1987)) for the velocity dispersion profile . We then integrated along the line of sight to obtain the projected , and computed a seeing-convolved, surface-brightness-weighted mean within the given aperture. Finally, we adjusted until matched the observed .
As a refining step, we included the effect of a central black hole in the on producing a curve, which is monotonically decreasing with increasing black-hole masses, from the maximum value without any central mass concentration down to the limiting zero value corresponding to some maximum allowed black-hole mass (typically M⊙).
All the model steps, including the multi-Gaussian fit of , recovery of , calculation of , and reconstruction of and , were tested and verified using Hernquist (1990) analytical models for all these functions.
3.3 Gas Velocity Field
The prediction of the observed gas velocity field for our galaxies depends on the orientation of the gas disk in each case. We cannot expect that the parsec-scale central gas disk is coplanar with the vastly larger stellar galaxy disk; indeed, there are examples were this is clearly not the case (e.g., NGC 3227; Schinnerer et al. 2000). We therefore modeled the gas kinematics with the disk inclination angles and for the gas initially unconstrained.
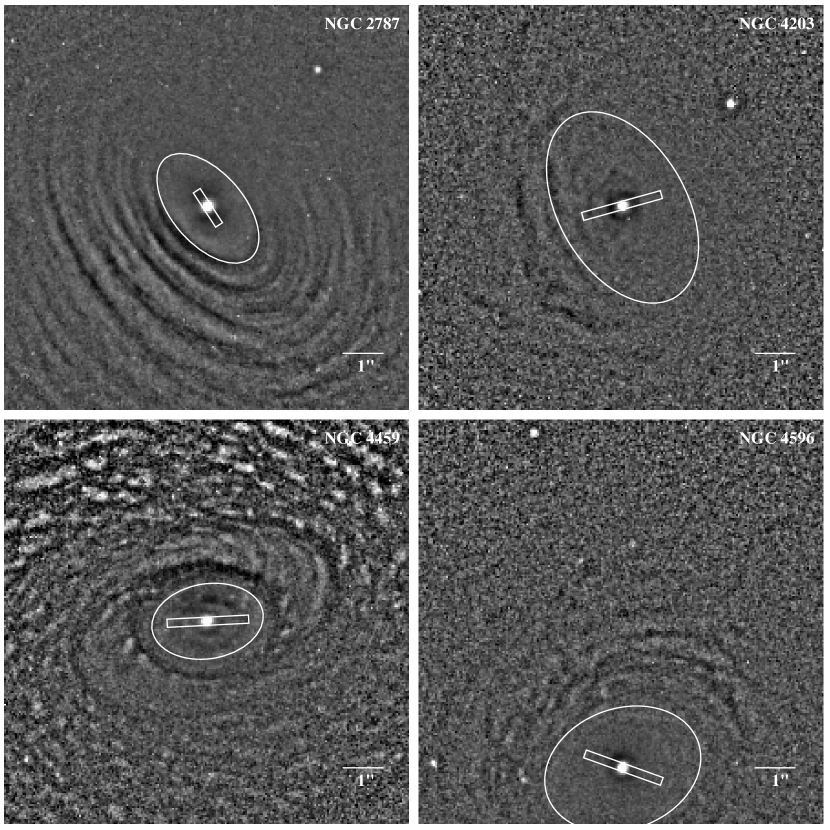
Inspection of acquisition and archival WFPC2 images for our sources reveals clear signatures of compact dust lanes. As this dust and the ionized gas are most likely part of the same central disk (e.g., Pogge et al. 2000, Verdoes Kleijn et al. 1999), the dust-lane morphology provides a potential means of deriving the disk orientation. We obtained corresponding estimates of and for the gas disk by defining ellipses consistent with the dust-lane morphology, and assuming that deviations from circularity result from inclination and projection. An objective ellipse-fitting algorithm for the dust features is difficult to construct, since the strength of the dust lanes varies spatially and is not continuous. We therefore constructed ellipses by eye that are consistent with the dust-lane morphology, with the outcome shown in Figure 3. These results were checked with absorption maps generated by subtraction of a smooth starlight profile from the original images. Estimates of ellipse parameters obtained independently by different members of our team (MS and HWR) showed good agreement ( and ), providing some confidence in these fits. Note, that all the dust rings seem quite highly inclined. In this inclination regime is not very sensitive to errors in . We used the results to generate a second, constrained set of models with the disk orientation specified by the dust morphology.
For a given and and a given total potential , the projected line-of-sight gas velocity field is completely specified by our model. To make observable predictions, this velocity field must be further weighted by the spatial distribution of line flux, and convolved by the HST PSF. Directly observed gas disks on parsec scales (e.g., M87, Harms et al. 1994) show that the gas may be patchy. Given our limited data, our best guess for the two-dimensional gas emissivity distribution is still the axisymmetric extension of the deconvolved line flux profile along the slit. The latter was obtained also through a multi-Gaussian deprojection. The observable velocity field resulted then from convolving with the PSF, and sampling the result along the slit. This procedure provides model points for direct comparison with our STIS measurements.
4 Modeling Results
4.1 Model–Data Comparison
In the unconstrained case, we considered all possible orientations, or the full parameter space. For any given black-hole mass and its corresponding , we identified the set of that best matches the observed kinematics. The quality of this match was quantified by values, each optimized over .
For fits with fixed disk orientation, we simply adopted the values from the dust lane morphology and explored for a fixed . By constructing and curves we can check more stringently the necessity for a central mass concentration, eventually deriving the best values for each case.
We considered a number of errors and modeling uncertainties and assessed their importance for the estimates through simulations. This analysis considered uncertainties in (1) the derived , particularly at small , (2) the multi-Gaussian fit to the surface brightness of the ionized gas, (3) the location of the kinematical center of the observed rotation curves, and (4) , including the effects of possible deviations from our assumption of sphericity and isotropy for the stellar distribution, and the variance among published values for the central velocity dispersions. Neglecting the intrinsic flattening can lead us underestimate the mass-to-light ratio ; from the tensor virial theorem the fractional error on can be evaluated to be less then half of the intrinsic axis ratio (Kronawitter et al. 2000). Assuming for our four galaxies a typical apparent flattening in their central regions of (Fig. 1) and an inclination of 40∘ (Tab. 1), their intrinsic axis ratios would be around , and the mass-to-light ratio would need to be increased by (Kronawitter et al. 2000). Note that the published values for the central velocity dispersion of our sample galaxies have a variance of .
This last factor proved to have the largest impact on . Therefore, we obtained two additional fitting sequences , adopting stellar mass-to-light ratios equal to 0.7 and 1.3 times the derived , both in the unconstrained and constrained disk orientation cases. In essence, we are hereby allowing that our simple modeling has introduced 30% systematic errors in the determination.
The rotation curves in our culled sample show small wiggles and asymmetries in excess of their statistical errors, presumably due to non-gravitational phenomena acting on the gas. In practice, this means that we cannot expect to generate a model that is formally acceptable in a sense, and the estimation of confidence limits is correspondingly affected. To allow for the additional velocity structure that is not addressed by our model, we rescaled all values to achieve = for the best unconstrained fit, where , , and are the numbers of degrees of freedom, data points, and fit parameters, respectively. Note that this procedure is conservative in the sense of widening the confidence intervals. Confidence limits on the range of were then derived from a test (e.g. Press, et al. 1986), for the variation of one parameter.
4.2 Fits with Unconstrained Disk Orientation
The results of the unconstrained fits are shown in the top and middle panels of Figures 4, and are summarized in Table 2. The resulting uncertainties in are large, and only one of the objects (NGC 2787) exhibits evidence of a nonzero mass at more than the level. In all sample galaxies the gas rotation curve extends beyond the radii where the black hole is likely to dominate; there the observed gas motion should approach the one predicted from the stellar mass, which was obtained from the stellar modeling. This requirement provides a constraint on the gas inclination, and precludes arbitrarily large with disks seen at large . In this way, we can obtain robust upper limits on , which prove interesting in some cases such as NGC 4203 (M⊙ at ), which is discussed in detail by Shields et al. (2000). We note that the limiting value presented here for this object is 20% smaller than the value reported by Shields et al. (2000); this difference is due to the use of in the present analysis, rather than a mass-to-light ratio that neglects the presence of the black hole.
4.3 Fits with Fixed Disk Orientation
The results of the fits with constrained disk inclination are shown in the top and lower panels of Figures 4, and are reported in Table 2. We note that in all cases except NGC 4203, the constrained fit is statistically comparable (in a sense) to the unconstrained fit and shows evidence for a central mass concentration at a level. The quality of the fit is thus not improved by relaxing the disk orientation while maintaining at the value dictated by the minimum . This finding is indicated in Figures 2 by the fact that the thick curves representing coincide with the thin curves where attains a minimum. This result means that the unconstrained procedure leads to () values very similar to the one derived from the dust patterns, providing strong supporting evidence that this is indeed the correct choice of orientation.
Not surprisingly, Figure 4 shows that use of the fixed disk orientation constrains much more tightly, with M⊙ for each of NGC 2787, NGC 4459, and NGC 4596, the individual values and their uncertainties are listed in table 2. These errors reflect the confidence regions for from the constrained fit after considering all the three alternative values of . For NGC 4459 Bertola et al. (1998) derived from ground-based observations an upper-limit for of M⊙ with an error of a factor of 3. For NGC 4203 the best agreement was found with M⊙. For this last object, the minimum is dramatically worse than at the same , and depends sensitively on the assumed angle ; in our constrained case, , representing a slit PA near the minor axis of the disk. None of the models for this source adequately reproduces both the inner and outer parts of the rotation curve in detail. The constrained fit appears consistent at large radii (), but invariably shows substantial deviations in the central region that produce the large . Since the outer disk in this model appears consistent with the orientation selected by the dust lanes, which reside at even somewhat larger radii, and taking into account that the innermost part of the rotation curve is nicely matched in the unconstrained case, we speculate that the rotation curve is affected by a warp in the gas disk in this source. Besides, gas kinematics in other galactic nuclei have been successfully modeled by taking warped structures into account (e.g., NGC 3227, Shinnerer et al. 2000). In light of these difficulties with the constrained fit, we adopt here only an upper limit on based on the unconstrained model, as reported also by Shields et al. (2000).
5 Discussion
The results of this study are important in several ways for the understanding of SMBHs in galaxies. For all four galaxies analyzed here, we find qualitative and/or quantitative evidence for the existence of SMBHs at their centers. For three sources we obtained well-determined values of ; for the fourth object, NGC 4203, the likely presence of a SMBH is signaled by very broad (3000 km s-1) H emission (Shields et al. 2000). An important point therefore is that all of the sources examined here apparently harbor a SMBH, reinforcing indications that such objects are an integral part of most galaxies. We emphasize that our four objects were selected from the SUNNS sample on the basis of the angular extent () and symmetry of their velocity curves, not on the existence of a steep central velocity gradient or other criteria indicative of a SMBH. We note also that the majority of objects with kinematic measurements of to date are elliptical galaxies (FM00, G00, and references therein), so that the present results for four S0 galaxies represent a substantial increase in the census of SMBHs in bulges of disk galaxies. The findings described here are also important for comparison with suggested trends relating to galaxy bulge properties. For our four galaxies, we obtained bulge -band luminosities using -band disk–bulge decompositions from Baggett, Baggett, & Anderson (1998), and colors within the galaxy effective radius, with the results listed in Table 3. Bulge masses were estimated using the mean -band ()⊙ from van der Marel (1991), rescaled to km s-1 Mpc-1. For comparison with FM00 and G00, we also calculated stellar velocity dispersions and within the bulge effective radius and within respectively, using values of from Table 1, seeing-corrected measurements of from Baggett et al. (1998), and the algorithm of Jorgensen, Franx, & Kjaegaard (1995).
Our results for as a function of bulge properties are shown in relation to previous work in Figure 5. Compared with the correlation reported by Magorrian et al. (1998), our constrained results yield black-hole masses that are lower by a factor of or more at a given while two out of four of our unconstrained 3 upper limits equally fall below the relation, consistent with other suggestions that the two-integral estimates of by these authors are systematically too large (e.g., van der Marel 1998). When compared with published analyses employing more robust measures of SMBH masses, our results show better agreement, as can be seen in the diagram of versus from Ho (1999), which derived ratio translate in a quite similar to the value first inferred by Kormendy & Richstone (1995). The constrained fits in particular are in good agreement with the latter correlation, although the upper limit for NGC 4203 continues to suggest a non-negligible degree of scatter in the versus relation.
The relationship between and is of particular interest in light of recent reports by FM00 and G00 of a very significant correlation with little intrinsic scatter. Estimates of stellar velocity dispersion employed by these authors correspond to apertures large enough to avoid the influence of a black hole on itself. Even if taken per se, our data show no correlation between Mbulge and any of the other quantities considered so far, it is worth noticing that while going from the unconstrained to the constrained procedure, the black-hole mass determinations move closer to the M∙ vs. Lbulge, , and relations. Our results, and the constrained fits in particular, are in good agreement with the quantitative relations given in both papers. These findings provide added support for the strength of an trend, and its persistence in bulges associated with disk galaxies.
As a final comment, we note that while the present work provides an illustration of the power of gas kinematics for finding and quantifying the masses of SMBHs, it also shows that a significant investment of observing time and effort is necessary in order to yield results. In particular, the SUNNS survey demonstrates that only a modest fraction (%) of nearby galaxies displaying emission-line nuclei in ground-based observations can be expected with HST to show spatially resolved nebular emission with regular kinematics suitable for estimation of . Determination of the gas velocity field with high confidence requires 2-D mapping with multiple slit positions (e.g., Barth et al. 2000), which is expensive in terms of telescope time. The alternative of employing long-slit observations at a single PA can be employed with some effort to extract useful estimates of , as demonstrated by the present work. In particular the analysis reported here further illustrates the power of using dust morphology as an indicator of gas disk orientation, in the absence of full 2-D velocity data.
References
- Baggett et al. (1998) Baggett, W. E., Baggett, S. M., & Anderson, K. S. J. 1998, AJ, 116, 1626
- Barth et al. (2000) Barth, A. J. 2000, in preparation
- Bertola et al. (1998) Bertola, F., Cappellari, M., Funes, J. ;., Corsini, E. M., Pizzella, A. and Vega Beltrán, J. C. 1998, ApJ, 509, L93
- Binney & Tremaine (1987) Binney, J. & Tremaine, S. 1987, Princeton, NJ, Princeton University Press, 1987
- Dalle Ore et al. (1991) Dalle Ore, C., Faber, S. M., Gonzalez, J. J., Stoughton, R. & Burstein, D. 1991, ApJ, 366, 38
- de Vaucouleurs et al. (1991) de Vaucouleurs, G., de Vaucouleurs, A., Corwin, H. G. Jr. , Buta, R. J., Paturel, G., Fouquè, P. 1991, Third Reference Catalogue of Bright Galaxies. Springer-Verlag, New York (RC3)
- Ferrarese & Merritt (2000) Ferrarese, L. & Merritt, D. 2000, ApJ, 539, L9
- (8) Gebhardt, K. and 14 colleagues 2000a, ApJ, 539, L13
- (9) Gebhardt, K. and 14 colleagues 2000b, ApJ, in press, astro-ph/0007123
- Harms et al. (1994) Harms, R. J., et al. 1994, ApJ, 435, L35
- Hernquist (1990) Hernquist, L. 1990, ApJ, 356, 359
- (12) Ho, L. C., Filippenko, A. V., & Sargent, W. L. W. 1997a, ApJS, 112, 315
- Ho et al. (1997) Ho, L. C., Filippenko, A. V., Sargent, W. L. W. , & Peng, C. Y. 1997b, ApJS, 112, 391
- Ho (1999) Ho, L. 1999, in Observational Evidence for the Black Holes in the Universe, ed S.K. Chakrabarti (Dordrecht: Kluwer), 157
- Jorgensen et al. (1995) Jorgensen, I., Franx, M., & Kjaergaard, P. 1995, MNRAS, 276, 1341
- Kaspi et al. (2000) Kaspi, S., Smith, P.S., Netzer, H., Maoz, D., Jannuzi, B.T. & Giveon, U. 2000 ApJ, 533, 631
- Kauffmann & Haehnelt (2000) Kauffmann, G. & Haehnelt, M. 2000, MNRAS, 311, 576
- Kent (1990) Kent, S. M. 1990, AJ, 100, 377
- Kormendy (1993) Kormendy, J. 1993, in The Nearest Active Galaxies, ed. J. Beckman, L. Colina, & H. Netzer (Madrid: CSIC Press), 197
- Kormendy & Richstone (1995) Kormendy, J. & Richstone, D. 1995, ARA&A, 33, 581
- Kriss (1994) Kriss, G. 1994, in ASP Conf. Ser. 61, Astronomical Data Analysis Software and Systems III, ed. D. R. Crabtree, R. J. Hanisch, & J. Barnes (San Francisco: ASP), 437
- Krist & Hook (1999) Krist, J., & Hook, R. 1999, The Tiny Tim User’s Guide (Baltimore: STScI)
- (23) Kronawitter, A., Saglia, R. P., Gerhard, O. & Bender, R. 2000, A&AS, 144, 53
- Magorrian et al. (1998) Magorrian, J. , et al. 1998, AJ, 115, 2285
- Monnet et al. (1992) Monnet, G., Bacon, R., & Emsellen, E. 1992, A&A, 253, 366
- Nagar et al. (2000) Nagar, N. M., Falcke, H., Wilson, A. S., & Ho, L. C. 2000, ApJ, in press, astro-ph/0005382
- Narayan Mahadevan & Quataert (1998) Narayan, R., Mahadevan, R. & Quataert, E. 1998, Theory of Black Hole Accretion Disks, Cambridge University Press, p. 148
- Norman et al. (1996) Norman, C. A., Sellwood, J. A., & Hasan, H. 1996, ApJ, 462, 114
- Pogge et al. (2000) Pogge, R. W., Maoz, D., Ho, L. C., & Eracleous, M. 2000, ApJ, 532, 323
- Press et al. (1986) Press, W. H., Flannery, B. P., Teukolsky, S. A. & Vettering, W. T. 1986, Numerical recipes: the art of scientific computing (Cambridge: Cambridge University Press)
- Rix et al. (2001) Rix, H.-W. 2001, in preparation
- Schinnerer, Eckart and Tacconi (2000) Schinnerer, E., Eckart, A. and Tacconi, L. J. 2000, ApJ, 533, 826
- Shields et al. (2000) Shields, J. C., Rix, H.-W., McIntosh, D. H., Rudnick, G., Ho, L. C., Filippenko, A. V., Sargent, W. L. W., & Sarzi, M. 2000, ApJ, 534, L27
- Terashima et al. (2000) Terashima, Y., Ho, L. C., & Ptak, A. F. 2000, ApJ, 539, 161
- Tully (1988) Tully, R. B. 1988, Nearby Galaxies Catalog (Cambridge: Cambridge Univ. Press)
- van der Marel (1991) van der Marel, R. P. 1991, MNRAS, 253, 710
- van der Marel (1998) van der Marel, R. P. 1998, in IAU Symposium 186, Galaxy Interactions at Low and High Redshift, ed. D. B. Sanders & J. Barnes (Dordrecht: Kluwer), 333
- Verdoes Kleijn, et al. (1999) Verdoes Kleijn, G. A., Baum, S. A., de Zeeuw, P. T. and O’Dea, C. P. 1999, AJ, 118, 2592
- Wandel (1999) Wandel, A. 1999, ApJ, 519, L39
| Galaxy | Morph. Type | i | P.A. | Nuclear Type | Dist | STIS slit P.A. | Obs. Date | ||
|---|---|---|---|---|---|---|---|---|---|
| (1) | (2) | (3) | (4) | (5) | (6) | (7) | (8) | (9) | (10) |
| NGC 2787 | SB(r)0+ | 11.82 | 50 | 117 | L1.9 | 13.0 | 210 | 33.2 | 1998 Dec 5 |
| NGC 4203 | SAB0-: | 11.80 | 21 | 10 | L1.9 | 9.7 | 124 | 105.3 | 1999 Apr 18 |
| NGC 4459 | SA(r)0+ | 11.32 | 41 | 110 | T2: | 16.8 | 189 | 92.9 | 1999 Apr 23 |
| NGC 4596 | SB(r)0+ | 11.35 | 42 | 135 | L2:: | 16.8 | 154 | 70.3 | 1998 Dec 20 |
Note. — Cols. (2), (3) and (4): morphological type, total apparent magnitude , inclination and major axis P.A. from de Vaucouleurs et al. (1991). Col. (5): nuclear emission type from Ho et al. (1997a): H = HII nucleus, S = Seyfert nucleus, L = LINER, and T = transition object. The number attached to the class letter designates the type, while the “:” and “::” indicate an uncertain or highly uncertain classification, respectively. Col. (6): distance from Tully (1988) in Mpc. Col. (7): Ground-based central stellar velocity dispersion in , taken from Dalle Ore et al. (1991) for the first three sources and from Kent (1990) for NGC 4596; these authors obtained measurements through apertures of size and , respectively. Col. (8): P.A. of the STIS aperture. Col. (9): UT observation date.
| Galaxy | Msph | ||||
|---|---|---|---|---|---|
| (1) | (2) | (3) | (4) | (5) | (6) |
| NGC 2787 | 18.5 | 7.1 | 49 | 14 | 2.9 |
| NGC 4203 | 5.2 | 49 | 75 | 1.5 | |
| NGC 4459 | 1.8 | 7.3 | 47 | 8 | 6.4 |
| NGC 4596 | 0.8 | 7.8 | 40 | 41 | 8.6 |
Note. — Cols. (2) and (3): estimates or upper limits in units of M⊙, along with and confidence limits, for the unconstrained and constrained models, respectively. The only exception is the upper limit for the black-hole mass of NGC 4203, which was derived according to the confidence limit. Cols. (4) and (5): angles describing gas disk orientation, in degrees, for the constrained models. Col. (6): bulge mass in units of M⊙ derived from the luminosities in Table 3 and the mean derived by van der Marel (1991).
| Galaxy | () | |||||
|---|---|---|---|---|---|---|
| (1) | (2) | (3) | (4) | (5) | (6) | (7) |
| NGC 2787 | 10.76 | 11.17 | 1.10 | 3.25 | 184.9 | 206.5 |
| NGC 4203 | 10.86 | 11.33 | 0.98 | 1.74 | 109.9 | 122.7 |
| NGC 4459 | 10.37 | 10.99 | 0.98 | 7.16 | 166.6 | 186.1 |
| NGC 4596 | 10.41 | 10.69 | 0.96 | 9.61 | 136.3 | 152.3 |
Note. — Col. (2): galaxy total V-band magnitude from de Vaucouleurs et al. (1991). Col. (3): V-band magnitude for galaxy the bulge light, obtained by subtracting from the total galaxy light the disk contribution inferred from Baggett et al. (1998). Col. (4): galaxy effective colors from de Vaucouleurs et al. (1991). Col. (5): bulge -band luminosities. Cols. (6) and (7): stellar velocity dispersion and in km s-1, within a circular aperture of radius Re or Re/8 respectively.

![[Uncaptioned image]](/html/astro-ph/0010240/assets/x2.png)
![[Uncaptioned image]](/html/astro-ph/0010240/assets/x3.png)
![[Uncaptioned image]](/html/astro-ph/0010240/assets/x4.png)


![[Uncaptioned image]](/html/astro-ph/0010240/assets/x8.png)
![[Uncaptioned image]](/html/astro-ph/0010240/assets/x9.png)
![[Uncaptioned image]](/html/astro-ph/0010240/assets/x10.png)
