K-Band Spectroscopy of Compact Star Clusters in NGC 4038/4039
Abstract
Integral field spectroscopy in the K-band (1.9-2.4m) was performed on four IR-bright star clusters and the two nuclei in NGC 4038/4039 (“The Antennae”). Two of the clusters are located in the overlap region of the two galaxies, and together comprise 25% of the total 15m and 10% of the total 4.8 GHz emission from this pair of merging galaxies. The other two clusters, each of them spatially resolved into two components, are located in the northern galaxy, one in the western and one in the eastern loop of blue clusters. Comparing our analysis of Br, CO band-heads, He I 2.058m, H (from archival HST data), and VK colors with stellar population synthesis models indicates that the clusters are extincted (AV mags) and young, displaying a significant age spread (4-13 Myrs). The starbursts in the nuclei are much older (65 Myrs), with the nucleus of NGC 4038 displaying a region of recent star formation northward of its K-band peak. Using our derived age estimates and assuming the parameters of the IMF (Salpeter slope, upper mass cut-off of 100 M☉, Miller-Scalo between 1 M☉ and 0.1 M☉), we find that the clusters have masses between 0.5 and 5 106 M☉.
1 Introduction
Arguably, one of the most fascinating recent astrophysical discoveries is the rich population of young luminous blue “globular-like” clusters in strongly interacting and merging systems (Holtzman et al., 1992; Whitmore et al., 1993, 1997; Whitmore & Schweizer, 1995, hereafter WS95). These clusters all appear much younger ( 100 Myrs) than both the old globular cluster system and underlying background population and have dynamical masses (Mfew 105 M☉ – in a few cases – Ho & Filippenko, 1996) and effective radii very similar to the globulars (re10 pc – WS95). The formation of such clusters appears to be generic to the merger process and is likely the result of the high pressures that are induced during the merger process (e.g., Elmegreen & Efremov, 1997).
The star formation activity in NGC 4038/4039 – the “Antennae” – has been known from studies at various wavelengths, for example from H spectroscopy (Rubin et al., 1970) or the very blue colors observed in the HST images (WS95). Its relative proximity (19 Mpc assuming H0=75km s-1Mpc-1) makes it the ideal candidate for the study of merger induced star formation on scales of single star clusters and has allowed for the detection and investigation of a very large number (800) of compact clusters (Whitmore et al., 1999, WS95). The heavily extincted overlap region was revealed to be the most active star formation zone by radio observations (Hummel & Van der Hulst, 1986) and imaging and spectroscopy performed with ISO (Mirabel et al., 1998; Kunze et al., 1996; Fischer et al., 1996). The overlap region is, however, relatively inconspicuous at optical wavelengths. The ISO results suggest very young ages for these clusters and the presence of high mass (50-60 M☉) stars. Interestingly, a significant fraction of the total bolometric flux from the Antennae appears to originate in two clusters eastward of the NGC 4039 nucleus (numbers 86/87/88/89/90 in WS95), building up an optically bright knot, and number 80 in WS95, which is optically extincted and declared a “very red object”. These two regions, which are the highest surface brightness features in the mid-infrared, contribute 25% of the total flux at 15m (Mirabel et al., 1998) and 20% of the total emission from discrete radio sources in NGC 4038/4039 (Hummel & Van der Hulst, 1986). These large fractions suggest that these two regions must constitute a significant portion of the very recent or on-going star-formation within the Antennae. Understanding their properties within the perspective of the overall star formation history of the Antennae is of prime importance to understanding the bolometric output of these merging galaxies. We discuss the properties of these regions as determined through IR integral field spectroscopy in combination with data available from the literature.
2 Cluster Selection and Observations
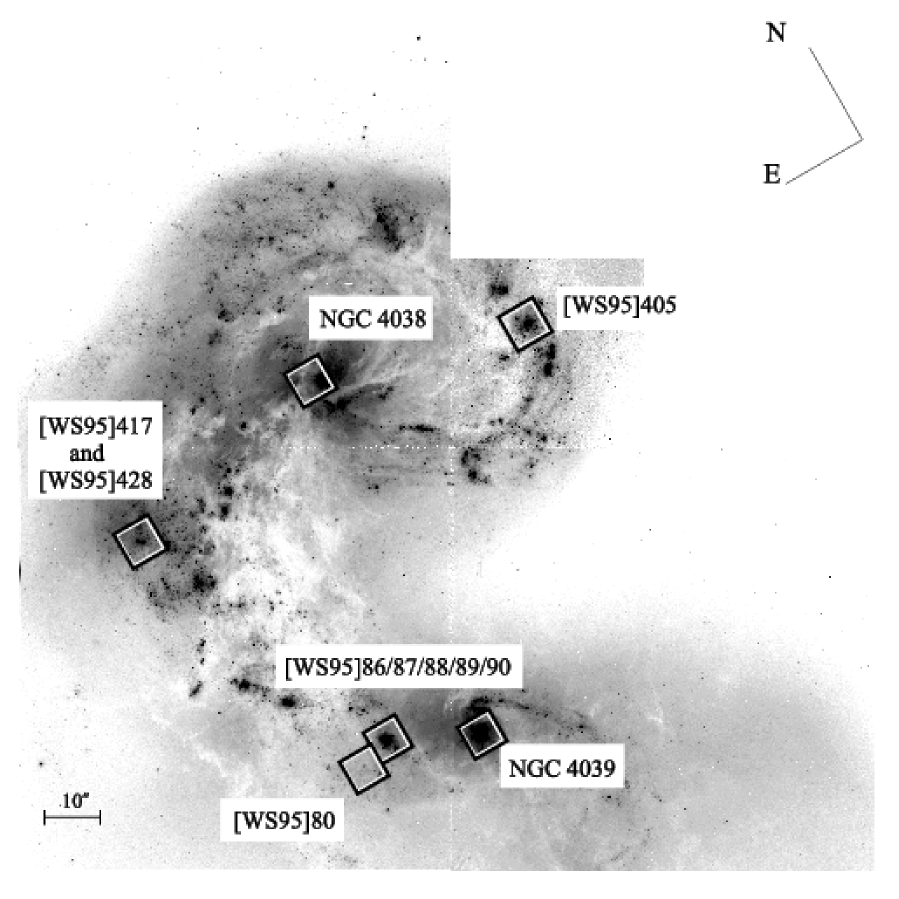
Models of the merger of two spiral galaxies (like that currently being observed in NGC4038/4039) predict multiple bursts of star formation during the merger event (Mihos and Hernquist, 1996). Depending on the stage of the merger, these bursts can be in the region of overlap of the two galaxy disks, in the tidally shocked regions of the outer disks of each galaxy, or as significant quantities of gas fall in towards the two nuclei, in the nuclei of each galaxy. We observed the two most prominent clusters within the interaction zone, two other IR bright clusters in the outer arms of NGC 4038/4039 (likely to be tidally shocked regions), and the two nuclei. Such a selection would allow us (at a minimum) to probe the various regions of star-formation during the merger process within the inevitable constraint of only having a limited amount of observing time. While only observing six regions will not allow us to investigate the properties of the whole ensemble of compact clusters in the Antennae, our sample allows us to crudely investigate the possible range of ages across the Antennae. Figure 1 shows the two clusters in the interaction zone ([WS95]86 and [WS95]80), the two nuclei (NGC 4038 and NGC 4039) and two clusters in the outer loops ([WS95]417/[WS95]428 in the eastern and [WS95]405 in the western), observed with the 3D integral field spectrometer (Weitzel et al., 1996; Krabbe et al., 1995) in the K band.
For the observations, 3D was combined with the tip-tilt-guider ROGUE (Thatte et al., 1995) on the Anglo-Australian Telescope in February, 1998 and April, 1999. We used a K-band grism with a resolution of and a 256x256 NICMOS 3 array. 256 spectra are obtained simultaneously, arranged in a 16x16 pixel field on the sky. The detector integration time per exposure was 100 seconds. The on-source exposures were interleaved with off-source (offset 60″E of each cluster) exposures of identical integration time for the sky subtraction. To remove telluric features, the A2V star HD106819 was observed roughly once every hour. In order to Nyquist sample the spectra, we dithered in the spectral direction by half a pixel using a piezo-driven mirror. The spatial pixel scale of 04 provided a field of view of 64x64.
The conditions were generally not photometric and flux calibration achieved via aperture photometry available from the literature (Bushouse & Stanford, 1992) in combination with Ks-band imaging (see also next section). The seeing during the observations of each individual region only showed moderate variation (02) but was significantly different for different objects. The values for each observation are discussed in section 4. The total on-source integration time was 6200s on the first field (hereafter abbreviated to [WS95]86), which is the optically bright star cluster, corresponding to the numbers 86/87/88/89/90 in WS95; 4200s on-source time for the second field (hereafter [WS95]80), which corresponds to the “very red object” number 80 in WS95; 3120s on-source time for the field in the eastern loop (numbers 417 and 428 in WS95); 3840s for the targets in the western loop (WS95 - number 405 and several fainter objects, hereafter [WS95]405). The nuclei of NGC 4038 and NGC 4039 were observed for 3360s and 2160s respectively. Due to a piezo failure, the spectrum of the nucleus of NGC 4039 is not Nyquist sampled.
3 Data Reduction and Analysis
Data reduction was performed using the 3D data reduction routines developed at MPE within the GIPSY (van der Hulst et al., 1992) data reduction environment. Single frames were dark subtracted, linearized and sky subtracted using the sky frame that was closest chronologically and had the right spectral dithering position. The wavelength calibration was accomplished by exposures of a neon discharge lamp. The re-binning of the spectrally interleaved data was performed onto a 600 pixel linear wavelength axis. Bad pixels and cosmic rays were removed from the 16x16x600 data cube, either by interpolation or by masking out. After spatial re-binning onto a 64x64 pixel grid, the single cubes were stacked by centering each on its K-band continuum peak or the Br peak for [WS95]86 and [WS95]80, respectively. Telluric features were removed by division by the atmospheric transmission profile obtained from the observations of the A2V star. The Br absorption line in the calibrator spectrum was interpolated linearly between the adjacent continuum. In the resulting cluster spectra, only the NGC 4038 nucleus spectrum shows a little remaining Br emission from the calibrator, which is not a worry, because it is at zero redshift and does not contaminate the Br emission from the object.
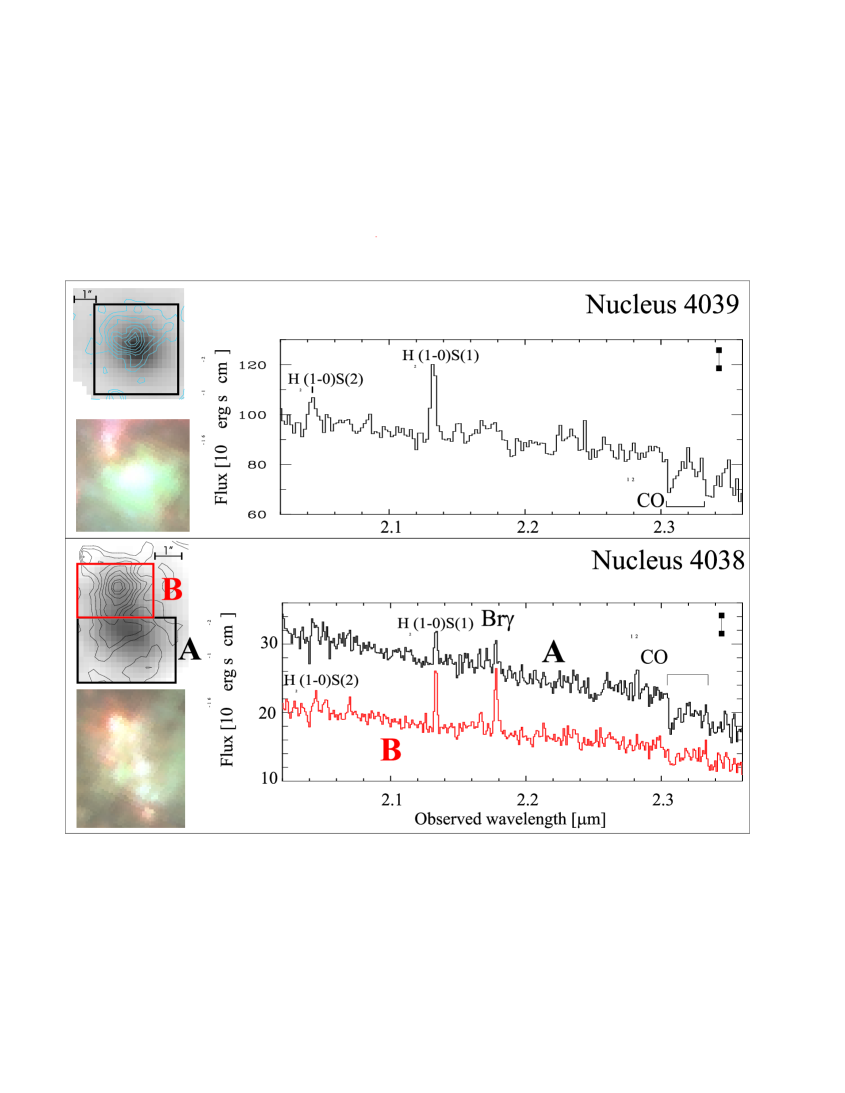
Object spectra were extracted using a square aperture centered on the continuum peak and sized to maximize the SNR of the resulting spectrum. The individual apertures and their sizes are shown in Figure 2. For fields which showed significant offsets between continuum and Br line emission peaks ([WS95]405 and the nucleus of NGC 4038), the aperture sizes were chosen so as to minimize contamination between the continuum and line emitting regions. The spectra were flux calibrated using the Ks-magnitudes from our flux calibrated SOFI image, obtained in May 99 at the NTT. The extracted spectra were normalized by dividing by the continuum value, estimated using a linear fit. From this we estimated the equivalent widths Wλ of the Br- and the He I-lines and the CO-band-heads. For the creation of linemaps, the linear fit was performed for each spatial pixel and subtracted. The spectra of all the regions (divided into subregions for some of the fields) are shown in Fig. 2, together with the Ks-band images. Overlaid are the contours of Br or the H2(1-0)S(1)-line (labelled in Fig. 2).
4 Results
![[Uncaptioned image]](/html/astro-ph/0010238/assets/x2.png)
Results obtained from our data, incorporating results from publicly available HST data (H and V-band images – Whitmore et al., 1999), are listed in Table 1. [WS95]86 was slightly resolved while [WS95]80 was unresolved (both combined data sets had a final FWHM10; Fig. 2). The FWHM of the seeing was 08 during [WS95]417&428 observations, and the two clusters are marginally resolved into single components. During [WS95]405 observations, the seeing was poor (16), but to the NE of the bright cluster, a fainter second cluster is visible. The tabulated values for [WS95]405-A and B refer to the bright cluster (A) and to the location of the Br peak (B).
We used the measured equivalent width of Br, WBrγ, and CO 2.29m band-head, WCO (Table 1), to determine the ages of the starbursts using stellar synthesis models (Leitherer et al., 1999; Kovo, Sternberg & Alexander, 1998). See plots in Leitherer et al. (1999) (their Figures 89 and 101), showing the evolution of these parameters with burst age. Assuming an upper mass cutoff Mupper=100M☉, Salpeter IMF slope and an instantaneous burst at solar metallicity, we derive ages of 3.7yr for [WS95]86 and 5.5yr for [WS95]80. Gilbert et al. (2000) derive a value of 4 Myrs for [WS95]80, assuming the same starburst parameters, in reasonable agreement with our value. The ages of the two clusters in [WS95]417&428 are not very well constrained, due to the low S/N of the data and the ambiguous value of the WCO. However, the values of WCO are sufficiently large to exclude additional errors introduced by the non-inclusion of the thermally pulsing asymptotic giant branch phase in the Geneva stellar evolution tracks that were incorporated in Leitherer et al. (1999) (Origlia & Oliva, 2000). Age estimates of [WS95]417&428 lie between 8.5 and 12.8 Myrs old. For the [WS95]405 spectra, it is not possible to get a consistent model age with the presence of both strong CO-band-heads and Br emission with an instantaneous burst. But given the size of the cluster (Reff=12.3pc, Whitmore et al., 1999) it is plausible to assume that the star-formation has a finite duration of a few Myrs (Efremov & Elmegreen, 1998). Other possibilities that might explain why these clusters have both CO absorption and Br emission are shock heating of the gas due to supernova explosions, the seeing broadened Br emission from the region to the S-E of [WS95]405-A which contaminates the cluster spectrum, supersolar metallicity, and possible gaps in our knowledge of stellar evolution and model atmospheres. It is interesting to compare the 3D image and spectra of a region outside both [WS95]405 clusters with the multi-color HST image, since our data show a Br peak to the SE of the K-band continuum peak of cluster A. This coincides with a dust filament obvious in the HST image, and it could be the site of more recent star formation or of shock excitation in a more dusty environment.
A detailed discussion of the nuclear spectra is beyond the scope of the current paper. Here we only wish to emphasize how the spectra of the two nuclei differ from the young compact clusters. The WCO of the two nuclei suggest the same possible age range for both, 6515 Myrs, considerably older than the ages estimated for the prominent young clusters. The northern nucleus also shows evidence for a more recent starburst to the north of the K-band peak, but it is difficult to estimate its age due to the underlying continuum contribution by the older background nuclear stellar population. But the presence of Br emission (no evidence for AGN activity was seen in other observations so far) requires the presence of O or B stars or recent shock excitation, thus implying that it is younger than 10-20 Myrs. Under the assumption that there is no intrinsic gradient in WCO across the NGC 4038 nucleus, meaning that the observed lower WCO at the location of the Br peak can be attributed to the additional continuum from the young stellar population, we estimate the young star light continuum to contribute about 1/5 of the total continuum, which increases the observed WBrγ to 58Å. This then implies an age of the starburst of around 6 Myrs, consistent with the effective temperature of 33000K derived from the low ratio of He I/Br of 0.17.
The age uncertainties given in Table 1 only take into account uncertainties in the signal-to-noise of the data and do not take into account the systematic effects of selecting different IMF slopes, upper and lower mass cutoffs, abundances, or uncertainties in the models themselves.
The extinction was derived by comparing the theoretical ratio of H/Br (case B recombination ratio assuming Te=10000 K from Storey & Hummer, 1995) with the observed ratio. Using the extinction curve of Draine (1989) for a foreground screen model, we derived AV of 1.40.2 and 4.30.2 for [WS95]86 and [WS95]80, respectively. They agree within the errors with the values we derived from the V-K color excess with the intrinsic color derived from the models for the respective cluster ages (AV = 1.6 and 3.7). For [WS95]417&428 and [WS95]405, we used the V-K colors not to confirm the extinction, but rather to further constrain the age.
The ratio of He I 2.058m/Br is not an unambiguous tracer of the effective temperature of the highest mass stars present in a stellar population (Shields, 1993; Förster-Schreiber, 1998), but it was determined to compare with the ISO results at higher spatial resolution. The effective temperatures derived from the ratios of He I/Br=0.47 and 0.5 are 36,000 and 38,000K ([WS95]86 and [WS95]80, respectively), which corresponds to masses of roughly 28 M☉ and is below the 44,000K (50-60 M☉) derived from mid-infrared line ratios by Kunze et al. (1996). Given the sensitivity of the He I 2.058m line to nebular parameters (Shields, 1993) and the large aperture (14”27”) used for the ISO measurement, some disagreement between our estimate and that obtained using ISO data for the temperature of the hottest stars is not surprising. Moreover, the relationship between temperature of the hottest stars and He I/Br is not monotonic and thus our estimates for the mass should be considered lower limits. These upper mass limits are consistent with our estimated ages of the [WS95]80 cluster, while the younger age of [WS95]86 would allow for the detection of higher mass stars. A qualitative comparison of the derived effective temperatures/ages of all fields agrees with the gradient in the Ne III/Ne II observed by Vigroux et al. (1996).
From the extinction corrected Br flux we can estimate the number of Lyman continuum photons, NLyc. For this calculation, we used the extinction corrected Br flux, a distance of 19.2 Mpc for the Antennae, and recombination coefficients from Hummer & Storey (1987) and Storey & Hummer (1995). We find that NLyc=3.11052 s-1 and 1.91052 s-1 for [WS95]86 and [WS95]80 respectively. This somewhat lower than the value derived from the thermal radio continuum flux density estimated by Hummel & Van der Hulst (1986), which results in N s-1 for the sum of [WS95]86 and [WS95]80. Given that our apertures are smaller, the difficulty in estimating the thermal contribution to the total radio emission, and that there is some diffuse radio emission, it is not surprising that there is a difference between the two estimates. It is also significantly less than the value of 1.0 photons s-1 derived by Gilbert et al. (2000). Both our observed flux and estimated extinction are lower by factors of and both of these differences account for the discrepancy between our respective estimates of the Lyman continuum flux. However, Gilbert et al. (2000) caution that the extinction value they derived (AK = 1.1mag) should be considered an upper limit.
Comparing our results (MK (0) and NLyc) with the models of Leitherer et al. (1999, assuming a Salpeter IMF slope, Mupper=100 M☉, high mass stars have already evolved off the main sequence and are therefore not observed, and Mlower=1 M☉) for the age determined for each cluster in the previous section, the total mass of each cluster would be 1.6 and 3.0106 M☉ for [WS95]86 and [WS95]80 respectively. A lower mass limit equal to 0.1 M☉ (using Miller-Scalo slope for the lower mass end of the IMF) would imply masses a factor of 1.6 higher. For [WS95]417&428 and [WS95]405, we crudely estimated their masses using only their extinction-corrected K-magnitudes compared to the magnitudes expected from our derived ages. Their masses are lower than the masses of [WS95]86 and [WS95]80, and lie between 0.3 and 1.1 M☉.
This places each of the very massive [WS95]86 and [WS95]80 clusters into the same mass regime as M82A, which produces roughly the same amount of NLyc, and has the same burst age (Förster-Schreiber, 1998). Their masses are more than a factor of ten higher than the average mass of a globular cluster (Mandushev et al., 1991). Even if they are expected to lose 60% of their mass over a Hubble time (Chernoff & Weinberg, 1990), they will still represent the top-end of the globular cluster mass function. The [WS95]417&428 and [WS95]405 clusters have masses which are more moderate and comparable to the average globular cluster mass. This mass range in the observed clusters is not surprising given that those two fields contribute a substantial amount of the bolometric luminosity of the Antennae. But a more accurate mass estimate of a larger fraction of the population of young star clusters is necessary to judge if the young clusters could evolve to form a part of the globular cluster population of an elliptical galaxy.
5 Summary and Conclusions
We performed integral field spectroscopy in the K-band (1.9-2.4m) on four star clusters and the nuclei in NGC 4038/4039 in order to derive the starburst properties and their variations with the location in the merger. Our analysis of Br, CO band-heads, He I 2.058m/Br, H, and V-K colors indicates that the clusters show a considerable age spread from 4-13 Myrs. The two star clusters in the interaction zone have ages near the lower limit of that range, while those in the outer loops lie near the top of that age range. These clusters sample the overall age gradient visible in the Antennae, the details of which we will discuss in a forthcoming paper. The equivalent widths of the CO band-heads indicate that the starbursts in the nuclei are considerably older (65 Myrs; with the nucleus of NGC 4038 having evidence for a significant contribution from younger population with an age of 6 Myrs northward of its K-band continuum peak). The extinction is highly variable and especially high in some parts of the overlap region (AV=0.2 to 4.3). Using these age estimates and assuming the parameters of the IMF (Salpeter slope, upper and lower mass cutoffs, etc.), we find that the clusters have masses ranging between 0.3 to 3 106 M☉, (larger if the IMF is extended below 1 M☉). Our observations that the K-band continuum peak (with its strong CO absorption) and the highest surface brightness Br emission are not coincident in some regions and possible variations in WCO for clusters in [WS95]405 and the nucleus of NGC 4038 argues for sequential star formation on small scales.
References
- Bushouse & Stanford (1992) Bushouse H.A. & Stanford S.A., 1992, ApJS, 79, 213
- Chernoff & Weinberg (1990) Chernoff D.F., Weinberg M.D., 1990, ApJ, 351, 121
- Draine (1989) Draine, B. T. 1989, in Proc. of the 22nd ESLAB Symposium on Infrared Spectroscopy in Astronomy, ed. B. H. Kaldeich (ESA SP-290), P. 93
- Efremov & Elmegreen (1998) Efremov, Y. & Elmegreen, B. 1998, MNRAS, 299, 588
- Elmegreen & Efremov (1997) Elmegreen, B. & Efremov, Y. 1997, ApJ, 480, 235
- Fischer et al. (1996) Fischer, J. et al. 1996, A&A, 315, 97
- Förster-Schreiber (1998) Förster-Schreiber, N. M. 1998, Ph. D. thesis, der Ludwig-Maximilians-Universität München
- Gilbert et al. (2000) Gilbert, A. M. et al. 2000, preprint (astro-ph 9912369)
- Ho & Filippenko (1996) Ho, L. & Filippenko, A. 1996, ApJ, 472, 600
- Holtzman et al. (1992) Holtzman, J. A. et al. 1992, AJ, 103, 691
- Hummel & Van der Hulst (1986) Hummel, E. & Van der Hulst, J. M. 1986, A&A, 155, 151
- Hummer & Storey (1987) Hummer, D. G. & Storey, P. J. 1987, MNRAS, 224, 801
- Kovo, Sternberg & Alexander (1998) Kovo, O., Sternberg. A., & Alexander, T. 1998, private communication
- Krabbe et al. (1995) Krabbe, A., et al. 1995, ApJ, 447, 95
- Kunze et al. (1996) Kunze, D. et al. 1996, A&A, 315, 101
- Leitherer et al. (1999) Leitherer, C., et al. 1999, ApJS, 123, 3
- Mandushev et al. (1991) Mandushev G., Spassova N. & Staneva A., 1991, A&A, 252, 94
- Mihos and Hernquist (1996) Mihos J.C., Hernuist L., ApJ, 464, 641
- Mirabel et al. (1998) Mirabel, I. F., et al. 1998, A&A, 333, 1
- Oliva et al. (1995) Oliva E., Origlia L., Kotilainen J.K., Moorwood A.F.M., 1995, A&A, 301, 55
- Origlia & Oliva (2000) Origlia L. & Oliva E., astro-ph 0003131
- Rubin et al. (1970) Rubin V. et al. 1970, ApJ, 160, 801
- Shields (1993) Shields J. 1993, ApJ, 419, 181
- Storey & Hummer (1995) Storey, P. J. & Hummer, D. G. 1995, 272, 41
- Thatte et al. (1995) Thatte, N. A., Kroker, H., Weitzel, L., Tacconi-Garman, L. E., Tecza, M., Krabbe, A., & Genzel, R. 1995, SPIE, 247, 228.
- van der Hulst et al. (1992) van der Hulst, J. M., Terlouw, J. P., Begeman, K., Zwister, W., & Roelfsema, in Astrophysical Data Analysis Software and Systems I, (eds. D. M. Worall, C. Biemesderfer, and J. Barnes), ASP Conf. series num. 25, p. 131
- Vigroux et al. (1996) Vigroux, L. et al. 1996, A&A, 315, L93
- Weitzel et al. (1996) Weitzel, L., et al. 1996, A&AS, 119, 531
- Whitmore et al. (1993) Whitmore, B. C., Schweizer, F. Leitherer, C., Borne, K., & Robert, C. 1993, AJ, 106, 1354
- Whitmore & Schweizer (1995) Whitmore, B. & Schweizer, F. 1995, AJ, 109, 960
- Whitmore et al. (1997) Whitmore, B. C., Miller, B. W., Schweizer, F., & Fall, S. M. 1997, AJ, 114, 2381
- Whitmore et al. (1999) Whitmore, B. C., Zhang, Q., Leitherer, C. Fall, S. M., Schweizer, F., & Miller, B. W. 1999, AJ, 118, 1551
| Property | Unit | [WS95]86 | [WS95]80 | [WS95]417 | [WS95]405-A | NGC 4039 | NGC 4038 |
|---|---|---|---|---|---|---|---|
| [WS95]428 | [WS95]405-B | nucleus | A and B | ||||
| (1) | (2) | (3) | (4) | (5) | (6) | (7) | (8) |
| R.A. | J2000 | 12 | 12 | 12 | 12 | 12 | 12 |
| Dec. | J2000 | -18∘53′022 | -18∘53′060 | -18∘52′103 | -18∘52′116 | -18∘53′103 | -18∘52′043 |
| Apert. size | 2222 | 2222 | 1414 | 2222 | 3838 | 3826 | |
| 1410 | 2018 | 3022 | |||||
| WBrγ | Å | 21010 | 11610 | 22 | 10.02.5, | 2.90.9 | 3.20.9 |
| 73.0 | 545 | 112 (58) | |||||
| WCO | Å | 0 | 0 | 194 | 16.11.0 | 10.20.9 | 10.00.9 |
| 152 | 02 | 8.30.9 | |||||
| Age | 106yr | 3.7 | 5.5 | 8.5…12.8 | 8.1 | 6515 | 6515 |
| each | (5.9) | ||||||
| He I/Br | 0.470.02 | 0.500.02 | 0.170.03 | ||||
| Teff | 103K | 361 | 381 | 331 | |||
| mK | mag | 14.50.2 | 14.80.2 | 15.50.3 | 13.90.2 | 12.30.2 | 12.90.2 |
| each | 13.30.2 | ||||||
| mV | mag | 16.30.15 | 18.80.15 | 19.10.3, | 16.80.2 | 15.30.2 | 16.10.2, |
| 19.30.3 | 16.60.2 | ||||||
| AV | mag | 1.40.3 | 4.30.3 | 0.30.3 | 0.60.3 | 0.20.1 | 0, |
| 0.50.2 | |||||||
| FBrγ | 10-16 erg | 838 | 428 | 1.51 | 183 | 201 | 72 |
| s-1cm-2 | (A+B) | 213 | |||||
| FHα | 10-14 erg | 323 | 2.30.2 | 1.20.2 | 101 | 171 | 81 |
| s-1cm-2 | (A+B) | (A+B) | 131 | ||||
| Mass | 106M☉ | 1.6 | 3.0 | 0.4-0.6 | 1.10.3 | ||
| each |
Note. — Col. (1) — Measured properties with 1 uncertainties. Apert. size is the size of the apertures from which the values were derived. WBrγ indicates the equivalent width of the Br line, WCO is the equivalent width of the 12CO (2-0) bandhead feature, determined in the wavelength range 2.3060 - 2.3092 m, which corresponds to the wavelength range given by Oliva et al. (1995), redshifted to the radial velocity of the Antennae. Its uncertainty was estimated from the neighbouring continuum. For comparison, a few values of WCO for stars observed with 3D: K4.5 Ib: 15.3Å, M3.5 Iab: 19.6Å, K3 III: 9.1Å, M1 III: 12.1Å (Förster-Schreiber, 1998). Age is the model age (instantaneous burst, Salpeter IMF between 1 and 100 M⊙, solar metallicity) that most closely matches the equivalent widths of Br and CO. Where the value for WCO covered a range that did not behave monotonically with age, we gave an age range rather than a value . Teff of the most massive stars as indicated by the He I/Br ratio, He I/Br measured from the 3D spectroscopy, mK from our spectroscopy, mV from HST images (Whitmore et al., 1999), AV from the flux ratio of Br/H, FBrγ as measured from our data, FHα from HST images (Whitmore et al., 1999). Col. (2) — Unit in which the measurements in Cols. (3) to (8) are tabulated. Col. (3) to (8) — The measured properties (given in Col. (1)) of the six observed fields. The values for the properties of NGC 4038-B (Age, Teff and the value for WBrγ in parentheses) make use of an assumption about the continuum level, see text for details. Moreover, the age determination of the nuclei may be influenced by the non-inclusion of the TP-AGB phase in the Starburst99 models.