A deep submillimetre survey of the Galactic Centre
Abstract
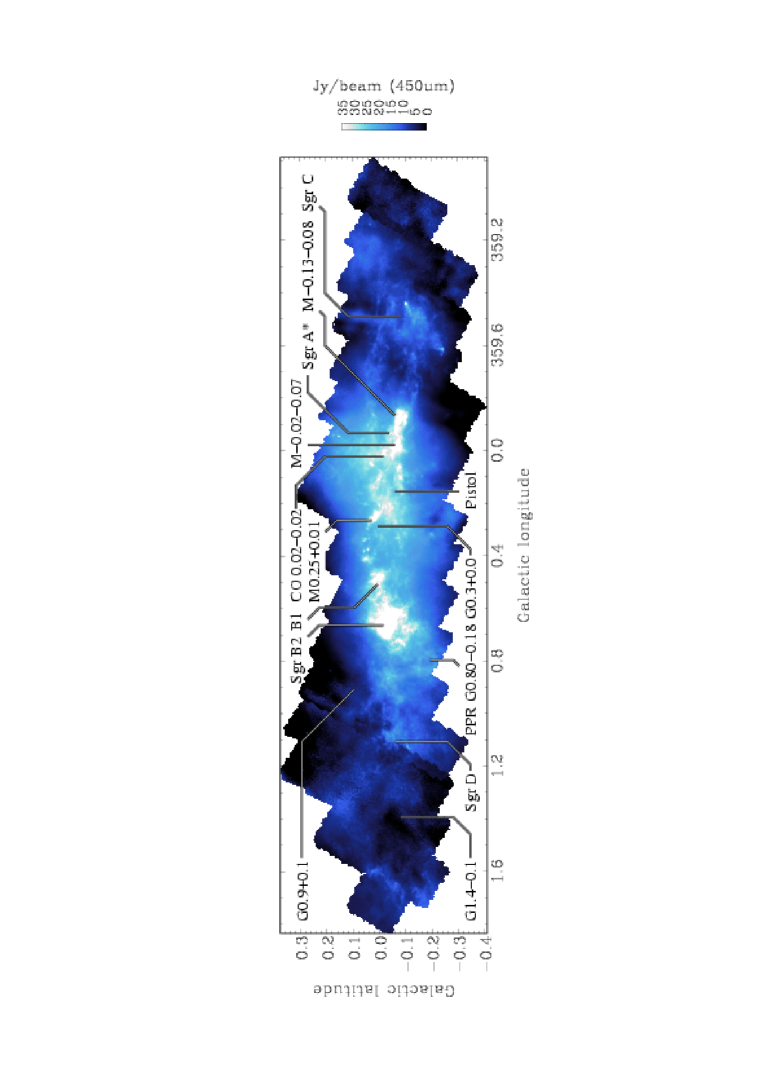
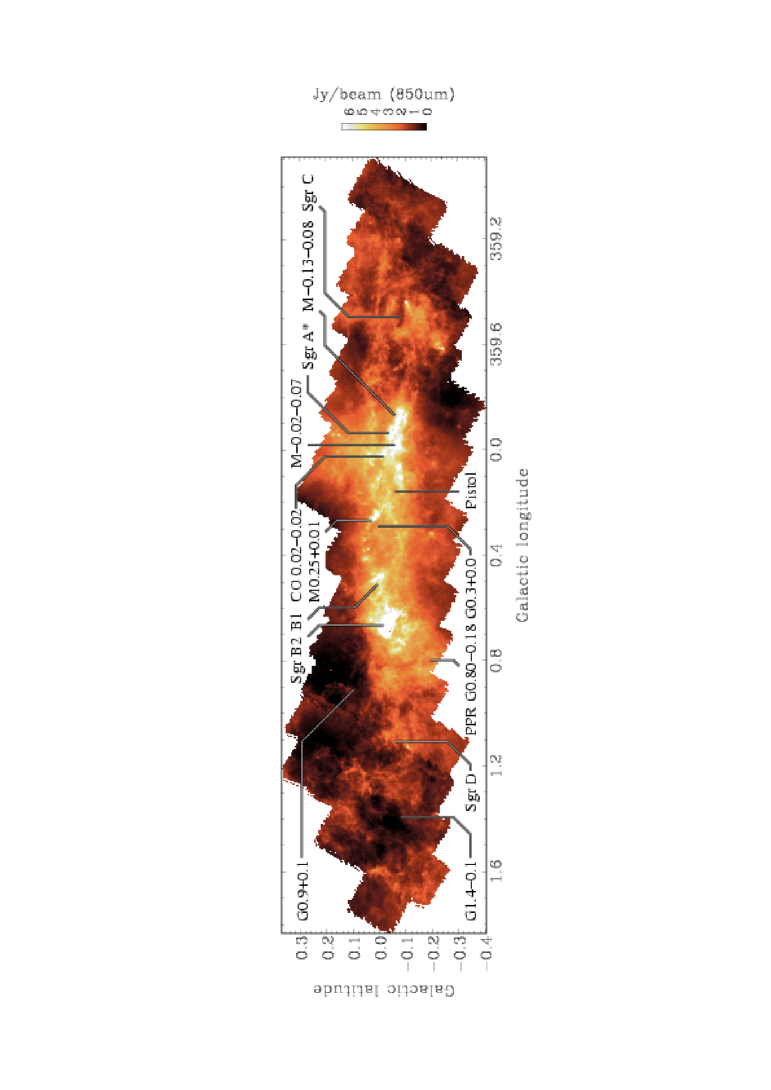
We present first results from a submillimetre continuum survey of the Galactic Centre ‘Central Molecular Zone’ (CMZ), made with SCUBA on the James Clerk Maxwell Telescope. SCUBA’s scan-map mode has allowed us to make extremely wide-field maps of thermal dust emission with unprecedented speed and sensitivity. We also discuss some issues related to the elimination of artefacts in scan-map data. Our simultaneous 850/450 maps have a total size of approximately () elongated along the galactic plane. It covers the Sgr A region—including Sgr A*, the circumnuclear disc, and the and clouds; the area around the Pistol; Sgr B2—the brightest feature on the map; and at its Galactic Western and Eastern edges the Sgr C and Sgr D regions. There are many striking features such as filaments and shell-like structures, as well as point sources such as Sgr A* itself. The total mass in the Central Molecular Zone is greater than that revealed in previous optically-thin molecular line maps by a factor of , and new details are revealed on scales down to across this -wide region.
1 Introduction
The Galactic Centre provides our best opportunity to study the astrophysical processes in a galactic nucleus with high spatial resolution. These include star-formation and the molecular cloud structures in a region subjected to strong shear forces, magnetic fields, and gravitational potentials. Thermal dust continuum emission traces the temperature-weighted column density of material in a less biased way than molecular line maps, which are affected by excitation, optical depth, and abundance variations. Thus, we can use the continuum emission to map the mass distribution in molecular clouds with good accuracy and sensitivity.
We used SCUBA (Holland et al. 1999) on the 15-m James Clerk Maxwell Telescope (JCMT), between April 1998 and April 2000, to map the Galactic Centre region in the submillimetre continuum at and . The new images cover a region 4 times larger and times deeper than earlier surveys (Lis & Carlstrom 1994). The map size is approximately , or at an assumed distance of . The map covers the entire ‘Central Molecular Zone’ (CMZ), which extends to radii of and contains up to of the Galaxy’s molecular interstellar medium (ISM) (Morris & Serabyn 1996).
2 Observations and data reduction
SCUBA (Holland et al. 1999) is a submillimetre continuum bolometer camera with two arrays, one of 91 pixels optimised for , and one of 37 pixels optimised for . In use, both arrays observe simultaneously. The resolution is FWHM at and at .
SCUBA was used in scan-map mode, in which the array is scanned across the sky at a rate of per second whilst chopping the secondary mirror at . This chopping produces images in which the sky is convolved with the primary beam of the telescope and a dual-beam function, of positive and negative delta functions separated by the chop throw.
The majority of the map was observed six separate times, with chop throws of 20, 30, and in both R.A. and Dec., although some fields at the Galactic Eastern and Western ends were observed with 30, 44, and chops. Each dual-beam image contains no information at spatial frequencies equal to the inverse chop throw and its harmonics, and the constant power level (zero spatial frequency) is also lost.
The data were reduced with SURF, the standard SCUBA reduction software (Jenness & Lightfoot 1999), using the “Emerson 2” deconvolution algorithm. This algorithm combines the multiple chop-throw images of the map fields. A weighted average of these observations is formed in Fourier space, and the reverse transform yields the final map (Jenness & Lightfoot 1998). Although the combination of multiple chops improves the spatial frequency coverage, it is unavoidable that spatial scales more extended than a few times the maximum chop-throw are measured with reduced sensitivity, and the zero spatial frequency is still lost. Ultimately, the survey is sensitive to spatial scales in the approximate range (the beam size at ) to (a few times the maximum chop-throw).
Calibration was performed from maps of Uranus and Mars, and all data were corrected for atmospheric extinction using skydips. Zenith opacities were in the range 0.1–0.45 at and 0.33–2.5 at . Most of the data in the central region was observed in extremely good weather, with , .
To calibrate fluxes of extended structures, the integrated signal in a diameter aperture was used to calculate a conversion factor in V-1. Calibration relative to the primary calibrators is estimated to be accurate to 5% at and 20% at , based on the dispersion of measured flux conversion factors, although absolute cloud fluxes also depend on corrections for constant map offsets as described in section 2.1.
The survey has resolutions of approximately at and at , corresponding to distances of and at a distance of . The - sensitivities per beam are approximately and at and respectively, or per beam with the assumptions in section 3.5.
2.1 Corrections for artefacts
Making large-scale SCUBA scan-maps is difficult for several reasons. The total power level is not recorded, so there may be a constant offset on each field, and this offset may in general vary between fields in the mosaic. Within individual fields, one must account for baseline removal on the time-series signals from the bolometers. The dual-beam chop will suppress information at certain spatial frequencies, as described above, and as there is so much extended structure in the CMZ it is difficult to scan or chop onto regions of no emission.
Some previous SCUBA scan-maps have sometimes exhibited reduction artefacts, such as negative troughs around bright sources. We have found that negative troughs can be greatly reduced by careful baseline removal on a per-bolometer basis. A single map is contructed from typically 10–15 scans of the array across the field. Calculating a baseline separately for each scan will produce large spurious offsets for those scans which pass over bright structure, so ideally it is best to determine a baseline using only those scans which contain little bright emission. This proved impossible for a region as rich in structure as the Galactic Centre, but we have found that using the median level over all the scans for each bolometer does produce good results without the spurious offsets.
This is the largest area ever scan-mapped at 450 and , with more than fifty overlapping fields, which must be mosaiced to form the final image. The Starlink CCDPACK package (Draper, Taylor, & Allan 2000) was used to combine the dual-beam images and remove relative level offsets between fields of order 10 and at 450 and respectively. We then applied further corrections to ensure that the pixel mean calculated along the chop throw direction was zero, for all of the mosaiced dual-beam maps. This must be true, as long as the edges of the map are essentially emission-free, and is necessary because incorrect zero levels in the mosaiced dual-beam maps will translate to slopes in the final images. We finally corrected for the constant zero offset on the entire map by measuring the typical zero levels from map areas devoid of identifiable clouds, and assigning an uncertainty based on the level variations. The final uncertainty in baseline levels is and at 450 and respectively, the former being higher in part due to the greater calibration uncertainties. These uncertainties have been neglected, compared to the sensitivity noise levels of the maps.
3 Analysis
3.1 General features
Our maps (figures 1 and 2) show good correspondence with previous surveys of the region, such as that by Lis & Carlstrom (1994) but with much higher sensitivity and resolution. At we can clearly see the central source Sgr A* and its Circum-Nuclear Disc (CND) (, ), although these features are less pronounced at . We also see the compact GMCs M-0.13-0.08 (the cloud) and M-0.02-0.07 (the cloud). Close to this is the high-velocity molecular cloud CO 0.02–0.02 (Oka et al. 1999). At higher galactic longitude we see the Pistol region (, ), other GMCs such as M0.25+0.01 (Lis et al. 1994), Sgr B1 () and B2 (), and the Sgr D () star-forming region. At more negative longitudes, the map extends to the Sgr C () star forming region. All of the field is rich in extended structure, dominated by filamentary clouds and cavities which may be associated with supernova remnants. Such structures have also been observed by Oka et al. (1998) in CO (–) emission.
3.2 Sagittarius A*
At both wavelengths we have a clear detection of the Sgr A* point-source. By taking slices through the position of Sgr A* to determine and remove the local background, we estimate the flux from Sgr A* itself, with quoted 1- uncertainties. The results are also subject to the overall calibration uncertainties described in section 2. At we measure a flux of . This is consistent with the value measured from CSO-JCMT interferometry (Serabyn et al. 1997) of . At , the same procedure gives a flux for Sgr A* of . This is consistent with the upper limit of found by Dent et al. (1993). These fluxes are somewhat lower than those measured by Zylka et al. (1995), which were at (rather than ) and at , suggesting that there may be some variability of the Sgr A* point source. For example, Tsuboi, Miyazaki, & Tsutsumi (1999) observed a flare at 3mm during which the flux doubled, and Serabyn et al. (1997) found a flux of at . Our fluxes indicate a spectral index for the emission from Sgr A* of , consistent with a non-dust component in the emission. Flux values for the synchrotron component from the postulated black hole are discussed further by Aitken et al. (2000).
3.3 Greybody fitting
Although we can calculate spectral indices in the submillimetre regime from the SCUBA data, these data do not constrain the overall form of the dust emission, and do not allow us to estimate the temperature of the dust. To do this, we need data around the peak of the emission, which for dust at these temperatures is in the far infra-red.
We have combined our submillimetre data with data from the IRAS Galaxy Atlas (Cao et al. 1997), and fitted a single temperature greybody spectrum of the form , where the optical depth is expressed in terms of an index and a critical frequency at which the emission becomes optically thick: . Although the IRAS Galaxy Atlas also contains data, we believe that emission at this wavelength traces a higher temperature component. By fitting to the , , and points we calculate properties of the cold dust only.
We have performed a least-squares greybody fit to the three datasets over the survey area, fitting for temperature and critical frequency . We fixed , the theoretical maximum for crystalline dust grains. Since the resolution of the IRAS images was approximately , the SCUBA data were also smoothed to this resolution.
The fits indicate a fairly uniform dust temperature of . There are no signs of strong temperature variations correlated with individual clouds, and this is further evidence that the brightness structure in the maps is dominated by column density variations. Therefore, we adopt a typical temperature of throughout the rest of this paper.
If is allowed to vary, the fit is better but the derived temperature does not significantly change. Best-fit values of are , higher than the canonical value of . There is now much evidence for : Lis & Menten (1998) and Dowell et al. (1999) measured and respectively in GCM0.25+0.01. In other regions, Lis et al. (1998) measure values as high as in the Orion Ridge and Bernard et al. (1999) also report PRONAOS observations of high in the Polaris cirrus cloud. In laboratory work Koike et al. (1995) report up to in carbon-based compounds at room temperature, and Agladze et al. (1996) have shown in silicates between and .
3.4 Spectral index map
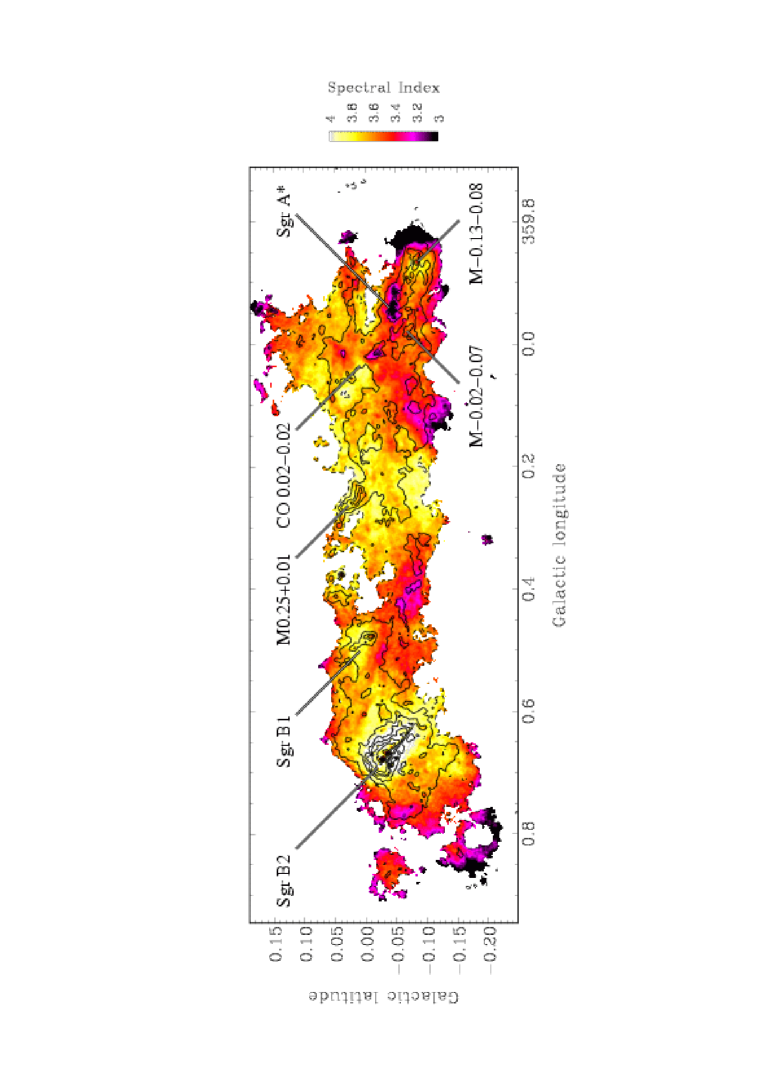
We have used our and maps to generate a map of spectral index (defined by ), which is shown in figure 3. We first smoothed the map to the lower resolution of the observations, and imposed a lower threshold on both maps of , since spectral indices derived from small flux values are subject to large errors.
Over most of the bright parts of the map is in the range 3–4, indicating rather constant dust properties with a dust opacity index . The bulk spectral index for M-0.02-0.07 (the cloud) is , whereas for M-0.13-0.08 (the cloud) it is (quoted errors are from the variation within the clouds). Assuming greybody emission at a dust temperature of , these indicate dust opacity indices of –. Although is the theoretical upper limit for crystalline dust grains, in section 3.3 we discuss some evidence for higher values of .
Differences in spectral index may be due to differences in temperature. Since at these temperatures, emission at and is not truly in the Rayleigh-Jeans part of the spectrum, the difference between the spectral index and the dust opacity index is temperature dependent. It is therefore possible that two clouds may have the same but different temperatures, leading to different spectral indices. If this were the case, a lower would indicate a cooler cloud. This cannot account for all the variations: for example, is low at only for CO 0.02-0.02, and this cloud is thought to be relatively hot at (Oka et al. 1999). In section 3.3, we detect no significant temperature variations on scales.
3.5 Cloud masses
To estimate the total cloud masses from their integrated fluxes, we require the grain absorption cross-section per unit mass of gas and dust. We have adopted the parameters suggested by Pollack et al. (1994) with opacity index , and a correction for Galactic Centre metallicity (Mezger et al. 1989). We thus derive opacities of and . Assuming a uniform dust temperature of we have for and , conversion factors of 63.3 and 513 respectively. The total mass found by the survey, measured by integrating the total brightness, is then .
The largest source of error in these mass measurements is our uncertainty of the dust temperature. The value of is derived in section 3.3, but Lis, Carlstrom, & Keene (1991) adopt a mean temperature of . However, the ISO study of GCM0.25+0.01 by Lis & Menten (1998) gives a mean temperature of for this core, suggesting that the lower dust temperatures are correct. We neglect optical depth effects as the emission is optically thin at except from Sgr B2.
4 Further discussion
The improved depth, resolution, and extent of the SCUBA survey reveal many new features in the Galactic Centre. Not only are there the known large star-forming cloud complexes but also a wide-ranging network of dusty filaments is revealed. For example, at negative Galactic longitudes close to there is filamentary structure which may be continuous and stretches along the Galactic plane for up to (). There are partial shells, possibly associated with the known SNRs Sgr A East (G0.0+0.0), G0.3+0.0, G0.9+0.1, and G1.4-0.1 (Green 1998). There is also a circular shell of dust clouds centred on which does not appear to be documented, and which we have labelled PPR G0.80-0.18. This may trace a wind-blown region or perhaps a supernova remnant. In a future paper, we will contrast these structures with star-forming regions near the Solar circle, comparing masses, densities, dust grain properties and star-forming efficiency.
The total mass detected by our survey is , in the inner . Dahmen et al. (1998) derived a weighted best estimate of the total mass in the inner of the Galactic centre using a combination of dust emission, gamma rays, and C18O molecular line emission. This estimate was –. The best optically-thin tracer in this set is the C18O survey, from which was derived a mass of in the central . Although our survey covers a smaller area, the total mass detected is significantly greater. Therefore, the SCUBA data comprise the first optically-thin map to trace essentially all the mass in the CMZ at high resolution.
References
- Agladze, Sievers, Jones, Burlitch, & Beckwith (1996) Agladze, N. I., Sievers, A. J., Jones, S. A., Burlitch, J. M., & Beckwith, S. V. W. 1996, ApJ, 462, 1026+
- Aitken, Greaves, Chrysostomou, Jenness, Holland, Hough, Pierce-Price, & Richer (2000) Aitken, D. K., Greaves, J., Chrysostomou, A., Jenness, T., Holland, W., Hough, J. H., Pierce-Price, D., & Richer, J. 2000, ApJ, 534, L173
- Bernard, Abergel, Ristorcelli, Pajot, Torre, Boulanger, Giard, Lagache, Serra, Lamarre, Puget, Lepeintre, & Cambrésy (1999) Bernard, J. P., et al. 1999, A&A, 347, 640
- Cao, Terebey, Prince, & Beichman (1997) Cao, Y., Terebey, S., Prince, T. A., & Beichman, C. A. 1997, ApJS, 111, 387+
- Dahmen, Huttemeister, Wilson, & Mauersberger (1998) Dahmen, G., Huttemeister, S., Wilson, T. L., & Mauersberger, R. 1998, A&A, 331, 959
- Dent, Matthews, Wade, & Duncan (1993) Dent, W. R. F., Matthews, H. E., Wade, R., & Duncan, W. D. 1993, ApJ, 410, 650
- Dowell, Lis, Serabyn, Gardner, Kovacs, & Yamashita (1999) Dowell, C. D., Lis, D. C., Serabyn, E., Gardner, M., Kovacs, A., & Yamashita, S. 1999, in ASP Conf. Ser. 186: The Central Parsecs of the Galaxy, 453+
- Draper, Taylor, & Allan (2000) Draper, P. W., Taylor, M., & Allan, A. 2000, Starlink User Note 139, Rutherford Appleton Laboratory
- Green (1998) Green, D. A. 1998, A Catalogue of Galactic Supernova Remnants (1998 September version) (Mullard Radio Astronomy Observatory, Cambridge, United Kingdom)
- Holland, Robson, Gear, Cunningham, Lightfoot, Jenness, Ivison, Stevens, Ade, Griffin, Duncan, Murphy, & Naylor (1999) Holland, W. S., et al. 1999, MNRAS, 303, 659
- Jenness & Lightfoot (1998) Jenness, T. & Lightfoot, J. F. 1998, in ASP Conf. Ser. 145: Astronomical Data Analysis Software and Systems VII, Vol. 7, 216+
- Jenness & Lightfoot (1999) Jenness, T. & Lightfoot, J. F. 1999, Starlink User Note 216, Rutherford Appleton Laboratory
- Koike, Kimura, Kaito, Suto, Shibai, Nagata, Tanabe, & Saito (1995) Koike, C., Kimura, S., Kaito, C., Suto, H., Shibai, H., Nagata, T., Tanabe, T., & Saito, Y. 1995, ApJ, 446, 902+
- Lis & Carlstrom (1994) Lis, D. C. & Carlstrom, J. E. 1994, ApJ, 424, 189
- Lis, Carlstrom, & Keene (1991) Lis, D. C., Carlstrom, J. E., & Keene, J. 1991, ApJ, 380, 429
- Lis & Menten (1998) Lis, D. C. & Menten, K. M. 1998, ApJ, 507, 794
- Lis, Menten, Serabyn, & Zylka (1994) Lis, D. C., Menten, K. M., Serabyn, E., & Zylka, R. 1994, ApJ, 423, L39
- Lis, Serabyn, Keene, Dowell, Benford, Phillips, Hunter, & Wang (1998) Lis, D. C., Serabyn, E., Keene, J., Dowell, C. D., Benford, D. J., Phillips, T. G., Hunter, T. R., & Wang, N. 1998, ApJ, 509, 299
- Mezger, Zylka, Salter, Wink, Chini, Kreysa, & Tuffs (1989) Mezger, P. G., Zylka, R., Salter, C. J., Wink, J. E., Chini, R., Kreysa, E., & Tuffs, R. 1989, A&A, 209, 337
- Morris & Serabyn (1996) Morris, M. & Serabyn, E. 1996, ARA&A, 34, 645
- Oka, Hasegawa, Sato, Tsuboi, & Miyazaki (1998) Oka, T., Hasegawa, T., Sato, F., Tsuboi, M., & Miyazaki, A. 1998, ApJS, 118, 455
- Oka, White, Hasegawa, Sato, Tsuboi, & Miyazaki (1999) Oka, T., White, G. J., Hasegawa, T., Sato, F., Tsuboi, M., & Miyazaki, A. 1999, ApJ, 515, 249
- Pollack, Hollenbach, Beckwith, Simonelli, Roush, & Fong (1994) Pollack, J. B., Hollenbach, D., Beckwith, S., Simonelli, D. P., Roush, T., & Fong, W. 1994, ApJ, 421, 615
- Serabyn, Carlstrom, Lay, Lis, Hunter, & Lacy (1997) Serabyn, E., Carlstrom, J., Lay, O., Lis, D. C., Hunter, T. R., & Lacy, J. H. 1997, ApJ, 490, L77
- Tsuboi, Miyazaki, & Tsutsumi (1999) Tsuboi, M., Miyazaki, A., & Tsutsumi, T. 1999, in ASP Conf. Ser. 186: The Central Parsecs of the Galaxy, 105+
- Zylka, Mezger, Ward-Thompson, Duschl, & Lesch (1995) Zylka, R., Mezger, P. G., Ward-Thompson, D., Duschl, W. J., & Lesch, H. 1995, A&A, 297, 83