GRB 000926 and its optical afterglow: Another evidence for non-isotropic emission
R. Sagar1, S. B. Pandey1, V. Mohan1, D. Bhattacharya2 and A. J. Castro-Tirado3
1U. P. State Observatory, Manora Peak, Nainital – 263 129, India
2Raman Research Institute, Bangalore – 560 080, India
3IAA-CSIC, P.O. Box 03004, E-18080, Granada, Spain
Abstract
The CCD Johnson and Cousins photometric magnitudes are determined for 20 stars in the field of GRB 000926. They are used to calibrate the present as well as published photometric magnitudes of the GRB 000926 afterglow. Optical light curves of the afterglow emission are obtained in and passbands. They show a steepening of the flux decay as expected of an anisotropic fireball losing collimation with the fall of the bulk Lorentz factor. We derive the early and late time flux decay constants as and respectively. Steepening in the flux decay seems to have started around 1.7 days after the burst. Negligible Galactic but relatively large intrinsic extinction amounting 0.03 and 0.360.02 mag respectively are derived in the direction of GRB 000926. The value of the spectral index in the X-ray–optical–near-infrared region is . The determination of the redshift indicates a cosmological origin of the burst at a luminosity distance of 16.6 Gpc. The observed fluence in the energy range 20–100 keV indicates, if isotropic, the release of ergs of energy. Attributing the observed break in the light curve at 1.7 days to the onset of sideways expansion of a jet-like ejecta, we infer an initial jet opening angle of 0.14 radian. This indicates a large anisotropy in the original emission and the amount of released energy is reduced by a factor of 100 relative to the isotropic value, which can be understood in terms of the currently popular stellar death models.
Keywords: Photometry – GRB afterglow – flux decay – spectral index
1 Introduction
Multiwavelength follow-up of Gamma-Ray Burst (GRB) afterglows has revolutionized GRB astronomy in recent years, yielding a wealth of information about the nature and origin of GRBs (cf. Klose 2000; Kulkarni et al. 2000; Galama 2000; Castro-Tirado et al. 1999 and references therein). One of the most important clues to the origin of GRBs is the total amount of energy released in the event. Optical observations have helped to derive this important quantity in a number of cases by setting the distance scale through measurement of redshift, and by determining the degree of collimation of the initial emission through detailed study of the afterglow light curve. Clear evidence of the steepening of the light curve, signature of an originally collimated outflow expanding laterally, has been found within a few days of the GRB event in several afterglows (Castro-Tirado et al 1999; Kulkarni et al 1999; Stanek et al. 1999; Halpern et al. 2000c; Sagar et al. 2000b)
As a part of an international collaborative programme coordinated by one of us (AJCT), the Uttar Pradesh State Observatory (UPSO), Naini Tal has been involved in a regular programme of GRB follow-up since January 1999. So far successful photometric observations of five afterglows have been carried out at UPSO. The results of four of these have been reported earlier (Sagar et al. 1999, 2000a, 2000b). In this paper we report the studies made on the fifth, namely, GRB 000926.
GRB 000926 was detected on 2000 September 26 at 23:49:33 UT by the Inter-Planetary Network (IPN) group of spacecrafts Ulysses, Russian Gamma-Ray Burst Experiment (KONUS) and Near Earth Asteroid Rendezvous (NEAR) (Hurley et al. 2000). The burst had a 25–100 keV fluence of erg cm-2. The total duration of the GRB is s, putting it in the class of “long-duration” bursts, to which all GRBs with detected afterglows so far belong (cf. Lamb 2000).
Optical observations taken on 2000 September 27 by Gorosabel et al. (2000) and Dall et al. (2000) detected independently a new bright point like source at with a strong candidacy for the afterglow from GRB 000926. At the same location, Frail & Berger (2000) detected a new radio source with VLA at 8.46 GHz and 4.86 GHz. Coincident (within errors) with the location of optical and radio afterglows, Piro & Antonelli (2000) and Garmire et al. (2000) detected the X-ray afterglow of GRB 000926. The near-IR detection of the afterglow has been reported by Di Paola et al. (2000), while observations in passband by Kobayashi et al. (2000) clearly detect the Optical Transient (OT).
The high resolution optical spectrum of the OT of GRB 000926 taken on 2000 September 29.26 UT (cf. Castro et al. 2000) indicate a redshift value of . This is a refinement of reported earlier by Fynbo et al. (2000c) using the low resolution optical spectrum taken on 2000 September 27.91 UT. Fynbo et al. (2000d, e) report the detection of the host galaxy with an R magnitude of .
In order to provide accurate photometric magnitudes of the OT, we also imaged the field of GRB 000926 along with SA 110 region of Landolt (1992). A total of 20 stars in the field have been calibrated and their standard magnitudes are given here. We present the details of our optical observations in the next section, and discuss the light curves and other results in the remaining sections.
Recently Price et al (2000b) have presented an independent series of observations in multiple optical/IR bands. The results obtained by them are consistent with those presented here.
2 Optical observations, data reduction and calibrations
The optical observations of the GRB 000926 afterglow were carried out on 2000 September 29. We used a 2048 2048 pixel2 CCD system attached at the f/13 Cassegrain focus of the 104-cm Sampurnanand telescope of UPSO, Nainital. One pixel of the CCD chip corresponds to 0.38, and the entire chip covers a field of on the sky. The CCD observations of the GRB 000926 field along with Landolt (1992) SA 110 region have also been carried out on 27th October 2000 for calibration purposes during photometric sky conditions. The log of CCD observations is given in Table 1. In addition to these observations, several twilight flat field and bias frames were also observed.
Table 1. Log of CCD observations of GRB 000926 and SA 110 Landoldt (1992) standard fields.
| Date | Field | Filter | Exposure (in seconds) |
|---|---|---|---|
| 29/30 Sep 2000 | GRB 000926 | 6003 | |
| 27/28 Oct 2000 | GRB 000926 | 3003 | |
| 27/28 Oct 2000 | GRB 000926 | 2003 | |
| 27/28 Oct 2000 | GRB 000926 | 1503 | |
| 27/28 Oct 2000 | GRB 000926 | 1503 | |
| 27/28 Oct 2000 | SA 110 | 1504 | |
| 27/28 Oct 2000 | SA 110 | 1004 | |
| 27/28 Oct 2000 | SA 110 | 305 | |
| 27/28 Oct 2000 | SA 110 | 305 |
The CCD frames were cleaned using standard procedures. Image processing was done using ESO MIDAS and DAOPHOT softwares. Atmospheric extinction coefficients were determined from the observations of the brightest star present in the SA 110 field and these are used in further analysis. Standard magnitudes of 8 stars in the field of SA 110 were taken from Landoldt (1992). They cover a wide range in colour () as well as in brightness (). The transformation coefficients were determined by fitting least square linear regressions to the standard photometric indices as function of the observed instrumental magnitudes normalised for 1 second exposure time. The following colour equations were obtained for the system.
where and
represent the instrumental colour indices corrected for atmospheric extinction.
The errors in the colour coefficients and zero points are obtained
from the deviation of data points from the linear relation.
For increasing the photometric precision of fainter stars, the data are binned in pixel2 and also all the CCD images of GRB 000926 field taken on a day are co-added in the same filter. From these added images, profile-fitting magnitudes are determined using DAOPHOT software. The standard magnitudes of the stars are determined using the above transformations. The magnitude of the OT of GRB 000926 determined in this way is at 2000 September 29.617 UT. photometric magnitudes of 20 stars in the GRB 000926 field are listed in Table 2. The present and magnitudes of star 19 (comparison star) agree within errors with an independent determination by Halpern et al. (2000a) indicating that present photometric calibration is secure. Fig. 1 shows the location of the GRB 000926 afterglow and the photometered stars on the CCD image taken from UPSO, Nainital.
The above photometrically calibrated magnitudes have also been used for calibrating other photometric measurements of GRB 000926 afterglow published in the GCN circular by Fynbo et al. (2000a, b, d), Halpern et al. (2000a, b), Hjorth et al. (2000a, b), Price et al. (2000a), Rol et al. (2000), Veillet (2000) and Vrba & Canzian (2000) by the time of paper submission. In order to avoid errors arising due to different photometric calibrations, we have used only those published photometric measurements whose magnitudes could be determined relative to the stars given in Table 2. For converting the Sloan measurements given by Rol et al. (2000) into Cousins system we also used the calibrations given by Fukugita et al. (1995). The magnitude is adopted from Di Paola et al. (2000). A total of 53 photometric data points in five passbands with the distribution of points: are there for our analysis.
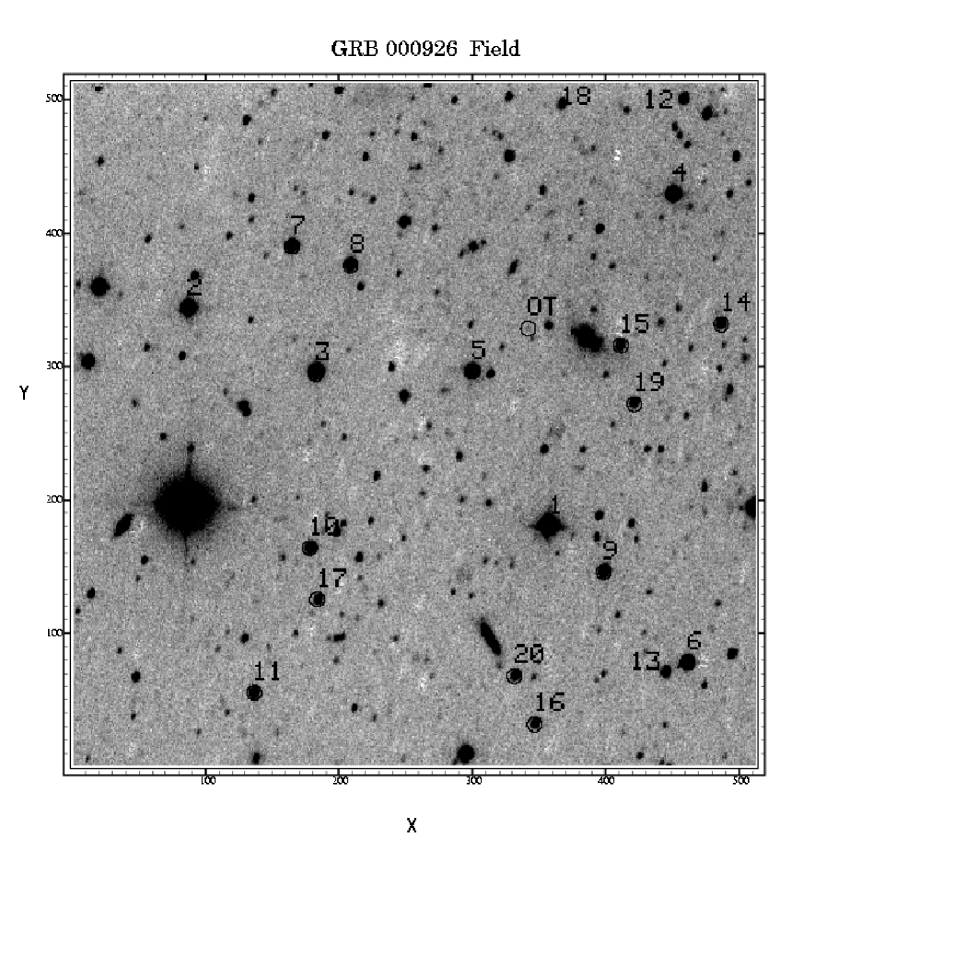
Table 2. The identification number(ID), Right Ascension () and Declination () for epoch 2000 of the stars in the region of GRB 000926 are taken from the catalogue of Monet (1997). Standard and photometric magnitudes and their associated DAOPHOT errors () of the stars are also given. These errors are primarily related to signal to noise ratio and do not include the errors related to colour transformations and magnitude zero points. Star 19 is the comparison star mentioned by Halpern et al. (2000a).
| ID | ||||||||||
|---|---|---|---|---|---|---|---|---|---|---|
| 1 | 13.58 | 0.01 | 0.83 | 0.01 | 0.54 | 0.01 | 0.88 | 0.01 | ||
| 2 | 17 4 36.19 | 51 47 15.0 | 14.41 | 0.01 | 0.56 | 0.01 | 0.42 | 0.01 | 0.67 | 0.01 |
| 3 | 17 4 26.06 | 51 46 33.5 | 14.64 | 0.01 | 0.63 | 0.01 | 0.46 | 0.01 | 0.74 | 0.01 |
| 4 | 17 3 58.86 | 51 48 52.1 | 14.82 | 0.01 | 0.62 | 0.01 | 0.44 | 0.01 | 0.72 | 0.01 |
| 5 | 17 4 13.96 | 51 46 35.9 | 15.31 | 0.01 | 1.08 | 0.01 | 0.71 | 0.01 | 1.23 | 0.01 |
| 6 | 17 3 56.25 | 51 43 13.7 | 15.50 | 0.01 | 0.73 | 0.02 | 0.45 | 0.02 | 0.75 | 0.02 |
| 7 | 17 4 28.41 | 51 48 02.4 | 15.55 | 0.01 | 0.65 | 0.01 | 0.45 | 0.01 | 0.75 | 0.01 |
| 8 | 17 4 23.81 | 51 47 50.9 | 15.70 | 0.01 | 0.45 | 0.01 | 0.35 | 0.01 | 0.60 | 0.01 |
| 9 | 17 4 03.04 | 51 44 17.4 | 15.79 | 0.01 | 0.57 | 0.01 | 0.42 | 0.01 | 0.71 | 0.01 |
| 10 | 17 4 25.93 | 51 44 25.6 | 16.29 | 0.01 | 0.74 | 0.01 | 0.41 | 0.02 | 0.75 | 0.02 |
| 11 | 17 4 29.79 | 51 42 39.2 | 16.72 | 0.01 | 0.87 | 0.02 | 0.50 | 0.02 | 0.87 | 0.02 |
| 12 | 17 3 58.40 | 51 50 00.6 | 16.83 | 0.01 | 0.68 | 0.02 | 0.42 | 0.02 | 0.79 | 0.02 |
| 13 | 17 3 57.87 | 51 43 06.6 | 16.93 | 0.02 | 0.68 | 0.02 | 0.36 | 0.02 | 0.65 | 0.02 |
| 14 | 17 3 54.77 | 51 47 20.2 | 17.16 | 0.01 | 0.67 | 0.02 | 0.39 | 0.01 | 0.70 | 0.01 |
| 15 | 17 4 02.50 | 51 47 01.7 | 17.54 | 0.01 | 1.09 | 0.02 | 0.66 | 0.02 | 1.15 | 0.02 |
| 16 | 17 4 07.82 | 51 42 25.7 | 17.58 | 0.01 | 0.56 | 0.02 | 0.32 | 0.02 | 0.59 | 0.02 |
| 17 | 17 4 25.11 | 51 43 48.4 | 17.62 | 0.01 | 0.85 | 0.02 | 0.47 | 0.02 | 0.85 | 0.02 |
| 18 | 17 4 07.93 | 51 49 53.2 | 17.62 | 0.01 | 0.77 | 0.02 | 0.45 | 0.02 | 0.79 | 0.02 |
| 19 | 17 4 01.21 | 51 46 19.9 | 17.63 | 0.01 | 0.86 | 0.02 | 0.54 | 0.01 | 0.94 | 0.02 |
| 20 | 17 4 09.58 | 51 42 59.9 | 17.73 | 0.01 | 1.08 | 0.02 | 0.62 | 0.01 | 1.11 | 0.02 |
3 Optical photometric light curves
We have used the data published in GCN circulars in combination with the present measurements to study the optical flux decay of GRB 000926 afterglow. Fig. 2 shows a plot of the photometric measurements as a function of time. The X-axis is log () where is the time of observation and (= 2000 September 26.9927 UT) is the time of GRB trigger. All times are measured in unit of day.

The emission from GRB 000926 OT is fading in both and passbands. The flux decay of most of the earlier GRB afterglows, barring a few, is generally well characterized by a single power law , where is the flux of the afterglow at time and is the decay constant. In contrast, the optical light curves of GRB 000926 (Fig. 2) can not be fitted by a single power-law. Overall the OT flux decay seems to be described by a broken power-law as expected in GRB afterglows having jet-like relativistic ejecta (Sari et al. 1999; Rhoads 1999). Broken power-law in these light curves can be empirically fitted by functions of the form (see Sagar et al. 2000b for details)
,
where is the constant flux from the underlying host galaxy, and are asymptotic power-law slopes at early and late times with . The parameter controls the sharpness of the break, a larger implying a sharper break. With , this function becomes the same as that used by Stanek et al. (1999) to fit the optical light curve of GRB 990510 afterglow. is the flux of afterglow at the cross-over time . The function describes a light curve falling as at and at . In jet models, an achromatic break in the light curve is expected when the jet makes the transition to sideways expansion after the relativistic Lorentz factor drops below the inverse of the opening angle of the initial beam. Slightly later, the jet begins a lateral expansion which causes a further steepening of the light curve.
We use the observations in and to determine the parameters of the jet model using the above function. We find that the minimum value of is achieved for . This indicates that the observed break in the light curve is sharp, unlike the smooth break observed in the optical light curve of GRB 990510 (cf. Stanek et al. 1999; Harrison et al. 1999) but similar to the sharp break observed in the optical and near-IR light curves of GRB 000301C (cf. Sagar et al. 2000b). In order to avoid a fairly wide range of model parameters for a comparable due to degeneracy between and (magnitudes corresponding to and respectively), , and , we have used a fixed value of in our further analyses. The least square fit values of the parameters , , , and then work out to be 1.740.11 d, 21.270.15, 1.450.06 and 2.570.10 respectively in band, with a corresponding of 0.93 per degree of freedom (). The fit yields the host galaxy contribution to be =24.410.25 in . This is slightly fainter than the value 23.9 estimated by Fynbo et al. (2000e) from deep CCD imaging, but brighter than =25.190.17 derived from HST measurements (Price et al 2000b). The main reason for the discrepancy with the HST estimate is possibly the restriction of the HST photometry to within a 1.5 arcsec aperture, while no such cutoff has been applied to the photometric data used here. The derived values of the above parameters do not change significantly with larger adopted values of , although a marginal decrease in is noticed in doing so.
In band the available data is sparse, and a fit with fixed and d yields =1.550.11, =2.720.48 and =24.71.0. Note the poor constraint on and B-magnitude of the host galaxy, because of the scarcity of measurements in the late light curve. One can improve the constraints on the decay indices somewhat by assuming a colour index for the host galaxy, and thereby fixing its B magnitude from the R magnitude determined above. The restricted aperture HST photometry reported by Price et al (2000b) indicate a colour index of 1.040.53 for the host galaxy. Fixing the value of at 25.5 using this mean colour index, the fit yields =1.530.11 and =2.520.12. On the other hand, if the host galaxy has a flat spectral distribution similar to that for GRB 990123 (Castro-Tirado et al. 1999), then colour will be (which is allowed within the errors of the HST measurements and our light curve fits), and will be 24.9. If we use this value for , then the best fit values of the decay constants become = 1.540.10 and = 2.640.12. We can therefore say with confidence that within the range of host galaxy colours allowed by the light curves and the HST measurements, the decay indices in and bands are consistent with each other, and that the break in the light curve displays the achromaticity expected in the case of a lateral expansion of collimated ejecta.
The best fit light curves for the and the bands, with an assumed host galaxy colour index of =1.04, are displayed in Fig. 2. The decay parameters derived here are consistent with those obtained by Price et al (2000b) from their measurements.
3.1 Spectral index of the GRB 000926 afterglow
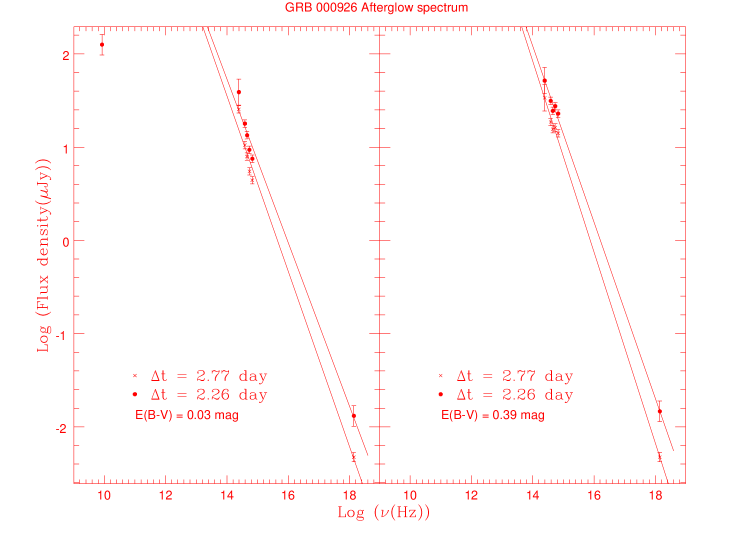
We have constructed the GRB 000926 afterglow spectrum on 2000 September 29.25 UT and 29.76 UT using the available optical, near-IR, radio and X-ray observations. These epochs were selected for the long wavelength coverage possible at the time of observations of X-ray flux by Piro & Antonelli (2000) and Garmire et al. (2000). Optical fluxes at the wavelengths of and passbands have been derived using the slope of the fitted light curve shown in Fig. 2 for the epochs under consideration. The fluxes for the desired epoch at 8.46 GHz and wavelength are taken from Frail & Berger (2000) and Di Paola et al. (2000) respectively assuming that the flux decay is similar to optical one. We used the reddening map provided by Schlegel, Finkbeiner & Davis (1998) for estimating Galactic interstellar extinction towards the burst and found a small value of mag. We used the standard Galactic extinction reddening curve given by Mathis (1990) in converting apparent magnitudes into fluxes and used the effective wavelengths and normalisations by Fukugita et al. (1995) for and and by Bessell & Brett (1988) for . The fluxes thus derived are accurate to 10% in optical and 30% in . Fig. 3 shows the spectrum of GRB 000926 afterglow from X-ray to radio region. It is observed that as the frequency decreases the flux increases from X-ray to radio wavelengths. For a chosen frequency interval, we describe the spectrum by a single power law: , where is the flux at frequency and is the spectral index. In the X-ray to optical region at = 2.26 day, the value of is 0.02, while in the X-ray to region, the value is 0.04. At = 2.77 day the value of is 0.04 for X-ray to region. These values agree very well with the spectral slopes derived for the X-ray spectrum of the GRB 000926 afterglow by Piro & Antonelli (2000) and Garmire et al. (2000). During = 1 to 4 days, the values of and are almost the same indicating no change in the optical spectral index before and after the time . However, the values of in optical ( and derived at and 3.9 day respectively) and in optical to region ( at day) are much steeper than those derived for the broadband (X-ray to optical) spectrum. This may indicate presence of intrinsic extinction in the GRB 000926 afterglow. The amount of intrinsic extinction is determined in the following way assuming that the OT spectrum follows a single spectral slope from X-ray to near-IR. The observed flux at X-ray and wavelengths are used to determine as the extinction affects them least. This slope predicts the fluxes of GRB 000926 OT at wavelengths. The differences between these predicted and the corresponding Galactic extinction corrected observed fluxes are used to evaluate the intrinsic extinction. From these values, intrinsic extinction at is determined assuming that it follows the Galactic extinction law given by Mathis (1990). The extinction corrected flux at and the observed X-ray flux are used to derive modified value of . This procedure is iterated till self consistent values of intrinsic extinction at and wavelengths are obtained. This yields mag and as the values for the intrinsic extinction. These are in agreement with the values determined independently by Price et al (2000b) from their optical data. The observed fluxes corrected for both Galactic and intrinsic extinction are also shown in Fig. 3. The values of derived from them are and at 2.26 and 2.77 days respectively.
In the light of above, we conclude that the value of is in X-ray to near-IR spectral region and it has not changed before and after during 1 to 4 days.
Fig. 3 indicates that the peak frequency appears to lie in the millimeter region. This peak frequency is thus similar to that of GRB 970508 (cf. Galama et al. 1998) and GRB 000301C (cf. Sagar et al. 2000b) but different from that of GRB 990123 (Galama et al. 1999) where the peak is in radio region and that of GRB 971214 for which the peak is in optical/near-IR waveband (Ramaprakash et al. 1998). From this, one may infer that the synchrotron peak frequency may span a large range in GRB afterglows.
4 Comparison with the Fireball model
The afterglow of a GRB is thought to be synchrotron radiation from a relativistic shock driven into the circumburst environment. In this model, the light curves and spectral energy distributions are generally well fit by the power-law for a range of frequencies and times that contain no spectral breaks. The decay slope is dependent on the dynamics of the fireball, and the spectral slope on the importance of cooling, but within each regime and are functions only of , the power-law exponent of the electron Lorentz factor. This provides a verifiable relation between the two observable quantities and , and a way to infer the fireball dynamics.
There is recent evidence that the fireball in at least some GRBs are not spherical but are collimated, like jets, into a small solid angle. In such cases, theoretical models predict a break and a marked steepening in the afterglow light curve (Mészáros & Rees 1999; Rhoads 1999; Sari et al. 1999, Huang 2000). The time of occurrence of this break in the afterglow light curve depends upon the opening angle of the collimated outflow. Observational evidence for a break was found first in the optical light curve of GRB 990123 afterglow (Castro-Tirado et al. 1999; Kulkarni et al. 1999) and recently in that of GRB 990510 (Stanek et al. 1999), GRB 990705 (Masetti et al. 2000), GRB 991216 (Halpern et al. 2000c) and GRB 000301C (Sagar et al. 2000b) afterglows. At late times, when the evolution is dominated by the lateral spreading of the jet, the value of is expected to approach the electron energy distribution index while the value of is expected to be if the cooling frequency is below the observing frequency and otherwise (Sari et al. 1999). The expected values of and at late times are thus in agreement with the corresponding observed values of and for GRB 000926 indicating that the afterglow emission from GRB 000926 is of jet type and not spherical, and that the cooling frequency is above the range of observed frequencies. The slope of the light curve before the break is then expected to be (Sari et al. 1998), which is also consistent with the value derived by us. However, a much steeper late decay of X-ray flux with 1 and 5, while the spectral index is the same (), as reported by Piro & Antonelli (2000) and Garmire et al. (2000) respectively is not consistent with the simple jet model which predicts similar late flux decay in both optical and X-ray regions. It is possible that the geometry of the region emitting X-rays after the lateral spreading starts differs from that emitting at longer wavelengths, thus giving rise to apparent difference in the behaviour of the light curve.
Another area of possible disagreement with the standard fireball model is the sharpness of the break in the light curve. While the expected sharpness of the transition could depend on the density profile of the ambient medium (Kumar and Panaitescu 2000), the very sharp transitions seen in GRB 000301C and GRB 000926 would be difficult to quantitatively explain in the standard fireball model. This is an area that deserves a detailed theoretical study.
The anisotropy of the initial ejection needs to be incorporated into the derived energetics of the burst. The redshift determined for the GRB 000926 afterglow by Castro et al. (2000) yields a minimum luminosity distance of 16.6 Gpc for standard Friedmann cosmology with Hubble constant = 65 km/s/Mpc, cosmological density parameter = 0.2 and cosmological constant = 0 (if then the inferred distance would increase). The GRB 000926 thus becomes the second farthest GRB after GRB 971214 (Kulkarni et al. 1998) amongst the GRBs with known redshift measurements so far. If the original emission were isotropic, the observed fluence of erg/cm2 (Hurley et al. 2000) between 25–100 keV, would yield the total ray energy release to be at least erg (). However, the estimated of 1.74 day implies, using the expression in Sari, Piran and Halpern (1999), a jet opening angle of radian, where is the number density of the ambient medium. This means that the actual energy released from the GRB 000926 is reduced by a factor of relative to the isotropic value and becomes ergs.
Of the over dozen GRBs with known redshifts, seven with inferred energy budget of erg (assuming isotropic emission) are GRB 000926 (discussed here); GRB 000301C (Sagar et al. 2000b); GRB 991216 and GRB 991208 (Sagar et al. 2000a); GRB 990510 (Harrison et al. 1999); GRB 990123 (Andersen et al. 1999; Galama et al. 1999) and GRB 971214 (Kulkarni et al. 1998). Recent observations suggest that GRBs are associated with stellar deaths, and not with quasars or the nuclei of galaxies as some GRBs are found offset by a median value of 3.1 kpc from the centre of their host galaxy (cf. Bloom et al. 2000). However, release of energies as large as erg or more in radiation is extremely difficult to accommodate within the popular stellar death models (coalescence of neutron stars or the death of massive stars). However, evidence is now mounting in favour of non-isotropic emission, with GRB 000926 the sixth known case after GRB 990123 (cf. Castro-Tirado et al. 1999; Kulkarni et al. 1999), GRB 990510 (cf. Harrison et al. 1999, Stanek et al. 1999), GRB 990705 (cf. Masetti et al. 2000), GRB 991216 (cf. Halpern et al. 2000c, Sagar et al. 2000a) and GRB 000301C (cf. Sagar et al. 2000b).
Thus, it is possible that all cases where the inferred isotropic equivalent energy is large, the emission actually is confined within narrow jets, with total energy much below the isotropic equivalent. The ray energy released then becomes erg, a value within the reach of the currently popular models for the origin of GRBs (see Piran 1999 and references therein).
The intrinsic visual extinction ( mag) derived for the optical afterglow also carries a possible clue to the class of progenitor objects. Extinction of comparable magnitude have been noticed also in GRB 971214 ( mag, Ramaprakash et al. 1998 and refernces therein); GRB 980329 ( mag, Palazzi et al. 1998); GRB 980703 ( mag, Vreeswijk et al. 1999) and GRB 000418 ( mag, Klose et al. 2000). The presence of dust extinction in the host galaxies broadly supports the proposal that GRBs could be associated with massive stars embedded in star-forming regions of the GRB host galaxies (Paczyński 1998).
5 Conclusions
We have determined magnitudes of 20 stars in the field of GRB 000926. These magnitudes are used to calibrate present photometric magnitudes of the OT of GRB 000926 as well as those given in GCN circulars using differential photometric techniques. The light curves show a steepening which could be well understood in terms of a jet model. The parameters of the jet are derived by performing a non-linear least square fit of a broken power-law model to the light curves. The flux decay constants at early and late times are 1.450.05 and 2.60.1 respectively, and the break occurs at 1.740.11 day. The break is sharp and similar to that in GRB 000301C (cf. Sagar et al. 2000b).
The quasi-simultaneous spectral energy distributions determined for various epochs indicate that the spectral index of the GRB 000926 afterglow has not changed significantly during this period. A steepening of the flux decay with no corresponding change in spectral index is expected of a jet evolution.
The determined redshift yields a minimum distance of 16.6 Gpc to GRB 000926, and the observed fluence yields an isotropic equivalent energy release of erg. However, the break in the light curve at 1.74 days translate to a collimated emission with an opening angle of radian, reducing the estimated energy release to erg.
The late time flux decays at X-ray and optical wavelengths seem to be significantly different for GRB 000926 afterglow. Similarly, the flux decays of GRB 991216 afterglow (cf. Frail et al. 2000) are also different at X-ray, optical and radio wavelengths. The multi-wavelength observations of recent GRB afterglows have thus started revealing features which require explanations other than generally accepted so far indicating that there may be yet new surprises in GRB afterglows.
Acknowledgements: This research has made use of data obtained through the High Energy Astrophysics Science Archive Research Center Online Service, provided by the NASA/Goddard Space Flight Center.
References:
-
Andersen M. I. et al., 1999, Science, 283, 2075
-
Bessell M.S., Brett J.M., 1988, PASP, 100, 1134
-
Bloom J.S., Kulkarni S.R., Djorgovski S.G., 2000, astro-ph/0010176
-
Castro S.M. et al., 2000, GCN Observational Report No. 851
-
Castro-Tirado A. J. et al., 1999, Science, 283, 2069
-
Dall T. et al., 2000, GCN Observational Report No. 804
-
Di Paola A. et al., 2000, GCN Observational Report No. 816
-
Frail D.A., Berger E., 2000, GCN Observational Report No. 805
-
Frail D.A. et al., 2000, ApJ, 538, L129/astro-ph/0003138
-
Fynbo J.P.U. et al., 2000a, GCN Observational Report No. 820
-
Fynbo J.P.U. et al., 2000b, GCN Observational Report No. 825
-
Fynbo J.P.U. et al., 2000c, GCN Observational Report No. 807
-
Fynbo J.P.U. et al., 2000d, GCN Observational Report No. 840
-
Fynbo J.P.U. et al., 2000e, GCN Observational Report No. 871
-
Fukugita M., Shimasaku K., Ichikawa T., 1995, PASP, 107, 945
-
Galama T.J., 2000, to appear in Proc. of the 5th Huntsville Gamma-Ray Burst Symposium/astro-ph/0001465
-
Galama T.J. et al., 1998, ApJ, 500, L97
-
Galama T.J. et al., 1999, Nature, 398, 394
-
Garmire G., Garmire A., Piro L., Garcia M.R., 2000, GCN Observational Report No. 836
-
Gorosabel J. et al., 2000, GCN Observational Report No. 803
-
Halpern J.P. et al., 2000a, GCN Observational Report No. 824
-
Halpern J.P. et al., 2000b, GCN Observational Report No. 829
-
Halpern J.P. et al., 2000c, ApJ, 543, 697
-
Harisson F.A. et al., 1999, ApJ, 523, L121
-
Hjorth J. et al., 2000a, GCN Observational Report No. 809
-
Hjorth J. et al., 2000b, GCN Observational Report No. 814
-
Huang Y.F., Dai Z.G., Lu T., 2000, MNRAS, 316, 943
-
Hurley K., Mazets E., Golenetskii S., 2000, GCN Observational Report No. 801, 802
-
Klose S., 2000, Rev. Modern Phys. 13, 129
-
Klose S. et al, 2000, ApJ, 545, 271
-
Kobayashi N. et al., 2000, GCN Observational Report No. 821
-
Kulkarni S.R. et al., 1998, Nature, 393, 35
-
Kulkarni S.R. et al., 1999, Nature, 398, 389
-
Kulkarni S.R. et al., 2000, to appear in Proc. of the 5th Huntsville Gamma-Ray Burst Symposium/astro-ph/0002168
-
Kumar P., Panaitescu A., 2000, ApJ, 541, L9
-
Lamb, D.Q., 2000, astro-ph/0005028
-
Landolt, A.R., 1992, AJ, 104, 340
-
Masetti N. et al., 2000, A&A, 354, 473
-
Mathis J.S., 1990, ARAA, 28, 37
-
Mészáros P., Rees M. J., 1999, MNRAS, 306, L39
-
Monet D., 1997, The PMM USNO-A1.0 catalogue
-
Paczyński B., 1998, ApJ, 494, L45
-
Palazzi E. et al., 1998, A&A, 336, L95
-
Piran T., 1999, Physics Reports 314, 575
-
Piro L., Antonelli L.A., 2000, GCN Observational Report No. 832, 833
-
Price P.A. et al., 2000a, GCN Observational Report No. 811
-
Price P.A. et al., 2000b, Submitted to ApJ Letters,/astro-ph/0012303
-
Ramaprakash, A.N. et al., 1998, Nature, 393, 43
-
Rhoads J.E., 1999, ApJ, 525, 737
-
Rol E., Vreeswijk P.M., Tanvir N., 2000, GCN Observational Report No. 850
-
Sagar R., Pandey A.K, Mohan V., Yadav R.K.S., Nilakshi, Bhattacharya D., Castro-Tirado A.J., 1999, BASI, 27, 3/astro-ph/9902196
-
Sagar R., Mohan V., Pandey A.K., Pandey S.B., Castro-Tirado A.J., 2000a, BASI, 28, 15/astro-ph/0003257
-
Sagar R., Mohan V., Pandey S.B., Pandey A.K., Stalin C.S., Castro-Tirado A.J., 2000b, BASI, 28, 499/astro-ph/0004223
-
Sari R., Piran T., Halpern J. P., 1999, ApJ, 519, L17
-
Sari R., Piran T., Narayan R., 1998, ApJ, 497, L17
-
Schlegel D.J., Finkbeiner D.P., Davis M., 1998, ApJ, 500, 525
-
Stanek K. Z. et al., 1999, ApJ 522, L39
-
Veillet C., 2000, GCN Observational Report No. 831
-
Vrba F., Canzian B., 2000, GCN Observational Report No. 819
-
Vreeswijk P.M. et al., 1999, ApJ, 523, 171