Abstract
We investigate spatial distributions of specific dust components in the circumstellar shells of a proto-planetary nebula candidate, \inxHD 179821, and a planetary nebula, \inxBD30∘3639, by means of spectral imaging. With high-resolution ground-based images and ISO spectra in the mid-infrared, we can derive “dust feature only” maps by subtracting synthesized continuum maps from the observed images at the feature wavelength. Such spatially detailed information will help to develop models for the evolution of dust grains around evolved stars.
[Spatial Distributions of Multiple Dust Components
in the PPN/PN Dust Shells]Spatial Distributions of
Multiple Dust Components
in the PPN/PN Dust Shells
Multiple Dust Components in the PPN/PN Dust Shells
1 Introduction
With ISO discoveries of a wealth of infrared (IR) emission features from evolved stars (e.g., Waters et al. 1996; Waters et al. 1998) and laboratory measurements of IR spectra for candidate dust species (Speck 1998 for a compilation of references), we are now able to identify individual circumstellar dust components.
Using such detailed information to interpret high-resolution ground-based mid-IR images we can spatially separate dust emission due to different species by means of spectral imaging. This can be done by (1) identify an emission feature and nearby continuum bands, (2) construct a color temperature map from the continuum images, (3) synthesize a continuum image at the feature wavelength from the temperature map taking into account diffraction effects, and (4) subtract the synthesized continuum-only map from the observed feature band image.
2 Dust Feature Map Construction
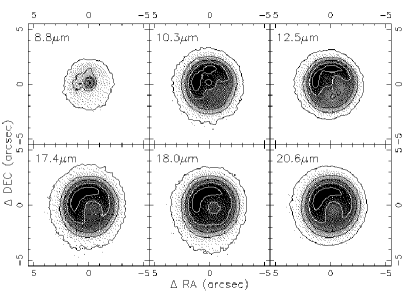
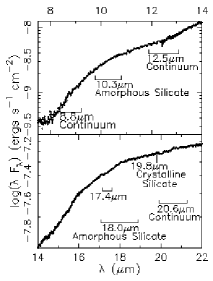
Fig. 1 shows mid-IR images and spectra of an oxygen-rich proto-planetary nebula candidate, \inxHD 179821 (\inxIRAS 19114+0002, \inxAFGL 2343). The images indicate the presence of a dust torus surrounding the central star, and the spectra reveal both amorphous and crystalline silicate features (Waters et al. 1996). We can isolate dust emission at 10.3 and m by subtracting continuum emission maps synthesized using 8.8, 12.5, and m band images as reference continuum.
BD30∘3639 (\inxIRAS 193273024) is a carbon-rich planetary nebula, in which crystalline silicates have been detected (Waters et al. 1998). Mid-IR images (Fig. 2) show a box-like elongation which is also seen in optical emission line images (e.g., Harrington et al. 1997).
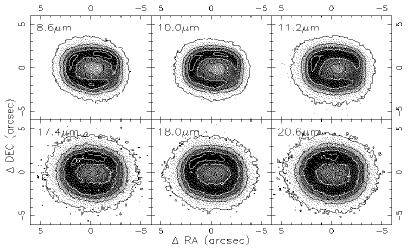
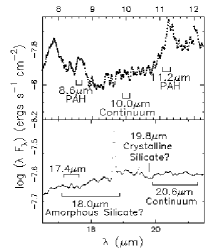
While polyaromatic hydrocarbon (PAH; e.g., Allamandola et al. 1999) emission at 8.6 and m can be isolated by using 10 and m continuum band images (Fig. 4), we were unable to isolate crystalline silicate at m because of the weak feature and apparent lack of clean continuum around m.
3 Results and Implications
![[Uncaptioned image]](/html/astro-ph/0010208/assets/x5.png)
![[Uncaptioned image]](/html/astro-ph/0010208/assets/x6.png) \dblcaption
\dblcaption
Continuum/feature only images at 10.3 and m for \inxHD 179821. Continuum/feature only images at 8.6 and m for \inxBD30∘3639.
Fig. 3 shows that the 10.3 and 18.0m bands have different spatial distributions, indicating that these emissions are due to different carrier species. We thus need to find a dust species with an emission feature at 18m but not at 10.3m (i.e., not silicates). Magnesium iron oxides are such species as shown in the spectrum (Henning et al. 1995).
![[Uncaptioned image]](/html/astro-ph/0010208/assets/x7.png)
PAH emissions at 8.6 and 11.2m show
drastically different spatial distributions
in Fig. 4, implying
that these PAH bands may have been
originated differently
(e.g., Beintema et al. 1996, Molster et al. 1996).
The 8.6m feature
slightly compact
ionized PAHs
in-plane C-H mode
The 11.2m feature
slightly extended
neutral PAHs
out-of-plane C-H mode
Observation of the differences listed above suggests that the difference between the two bands may arise from the availability of hydrogen, either in the form of an atom or an out-of-plane C-H stretch. The former implies the difference in the ionization state of PAHs (i.e., the 8.6m emission is from the ionized shell and the 11.2m emission is from the photo dissociation region), while the latter suggests different structure of PAHs (i.e., the 8.6m emission is from PAH clusters and the m emission is from chain- or sheet-like PAHs).
Careful selection/tailoring of filters will make spectral imaging more effective. Determining the spatial distribution of specific dust species will allow the development of models for the evolution of dust around evolved stars. Understanding dust evolution benefits other aspects of the physics involved such as grain nucleation and growth, the chemical evolution of the stellar atmospheres, and the nucleosynthesis of stars.
References
- [1] Allamandola et al. 1999, ApJ, 511, L115
- [2] Beintema, et al. 1996, A&A, 315, L369
- [3] Harrington et al. 1997, AJ, 113, 2147
- [4] Henning et al. 1995, A&AS, 112, 143
- [5] Molster et al. 1996, A&A, 315, L373
- [6] Speck, A.K. 1998, Ph.D Thesis, UCL
- [7] Waters et al. 1996, A&A, 315, L361
- [8] Waters et al. 1998, A&A, 331, L61