Constraints on Galaxy Bias, Matter Density, and Primordial Non–Gausianity from the PSC Galaxy Redshift Survey
Abstract
We compute the bispectrum for the IRAS PSC catalog and find that the galaxy distribution displays the characteristic signature of gravity. Assuming Gaussian initial conditions, we obtain galaxy biasing parameters and , with no sign of scale-dependent bias for h/Mpc. These results impose stringent constraints on non-Gaussian initial conditions. For dimensional scaling models with statistics, we find , which implies a constraint on primordial skewness .
PACS numbers: 98.80.Es, 98.65.Dx, 98.80.Hw
Introduction.—What is the nature of the distribution of matter in the universe? Does the galaxy distribution follow the mass distribution on large scales? Our ability to constrain cosmological parameters from galaxy clustering is only as good as our understanding of bias, that is, the relation between the galaxy distribution and the underlying dark matter distribution. In the current structure formation paradigm, most of the matter in the universe is dark, interacting only through gravity, and cold. Small fluctuations, generated in the early universe, grow gravitationally once the universe becomes matter-dominated, leading to the formation of large-scale structure. Non-linear gravitational instability (GI) theory makes specific predictions for the statistical properties of the mass distribution, e.g., how non-Gaussian features arise from Gaussian initial conditions. The extent to which the galaxy distribution follows these predictions can be used to put constraints upon galaxy bias (and thus upon the physics of galaxy formation) and upon the degree of non-Gaussianity of the primordial fluctuations (which constrains the physics of the generation of fluctuations in the early universe).
In this Letter, we report and interpret measurements of the bispectrum for the IRAS PSC galaxy redshift survey [1]. Details of the method and earlier results can be found in two previous papers. In the first [2], we developed a framework to obtain reliable constraints upon galaxy biasing and primordial non-Gaussianity that takes into account the effects of survey geometry and sampling. In the second [3], we computed the bispectrum of the galaxy distribution of earlier IRAS redshift catalogs. Due to its larger volume and higher sampling density, the PSC survey yields the best evidence supporting GI and the strongest constraints to date upon galaxy biasing and primordial non-Gaussianity.
The Bispectrum.—In linear perturbation theory (PT), the statistical properties of the primordial fluctuations, Gaussian or non-Gaussian, are preserved. If Gaussian, they can be fully characterized in Fourier space by their power spectrum ,
| (1) |
where is the Fourier transform of the density contrast . Assuming a linear and deterministic galaxy bias, , measurement of the galaxy power spectrum in redshift surveys in the linear regime gives [4]
| (2) |
where , is the cosine of the angle between the wavector and the line of sight, is the rms density fluctuation amplitude in spheres of radius , and is the linear mass power spectrum scaled to . Equation (2) illustrates the degeneracies between the parameters , , and : measurement of the quadrupole to monopole ratio of via redshift distortions, for example, yields a measurement of , whereas the overall amplitude of the power spectrum gives in addition an estimate of . Equation (2) involves the small angle approximation, however for the parameter combinations measured here, the results will be unchanged even if the approximation is dropped.
Additional information is needed to break this degeneracy between , , and ; for example, non-linear effects in pairwise velocities [5, 6] and in density-velocity comparisons [7] can be used to constrain different combinations of , , and . We use here measurements of the bispectrum (see also [8, 9, 10, 11, 12]). The nonlinearities in the equations of motion of GI induce a characteristic pattern of three-point and higher order correlations [13, 14]. For Gaussian initial conditions, the induced bispectrum ,
| (3) |
scales as ; it is thus useful to examine the reduced bispectrum amplitude ,
| (4) |
To leading order in perturbation theory for Gaussian initial conditions, to an excellent approximation GI predicts that is independent of time and thus of and ; is a function of triangle shape with a behavior that depends only on the spectral index, .
We observe galaxies, not mass. At scales larger than the characteristic scale of galaxy formation, it is reasonable to assume that the galaxy density is given by a local transformation of the underlying mass density field; that is, for the smoothed density locally, in which case the galaxy bispectrum amplitude () is related to the matter amplitude () [15] as
| (5) |
This shows how the galaxy bispectrum can be used to break the degeneracies present in linear theory: since is independent of and , measuring for different triangles and comparing it to the predicted based upon the measured spectral index gives separate values for the bias parameters and [8]. In redshift space (where distances are measured by recession velocities using the Hubble law) there are small corrections to Eq. (5) that can be computed; for , , and , (5) underestimates the exact result in the large-scale limit by , independent of configuration [12]. Thus, it does not affect , and given the observational uncertainties, it only minimally alters the inferred .
To estimate the galaxy power spectrum and bispectrum, we follow Feldman, Kaiser, and Peacock [16] in using the optimal weighted transform of the difference between the data and a tailored synthetic catalog [2, 3]. In addition we construct mock catalogs using second-order Lagrangian PT (2LPT), which agrees with -body simulations at the scales we consider [2]. The speed of 2LPT allows us to construct a large number of mock catalogs which take into account the selection function, survey geometry, and redshift-space mapping. This is essential to estimate accurately the mean, errors, covariance, and the distribution of for different triangles, required to compute the non-Gaussian likelihood function [2]. The 2LPT mock catalog initial conditions are based on a CDM model with , ( stands for the cosmological constant); the linear power spectrum shape parameter is consistent with PSC power spectrum measurements [17, 18], and the adopted normalization, , corresponds to in redshift space, consistent with the observed normalization for IRAS galaxies [19].
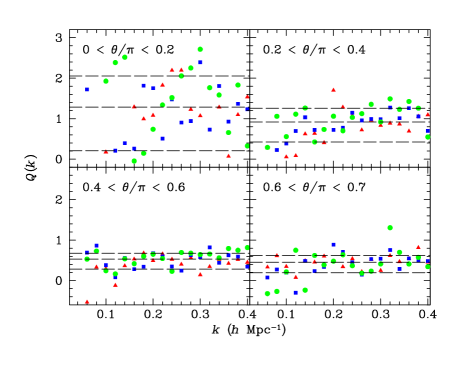
Data and Analysis.—The IRAS PSC survey [1] is based upon the IRAS Point Source Catalog with additions to achieve the best possible uniformity over the sky. Out of the 15411 IRAS galaxies across 84% of the sky, we take the 13180 galaxies in the range , with galactic latitude , and IRAS 60 micron flux . Our results appear graphically in Figures 1 and 2. The bispectrum is defined for closed triangles in Fourier space. We characterize a given triangle by its ordered sides . In Fig. 1 we show from PSC as a function of for triangles with two sides separated by angle , for four ranges of . Since the width of the survey window function is , we confine our quantitative analysis to triangle sides , for which deconvolution using the narrow window approximation is accurate [2]. The median of decreases with increasing , as predicted by GI [13] (see Fig. 2).
Figure 2 shows from PSC as a function of angle for triangles with and with two sides of ratio –0.6. The solid curve shows the prediction for in redshift space, obtained from averaging many 2LPT mock catalogs as detailed above. Symbols show results for bands in , as identified in the caption. The dependence of on triangle shape predicted by GI is clearly seen in the data. We employ a likelihood analysis as in[2, 3] to quantify the constraints that this places on galaxy biasing and primordial non-Gaussianity. For Gaussian initial conditions, the dashed curve shows the 2LPT CDM predictions with the best-fit values , , as given in Table 1.
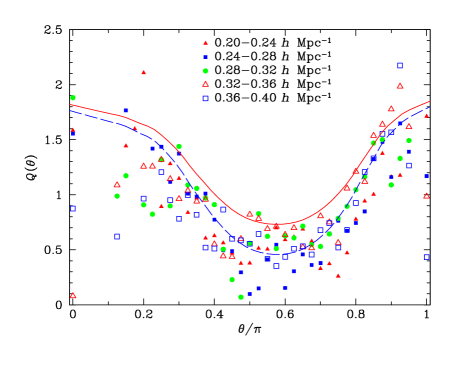
Figure 3 shows the likelihood contours and marginalized distributions for and for the PSC survey, assuming Gaussian initial conditions and including triangles with , where the upper limit is imposed by both nonlinearity and discreteness. We have varied the maximum wavenumber allowed in the analysis, , 0.25, and , (see Table 1.) The maximum likelihood values are essentially independent of , though the error bars decrease as is increased. There is no evidence that the bias parameters depend on . These results for and are insensitive to the values of and adopted in the mock catalogs [2, 3], but they do depend upon the assumed value for , since it determines the predicted [2, 3].
If galaxy biasing is local in Lagrangian, rather than Eulerian space (imposed on the initial, rather than final conditions), then in Eq.(5) has an additional term which depends upon configuration [20]. We have repeated the likelihood analysis for such a model and found that the likelihood ratio for the Eulerian to Lagrangian maximum likelihood is . This implies that the behavior of the bispectrum for PSC galaxies is better described by an Eulerian bias scheme.
| parameter | |||
|---|---|---|---|

The PSC bispectrum provides strong constraints upon non-Gaussian initial conditions. As an extension of the results in [3], we consider statistics as a general example of dimensional scaling models, where the linear PT -point correlation function . For , this corresponds to the predictions of some inflationary models with isocurvature perturbations [21, 22]; as the model becomes effectively Gaussian, and for a fixed power spectrum (taken to fit that of PSC) the primordial bispectrum obeys [23]. In addition, there are two other contributions that partially cancel that scale as [23]. The amplitude and scaling of the PSC bispectrum constrains to be considerably larger than unity. Thus, we use , and similarly for the errors, where and are obtained from mock catalogs for Gaussian and initial conditions, respectively. In addition, we assume that -eigenmodes and eigenvalues are well approximated by the Gaussian ones in the large regime. We construct a likelihood for by marginalizing over the bias; from this we obtain at 68% (95%) CL. Since the primordial dimensionless skewness is for a field [21], we conclude that the PSC bispectrum constrains .
Discussion.—Our findings are consistent with previous studies from sparser and smaller IRAS surveys [3], but using the PSC catalog reduces the statistical and systematic errors and allows us to place the strongest constraints to date upon nonlinear bias and primordial non-Gaussianity. Our main results are the following:
(1) The dependence of the bispectrum upon configuration shape is the clearest direct evidence to date that non-linear mode couplings are as specified in GI.
(2) The linear bias parameter we find, , agrees well with [24] obtained by a joint analysis of the PSC power spectrum, cosmic microwave background (CMB) anisotropy, and cluster abundances. It is also consistent with that inferred for APM galaxies [25] using the shape of the two-point correlation function, [26], taking into account the relative bias [27]. It is in less good agreement but still consistent with (95% CL) found from a concordance between PSC and recent CMB results [28].
(3) We obtain a nonlinear bias , which is not yet measured in any other way. A negative means that the number of IRAS galaxies does not rise as quickly as the mass density contrast; this is consistent with the observation that infrared-selected galaxies are increasingly under–represented in massive clusters.
(4) That both the scale and shape dependence of the bispectrum are consistent with GI acting on Gaussian initial conditions limits the possibility of primordial non-Gaussianity. In particular, our study of initial conditions constrains and the primordial skewness to be .
(5) Our results for the bispectrum are consistent with the galaxy skewness measured for the same catalog [29] and are similarly insensitive to the flux cut: we find identical results for . Further, the PSC data is incomplete beyond [30], however, since we look at , this should not affect the bispectrum signal.
(6) When coupled with measurements of the power spectrum redshift distortions, which determine for the PSC survey [30, 24], our measurement of from the bispectrum allows one to break the degeneracy between linear bias and : we find , indicating a low-density universe. We stress that, unlike other methods, this result is based only on the clustering properties of PSC galaxies assuming Gaussian initial conditions, independent to a large extent of external determinations of .
Due to its almost complete sky coverage and large volume, the PSC survey is the best survey available to study the bispectrum at large scales. This will soon change with the advent of larger redshift surveys such as 2dF and SDSS, which will determine the bispectrum even more precisely and thus test the GI framework, nonlinear galaxy bias, and primordial non-Gaussianity to unprecedented accuracy.
Research supported in part by the NSF grant AST-0070702 at Kansas, by the DOE and NASA grant NAG5-7092 at Fermilab, and by NASA NAG5-2835 at Florida. RS is supported by endowment funds from the IAS and thanks M. Zaldarriaga for useful discussions. We thank A. Hamilton and M. Tegmark for useful comments.
REFERENCES
- [1] W. Saunders et al., Mon. Not. R. Astron. Soc. 317, 55 (2000).
- [2] R. Scoccimarro, Astrophys. J. 544, 597, (2000).
- [3] R. Scoccimarro, H. A. Feldman, J. N. Fry, & J. A. Frieman, Astrophys. J. 546, 652 (2001)
- [4] N. Kaiser, Mon. Not. R. Astron. Soc. 277, 1 (1987).
- [5] P. G. Ferreira, R. Juszkiewicz, H. A. Feldman, M. Davis, & A. Jaffe, Astrophys. J. 515, L1 (1999).
- [6] R. Juszkiewicz, P. G. Ferreira, H. A. Feldman, M. Davis, & A. Jaffe, Science, 287, 109 (2000).
- [7] M. J. Chodorowski, Mon. Not. R. Astron. Soc. 308, 640 (1999).
- [8] J. N. Fry, Phys. Rev. Lett. 73, 215 (1994).
- [9] E. Hivon, F. R. Bouchet, S. Colombi, & R. Juszkiewicz, Astron. Ap. 298, 643 (1995).
- [10] S. Matarrese, L. Verde, & A. F. Heavens, Mon. Not. R. Astron. Soc. 290, 651 (1997).
- [11] L. Verde, A. F. Heavens, S. Matarrese, & L. Moscardini, Mon. Not. R. Astron. Soc. 300, 747 (1998).
- [12] R. Scoccimarro, H. M. P. Couchman, & J. A. Frieman, Astrophys. J. 517, 531 (1999).
- [13] J. N. Fry, Astrophys. J. 279, 499 (1984).
- [14] R. Scoccimarro, S. Colombi, J. Fry, J. Frieman, E. Hivon, & A. Melott, Astrophys. J. 496, 586 (1998).
- [15] J. N. Fry, & E. Gaztañaga, Astrophys. J. 413, 447 (1993).
- [16] H. A. Feldman, N. Kaiser, & J. A. Peacock, Astrophys. J. 426, 23 (1994).
- [17] H. Tadros et al., Mon. Not. R. Astron. Soc. 305, 527 (1999).
- [18] W. Sutherland et al., Mon. Not. R. Astron. Soc. 308, 289 (1999).
- [19] K. A. Fisher et al., Mon. Not. R. Astron. Soc. 267, 927 (1994).
- [20] P. Catelan, C. Porciani, & M. Kamionkowski, Mon. Not. R. Astron. Soc. 318, L39 (2000).
- [21] P. J. E. Peebles, Astrophys. J. , 483, L1 (1997); Astrophys. J. 510, 523 (1999); Phys. Rev. D 62, 023502 (2000).
- [22] A. Linde & V. Mukhanov, Phys. Rev. D 56, 535 (1997); I. Antoniadis, P. Mazur, & E. Mottola, Phys. Rev. Lett. 79, 14 (1997).
- [23] R. Scoccimarro, Astrophys. J. 542, 1 (2000).
- [24] A. N. Taylor, W. E. Ballinger, A. F. Heavens, & H. Tadros, astro-ph/0007048.
- [25] S. J. Maddox, G. Efstathiou, W. J. Sutherland, & L. Loveday, Mon. Not. R. Astron. Soc. , 242, 43 (1990).
- [26] E. Gaztañaga & R. Juszkiewicz, astro-ph/0007087.
- [27] A. J. S. Hamilton & M. Tegmark, astro-ph/0008392.
- [28] M. Tegmark, M. Zaldarriaga, & A. J. S. Hamilton, astro-ph/0008167.
- [29] I. Szapudi, E. Branchini, C. S. Frenk, S. Maddox, & W. Saunders, Mon. Not. R. Astron. Soc. 318, L45 (2000).
- [30] A. J. S. Hamilton, M. Tegmark, & N. Padmanabhan, Mon. Not. R. Astron. Soc. 317, L23 (2000).