Beyond M: Ultracool dwarfs in the Solar Neighbourhood
Abstract
I review the optical and near-infrared spectral characteristics of the extremely cool dwarfs grouped under the new classification of type L. These include both very low-mass stars and brown dwarfs, and we discuss the likely temperature range. Finally, we consider the frequency of binaries amongst very low-mass dwarfs, and the implications for formation mechanisms.
Dept. of Astronomy & Physics, University of Pennsylvania, 209 South 33rd Street, Philadelphia, PA 19104
1. Introduction
One of the major goals of stellar astronomy in latter half of the 20th century was the extension of the Solar Neighbourhood census to encompass starlike objects at and below the hydrogen-burning mass limit. That goal was realised in the past half-decade and, with the increased sensitivity provided by the new generation of near-infrared sky surveys, we now have a collection of almost 200 dwarfs whose spectral energy distributions indicate temperatures substantially cooler than those of classic late-type M dwarfs, such as VB 8, VB 10 and LHS 2924. Determining the physical properties of these objects remains a high priority, not only for the insight gained on the star formation process and the properties of atmospheres at such low temperatures, but also as a bridge towards understanding the plethora of super-Jovian planets currently being revealed through radial velocity observations of solar-type stars.
Davy Kirkpatrick’s presentation at this meeting has already described the sequence of major discoveries and the likely space density of very low-mass (VLM) dwarfs in the Galactic disk. A full discussion of the background to this subject is given by Reid & Hawley (2000). This review concentrates on two main issues: the general characteristics of the ultracool dwarfs now grouped under spectral class L, and recent results on low-mass binaries in the Hyades cluster and the field. Adam Burgasser extends the discussion to include the even cooler T dwarfs. In the complementary reviews in this session, John Stauffer covers recent results concerning very low-mass stars and brown dwarfs in the nearer open clusters and star forming regions, while Peter Hauschildt outlines the progress made in theoretical modelling of these very complicated atmospheres.
2. Brown dwarfs and low-mass stars
The fundamental difference between low-mass stars and brown dwarfs is illustrated in figure 1, which plots the evolution of the central temperature of VLM dwarfs with masses between 0.06 and 0.11 M⊙. 111 These predictions are taken from the theoretical models computed by the Tucson group (Burrows et al., 1994; 1997); qualitatively similar results are given by the Lyon models by Chabrier & Baraffe, which are coupled with Allard & Hauschildt’s model atmospheres (see Hauschildt’s review, this conference). During the initial contraction phase, the central temperature increases, regardless of mass, as potential energy is transformed to heat. As the temperature rises above K, the initial reactions of the PPI chain become possible, and hydrogen fusion is established. The energy generated in the core leads to hydrostatic equilibrium, and the low-mass star settles on the main-sequence, where it will continue burning hydrogen for 1012 years or more.
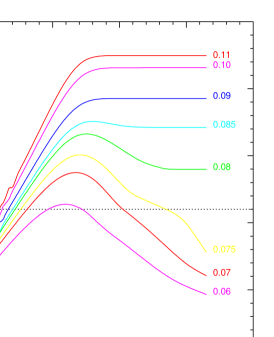
Low-mass dwarfs, however, are partially degenerate, and degeneracy absorbs some of the energy generated both by contraction and the initial fusion reactions. This leads to the downturn in temperature evident at masses below 0.09M⊙. The higher degeneracy in lower-mass objects can lead to TC falling below the critical value for maintaining hydrogen fusion. Robbed of the central energy source, the surface temperature and luminosity decrease steadily with time as the brown dwarf follows a degenerate cooling curve. ‘Transition objects’ on the boundary between stars and brown dwarfs (0.075M⊙ in these models; the Lyon models predict slightly lower masses) sustain fusion for several Gigayears before fading into oblivion.
Two further characteristics require mention: first, VLM dwarfs have radii which are set by degeneracy rather than gas pressure. As a result, all dwarfs with have radii within 15% of the radius of Jupiter - the minimum lies at . Second, the horizontal dotted line plotted on figure 1 marks TLi, the temperature required for fusion of lithium (by reaction 2 in the PP chain). Late-type dwarfs are fully convective, so if , primordial lithium is depleted; conversely, if TC fails to exceed the critical value for sufficient time, lithium is at most partially destroyed. This is the underlying basis for the lithium test devised by Rebolo et al. (1992): dwarfs later than spectral type M6 with Li 6708Å absorption can be identified as brown dwarfs with masses below .

3. Spectral class L
Spectral class M is characterised by the presence of strong absorption bands due to the diatomic molecule titanium oxide, TiO (Morgan, Keenan & Kellman, 1943). Figure 2 shows far-red spectra of dwarfs spanning spectral classes K7 to M9.5. The most prominent features are marked, including CaOH and CaH in mid-type dwarfs and VO and FeH absorption in the later-type dwarfs. H is also evident in emission in RG0050.5 and GJ 1111.
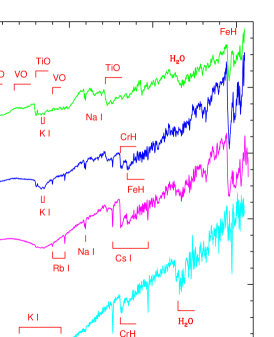
Figure 3 plots a skeletal sequence for spectral class L, following the classification scheme outlined by Kirkpatrick et al. (1999 - K99). The most important characteristics are the decreasing strengths of TiO and VO absorption as the overall energy distribution steepens from blue to red. The main molecular features are metal hydrides, CaH, FeH and CrH (and MgH at shorter wavelengths), and H2O: CaH peaks in strength in the earlier L dwarfs, FeH at mid-L and CrH and H2O grow in strength from early to late L. The only other prominent features are strong atomic lines of the alkali elements, notably Na, K, Rb, Cs and (in some cases) Li, the presence of the last identifying some (25%) L dwarfs as lower-mass brown dwarfs. Note the substantial broadening of the 7666/7699 Å KI resonance doublet in later L dwarfs, reaching a full-width of Å by spectral class L8 (the Na I D lines, another resonance doublet, reach similar strengths by L5, Reid et al, 2000a).
The explanation for this behaviour is generally agreed to lie with the formation of atmospheric dust particles as the dwarf cools to temperatures below K (spectral typeM6). Originally suggested by Tsuji et al. (1996), partly as a means of explaining the relatively shallow near-infrared H2O absorption in late-type M dwarfs (see further below), this mechanism has been investigated by several groups (Fegley & Lodders, 1996; Lodders, 1999; Burrows & Sharp, 1999; Hauschildt et al., this conference). In brief, the transformation of TiO and VO from gas to solid phase through the formation of materials like perovskite (calcium titanate, CaTiO3), solid VO and silicates, such as enstatite ( Mg2SiO3) and fosterite (Mg2SiO4), leads to both weaker molecular absorption, and a substantial reduction in the opacity at optical wavelengths. That, in turn, leads to the increasingly smooth energy distribution at later spectral types, while the high atmospheric transparency places the ‘photosphere’ at substantial physical depths, leading to high column densities for the alkali elements and strong lines. The continued presence of metal hydrides is analogous to the situation in cool, metal-poor extreme subdwarfs: few metallic atoms, but lots of H.
L dwarfs are faint at optical wavelengths, rendering photometry and spectroscopy extremely difficult; this is the main reason why wholesale discovery was postponed until the DENIS and 2MASS surveys came on line. Indeed, there little question that detailed observations would have been impossible without Keck, HIRES (Vogt et al, 1994) and LRIS (Oke et al, 1995). Capitalising fully and efficiently on future discoveries demands extension of the optical spectral sequence to the near-infrared wavelengths where most of the energy is produced. That transfer is now becoming possible with the development of intermediate-resolution near-IR spectrographs.
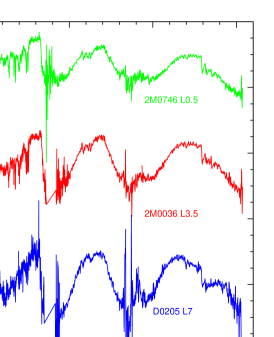
Figure 4 plots UKIRT CGS4 spectra of an early-, mid- and late-type L dwarf. There is greater similarity between spectral classes L and M at near-infrared wavelengths: differences are more a matter of degree than of kind. The strongest features are the H2O bands at 1.4 and 1.8 m, features also present in the terrestial atmosphere, and the CO bandhead at 2.3 m. Pressure-induced H2 absorption can also be present at m in some late-type L dwarfs (Tokunaga & Kobayashi, 1999). Hydride bands, notably FeH, and atomic lines due to Na, K and other metals are also present, primarily in the J band. Currently available data, which spans only a relatively small number of dwarfs, indicates that variations in the near-infrared features are well correlated with the optical variations: that is, an independently constructed near-infrared spectral sequence can be expected to produce the same ordering as optical data (McLean et al., 2000; Leggett et al., in prep.; Reid et al. in prep.).
4. On spectral classification
The primary definition of subclasses for spectral class L rests with Kirkpatrick et al. (K99), who subdivided the initial 2MASS detections into classes L0 to L8. Martín et al. (1999b) have outlined an alternative subdivision which differs in some respects from the K99 system, notably at later types (L7 L5 in this system). I believe that the latter system is flawed at a fundamental level in its conception.
Spectral classification is astronomical botany: it is an exercise in pure morphology, an ordering and organisation based solely on appearance. The hope and expectation is that by undertaking this exercise, one is also producing a sequence whose order is determined by some underlying physical parameter (usually temperature). That expectation can be fulfilled through a sensible choice of morphological criteria - substantive variations rather than minutiae. However, one must carefully divorce the act of classification from theoretical interpretation: classify, then interpret. The basis for this approach is obvious: theoretical models are ephemeral, periodically replaced with revised and improved analyses; the equivalent widths, line strengths and flux distribution of a given spectroscopic observation are, within observational uncertainty, fixed. A spectral classification system which must change with the release of each new set of theoretical models is of little use to anyone.
Spectral classification is based on what an object looks like, not what it is.
Martín et al. violate this separation by tying their classification system directly to temperatures estimated from a particular set of models. As discussed further below, there are also grounds for doubting the temperature scale adopted in Martín et al.’s system, but that is a separate matter.
One should not expect the conflict between these two proposed systems to be decided from above - classification systems are decided by acclamation, rather than legislation. To quote the originator of a well established system,
The MK system has no authority whatever; it has never been adopted as an official system by the International Astronomical Union - or by any other astronomical organisation. Its only authority lies in its usefulness; if it is not useful, it should be abandoned. W. W. Morgan (1979)
In the same way, the system chosen to subdivide spectral class L (and T) will be decided informally, by use, rather than by mandate.
5. Brown dwarf weather
In modelling stellar atmospheres, one usually thinks of the photosphere, the level, as a surface-like layer at a particular physical depth with a particular temperature. This approximation is reasonable for solar-type stars, but starts to break down in M dwarfs, where the feature-rich spectrum can lead to our sampling very different depths at different wavelengths. The situation for cool brown dwarfs is likely to be even more complex: not only does the formation and atmospheric dispersal of dust affect the evolution of the energy distribution, but topographical variations (bands and zones a la Jupiter, or clouds) may well lead to temporal variations (i.e. weather). Thus modelling brown dwarf atmospheres may well be more akin to planetary atmosphere analysis than classical stellar studies (replace photosphere with tropopause).
Some late-type M dwarfs are known occasionally to exhibit photometric variations, usually assumed to be associated with magnetic activity in the form of spots (eg Krishnamurthi et al., 1998; Reid & Hawley, 2000, ch. 5). Most attempts to detect such variations in ultracool dwarfs, notably by Tinney & Tolley (1999), have been unsuccessful. However, examples have recently come to light: first, Bailer-Jones & Mundt (2000) have measured cyclic photometric variability at the mag. level in I-band monitoring of the L1.5 dwarf, 2MASSW J1145572+231730. 2M1145 is one of the relatively few L dwarfs with H emission (see Gizis et al., 2000, for a more extensive discussion of chromospheric activity in ultracool dwarfs), suggesting that the photometric variations might be explained by the usual rotation-plus-spots model. The data are well-phased to a period of 7.12 hours which, interpreted as rotation, implies an equatorial velocity of kms-1 for .
More unusual variations have been detected in the late-type L dwarf, 2MASSW J1523226+301456, spectral type L8. This dwarf has strong lithium absorption, and is a common proper-motion companion of the G dwarf binary, Gl 584AB, lying at a separation of 3600 AU and a distance of 18.6 parsecs from the Sun. The association not only allows us to identify Gl 584C as one of the lowest luminosity brown dwarfs known, with MJ=15.0, 0.5 magnitudes brighter than Gl 229B, but also permits estimation of the age (from chromospheric activity in the G dwarfs) and hence a mass of (Kirkpatrick et al., in prep.). We observed 2M1523 on December 24 and 25, 1998, and figure 5 superimposes (with no adjustments) the independently flux-calibrated spectra. It is clear that while there is excellent agreement in the overall shape of the pseudo-continuum and the Cs I absorption lines, there are significant variations in the strengths of molecular features. In particular, the CrH/FeH region at 8650Å was filled in to some extent on the 24th, while the 9300Å water band is weaker. Subsequent observations (in March and July, 1999) show no further significant changes with the spectrum closer to our observations on Dec 24th.
The simplest interpretation of these results, driven mainly by the observed variation in H2O strength, is that the effective temperature on the 25th was lower than the average. The conventional interpretation would be to scribe this variation to the presence of a giant star spot. However, 2M1523 shows no evidence for significant chromospheric activity (). An alternative possibility is that we detected the presence of a substantial cloud, which moved the level to higher physical heights and lower temperatures. These observations are difficult and time consuming, but more extensive monitoring (an unpopular word for TACs) of the latest type L dwarfs might provide insight into the detailed structure of these cool atmospheres.
6. L dwarf temperatures and the L/T transition zone
To the best of our ability to test such matters, ordering M and L dwarfs by spectral type produces a rank ordering by effective temperature. Tying this relative scale to absolute values is important not only in the analysis of individual objects, but in using the statistical results from wide-field surveys to set constraints on the initial mass function (Kirkpatrick, this conference; Reid et al., 1999). Full model atmosphere analyses of these complex spectra remain extremely difficult (Hauschildt, this meeting), but, in principle, one might hope to use the appearance and disappearance of individual features to set constraints on Teff (with the over-riding caveat that ‘effective temperature’ may have less conceptual validity in these objects). Thus, VO is predicted to solidify at a temperature between 1700 and 1900K. Observations show that VO disappears from the spectrum at L4 (K99, Burrows & Sharp, 1999).
The most significant change in the spectral energy distribution of cool brown dwarfs comes at near-infrared wavelengths, with the change from CO to CH4 as the dominant atmospheric repository of carbon. This is accompanied by the onset of strong overtone CH4 absorption at 1.6 and 2.1 m: 70% of the flux emitted at H and K in L dwarfs is absorbed, but J is little affected, leading to (J-K) colours closer to A-type dwarfs than L dwarfs. This effect was originally predicted by Tsuji (1964), but the discovery of Gl 229B still came as something of a surprise to the astronomical community. The appearance of these near-infrared methane bands marks the transition from spectral type L to T (K99) 222Spectral type T is defined specifically by the presence of overtone CH4 absorption in the H and K passbands. Methane is also present in L dwarf atmospheres, albeit well above the ‘photosphere’, as evidenced by the recent detection of the 3.3m fundamental band by Noll et al. (2000). This fact has been used to argue against the use of the term ‘methane dwarf’; on the other hand, carbon is present in more than carbon stars..
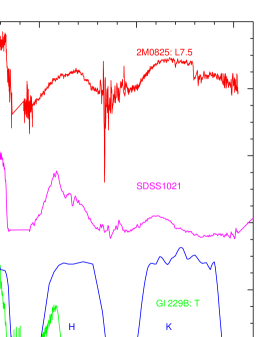
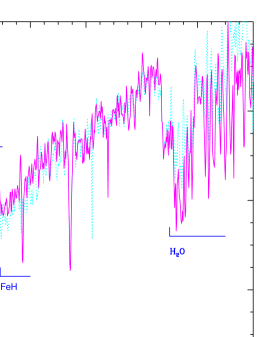
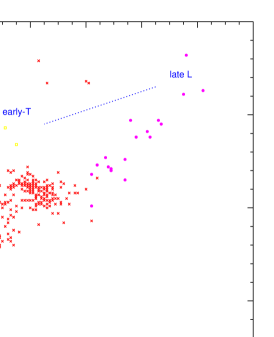
Our prospects of understanding brown dwarf characteristics over the L/T transition has received a boost through the recent discovery of several early-type T dwarfs using data obtained by the Sloan Digital Sky Survey (Leggett et al., 2000). As figure 6 illustrates, the near-infrared methane bands in these objects are less saturated than in the ‘classic’ Gl 229B-like T dwarfs. In addition, the H2O band at m, which is just starting to appear in the L7.5 dwarf, 2M0825, is not as strong as in Gl 229B. The effect of these spectral changes on the near-infrared colours is shown in figure 7. While the early-type T dwarfs have extremely red (I-J) colours, their JHK colours are similar to late-K/early-M giants, a fact which makes their discovery based on near-infrared data alone an extremely unlikely eventuality. Combination of Sloan’s deep, far-red data with 2MASS JHK (particularly J) photometry will provide an extremely effective method of locating these objects (see Kirkpatrick, this conference).
Two attempts have been made to tie L dwarf spectral types to effective temperatures. Kirkpatrick et al. (K99, 2000) have used the appearance/disappearance of individual spectral features as the basis for a scale running from TK at spectral type L0 to K for L8 dwarfs, such as 2M1523. For reference, the effective temperature of Gl 229B has been determined as K (Marley et al., 1996), and some of the more recently discovered T dwarfs may be significantly hotter (Burgasser, this conference). This scale therefore envisages a relatively small temperature difference between the SDSS early T-dwarfs and the latest L dwarfs.
In contrast, Basri et al.(1999) have used detailed line-profile analyses in conjunction with the Allard & Hauschildt atmosphere models to derive a much hotter temperature scale. To give a specific example, they estimate an effective temperature of K for the L7333For the reasons given in section 4, we eschew the Martín et al. classification scheme and quote spectral types on the K99 system. dwarf DENIS-P J0205-1159, which would be assigned TK on the K99 calibration. Thus, this scheme envisages a difference of almost a factor of two in temperature between 2M1523 and Gl 229B - and a substantial number of ‘missing’ (early-type T?) brown dwarfs, with consequent impact on .
Several arguments, however, can be marshalled against the hotter scale:
-
•
Our 2MASS follow-up observations now cover sq. deg., or 10% of the sky, and we have identified no L dwarfs later than spectral type L8 ((J-K)). Lower-temperature, lower-luminosity T dwarfs have been found within the same area. We conclude that L dwarfs later than L8 are extremely rare; indeed, L8 may mark the end of the L dwarf sequence.
-
•
Evolution from spectral type L8 to T involves a substantial change in (J-K) colour (figures 7 and 8); however, that need not imply a substantial change in temperature. Theoretical calculations indicate that the transition from CO-dominant to CH4-dominant atmospheres spans only 30 to 40K (Lodders, 1999). Brown dwarf atmospheres are extremely complex, but this result does not appear consistent with the large L/T temperature difference envisaged in the Basri et al. scheme.
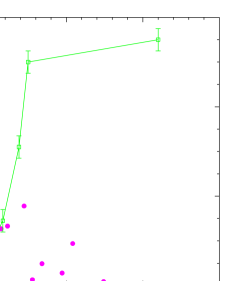
Figure 9.: Detection limits for HST imaging. The sensitivity curve plotted is for the Planetary Camera at 8000Å, but similar constraints apply to NICMOS imaging at 1.1m. Note that all of the detected Hyades binaries lie well above the magnitude limit. -
•
Figure 6 shows that the J-band is relatively unaffected by the transition from late-L to T. One might therefore expect MJ to provide a reliable indication of Mbol. Indeed, Gl 229B has M, or BC; the latter value is within 0.2 magnitudes of that measured for late-type M dwarfs. Since brown dwarfs are degenerate, we know that 2M1523 and Gl 229B have radii which differ by less than 15%. Thus, a mag corresponds to mag., or, from
a temperature difference of less than 25%. Given TK for Gl 229B, this implies TK for 2M1523.
Conversely, we can invert the problem: if 2M1523 has an effective temperature of 1700K, then M, and BC magnitudes, radically smaller than empirical estimates. -
•
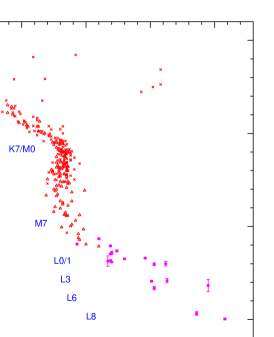
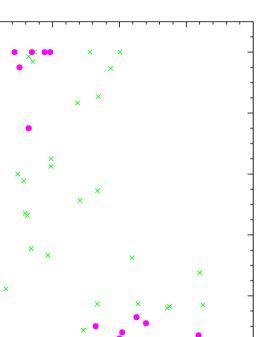
Figure 8 plots the (MJ, (J-K)) colour-magnitude diagram defined by nearby stars with well-determined trigonometric parallaxes. L0/L1 dwarfs have M, while 2M1523, L8. has MJ=15.0; as noted above, Gl 229B is only 0.5 magnitudes fainter. Basri et al. bracket the former interval by K (2300 to 1700K), and the latter by K; the photometric scale gives K (2100 to 1350K) and K, respectively.
Clearly, further observations ana analyses are required before we can arrive at a definitive temperature scale for late-type dwarfs. Parallax measurements for early-type T dwarfs and a larger sample of late L dwarfs will be particularly useful. However, in my view, the current balance of evidence favours the cooler scale.
7. Low mass binaries
Binary systems are important astrophysical tools. If full orbital solutions can be determined, individual components can be used to improve mass-luminosity(-age) relations, while the frequency of binary systems, and the distribution of parameters (mass ratios, semi-major axes, eccentricities, etc) as a function of systemic mass, can set constraints on star formation mechanisms. The classic work on solar-type stars is Duquennoy & Mayor’s (1991) survey of nearby stars, which found a binary fraction of at least 60%. Studies have consistently shown that binary frequency declines amongst lower-mass stars: Fischer & Marcy (1992) derive a multiplicity of (i.e. 2 of 3 M dwarf systems are isolated, single stars), a result confirmed by Reid & Gizis (1997a).
Further data on the frequency of low mass binaries have been provided by several HST imaging surveys, notably Planetary Camera observations of M dwarfs in the field (Reid & Gizis, 1997a) and Hyades cluster (Reid & Gizis, 1997b), and NICMOS data for low-mass stars and brown dwarfs in the Pleiades cluster (Martín et al., 2000). Those observations allow one to search for resolved companions at separations of less than 0.2 arcseconds, with the sensitivity limits extending well into the brown dwarf régime for the younger dwarfs in the open clusters. The results derived for the two M dwarf samples (8/41 binary or multiple systems in the field; 9/53 in the Hyades) are broadly consistent with expectations based on the nearby M dwarfs. The Pleiades survey, on the other hand, revealed no resolved systems, a discrepancy with respect to the field.
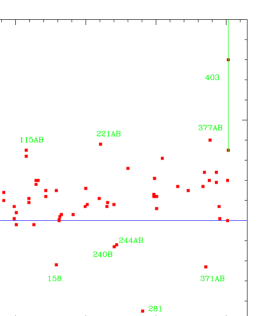
We have recently extended the Hyades survey by obtaining Keck HIRES data for all of 53 M dwarfs observed with HST (Reid & Mahoney, 2000), using a variety of techniques to search for close, spectroscopic binaries. Perhaps most interesting is the fact that we can use single observations to identify candidate binaries: all of these stars are confirmed as Hyades cluster members through both astrometry (proper motions) and chromospheric activity; as a result, we can predict the radial velocity of individual stars using the known cluster space motion and the angular distance from the convergent point; stars which deviate significantly from the expected value are likely to be exhibiting binary motion. Figure 10 plots the results of this exercise, where the convergent point is taken from Perryman et al.’s (1998) Hipparcos analysis. (The systematic trend in with RA suggests that either the adopted cluster motion, V kms-1, or the convergent point requires revision.)

All of the stars which deviate from the main body of data in figure 10 are confirmed or highly-probably binaries. One star in particular stands out: RHy 403. At M, this is one of the lowest luminosity Hyades members. Following our initial discovery of significant velocity variations, we monitored this star over Dec 28/29 and 29/30 in 1999 (some may notice an irritating consistency in TAC allocations for these projects). The HIRES data show clear binary motion, well-matched by a sinusoid with period 1.276 days, amplitude kms-1. The system is single-lined, setting an upper limit of on the secondary, while the mass function sets a lower limit of 0.06M⊙. This is the best candidate discovered to date for a brown dwarf member of the Hyades - and it is the only candidate. The ‘brown dwarf desert’ suspected amongst G dwarfs (Marcy & Butler, 1998) appears to extend to M dwarfs.
What about brown dwarf/brown dwarf binaries (figure 11)? Such objects have been known for some time: two of the original three field L dwarfs discovered in the DENIS brown dwarf mini-survey (Delfosse et al., 1997) and one of the early 2MASS discoveries prove to be equal-luminosity (therefore equal-mass) systems, with sub-arcsecond separations (Martín et al., 1999a; Koerner et al., 1999). Initial results suggested that such systems may be more frequent than amongst M dwarfs. However, we have been using HST to obtain F814W (I-band) images of a larger sample of L dwarfs, and those data point to a different conclusion. Only four of the 20 L dwarfs imaged successfully are resolved (Reid et al., 2000b). All four have component separations of a few tenths of an arcsecond, corresponding to AU (one system, 2M1146, was known as binary prior to our observations). Two systems (2M0920 and 2M0746) are at sufficiently small separations that orbital determinations, and dynamical mass estimates, may be possible in a matter of a decade or so.

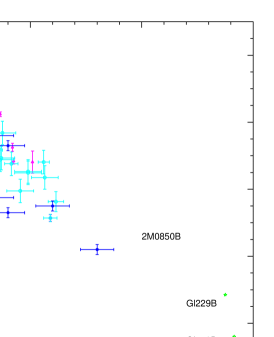
Three of the four HST-observed L dwarfs have components with near-equal luminosities. Since these low-mass objects evolve rapidly with time, this equality implies a comparable equality in mass, as with the previously known systems. One system, however, 2M0850+1057, has components which differ by 1.8 magnitudes at I (figure 12). 2M0850AB is one of the latest type L dwarfs, spectral type L6, and has a well-determined trigonometric parallax from US Naval Observatory astrometry (Dahn et al., 2000). Deconvolving the relative contributions of the two components, it becomes clear that 2M0850B is extremely interesting, with an absolute magnitude, MI, between the lowest-luminosity L8 dwarf (2M1523) and T dwarfs (figure 13).
The detection of lithium in 2M0850AB indicates a mass below 0.06M⊙ (for both components), with a mass ratio . The inferred J magnitude for 2M0850B is M, 0.3 magnitudes brighter than Gl 229B. Near-infrared spectroscopy of the (unresolved) 2M0850AB system shows no evidence for CH4 absorption in the K band, suggesting that 2M0850B (which contributes of the flux at those wavelengths) is spectral type L. This system, and others like it offer the prospect of bridging the gap from spectral type L to type T.
On the statistical front, our HST survey of field L dwarfs shows the same discrepancy of wide ( AU) binary systems noted by Martín et al. (2000) in their Pleiades survey. These two surveys target systems with similar masses: the majority of the Pleiads are spectral type M, but the hotter temperatures reflect a younger age than the average in the field ( Myrs vs Gyr). Wide binaries are rare amongst VLM, ultracool dwarfs. However, both L dwarfs and T dwarfs are found as wide, common proper-motion companions of main-sequence stars: Gl 229B is 45 AU from the M0.5 dwarf, Gl 229A; GD 165B is 110 AU from the white dwarfs GD 165A; G 196-3B is 340 AU from the M dwarf, G196-3A; Gl 670D lies 1525 AU from the triple system, Gl 670ABC; and, most extreme, Gl 584C is 3600 AU from the G-dwarf binary, Gl 584AB. Many of these systems can be dated using the characteristics of the main-sequence companion, notably chromospheric activity, allowing masses to be estimated for the brown dwarf companion.
Pulling these results together,
-
1.
VLM/VLM binaries are rare at separations exceeding 10 AU;
-
2.
The preference for equal-mass systems at small may be a selection effect, but echoes a similar preference amongst M dwarfs (Fig. 9; Reid & Gizis, 1997a,b);
-
3.
Wide binaries involving a more massive main-sequence star and a VLM dwarf are not uncommon.
These observed characteristics suggest two possibilities:
-
•
Wide, low-mass binaries are inhibited from forming by some characteristic (disk size? disk mass?) of the star formation process.
-
•
Wide, low-mass binaries form, but are disrupted by tidal effects. The binding energy of a binary system is linearly dependent on the total system mass and inversely dependent on the separation, providing a natural explanation for the preference for low-q systems at large .
At present, we lack sufficient data to distinguish between these alternatives. More extensive data on the prevalence of very close (AU), spectroscopic binaries and binary frequency in young, star-forming systems can shed more light on this question.
8. Summary and future prospects
It is difficult to underestimate the progress made in very low-mass star/brown dwarf research over the last few years. As recently as 1994 (Tinney’s ESO conference), questions were being raised over the very existence of brown dwarfs; now, we have well over 50 confirmed candidates in the field, together with numerous examples in open clusters (see Stauffer’s talk, these proceedings). We can consider their detailed spectral energy distributions, and wrangle over the appropriate means of botanising the sample.
Larger numbers of brown dwarf binaries are being discovered, both in near-equal mass systems and as companions to higher-mass main-sequence and evolved stars. Some offer the possibility of direct mass determination over reasonable timescales. The statistics of the sample, particularly the semi-major axis and mass ratio distribution, will provide insight into star formation mechanisms.
For the future, the brightest immediate prospects are offered by SIRTF. With its high sensitivity at mid-infrared wavelengths, SIRTF will not only provide much better data on the full energy distribution of ultracool dwarfs, improving substantially bolometric magnitude determinations, but also should be capable of detecting 300 to 400K (‘room temperature’) brown dwarfs. The last is particularly important given the rapid evolutionary timescales for most brown dwarfs. The L dwarfs, and even T dwarfs, discovered to date by 2MASS, DENIS and SDSS are very much the tip of a substantial iceberg, and all of our estimates of the mass function in the field and the mass density contributed by substellar-mass objects are predicated on reasonable, but untested, assumptions as to the scope of what is happening beneath the surface. Direct observations wouldn’t hurt.
Acknowledgments.
Thanks to the organisers for the invitation to speak at this conference, and thanks to imperial Gwen and svelte Daisy for brown dwarf modelling. Much of the research described in this review was supported by a Core Project grant from 2MASS, and was carried out in collaboration with other members of the Rare Objects team: Jim Liebert, Davy Kirkpatrick, John Gizis, Dave Monet, Conard Dahn and Adam Burgasser.
References
Bailer-Jones, C.A.L., Mundt, R., 2000, ASP Conf. Ser. 198, 341 (ed. R. Pallavicini, G. Micela & S. Sciortinio)
Basri, G., Mohanty, S., Allard, F., Hauschildt, P.H., et al. 2000, ApJ, in press
Burrows, A., Hubbard, W.B., Lunine, J.I. 1989 ApJ, 345, 939
Burrows, A., Marley, M., Hubbard, W.B., Lunine, J.I., et al. 1997, ApJ, 491, 856
Burrows, A., Sharp, C.M. 1999, ApJ, 512, 843
Dahn, C.C., Guetter, H., Harris, H., Henden, A., et al. 1999, in From Giant Planets to Cool Stars, (ed. C. Griffiths & M. Marley), ASP Conf. Proc. vol. 213, p. xxx
Delfosse, X., Tinney, C.G., Forveille, T., Epchtein, N., et al. 1997, Astr. Astrophys., 327, L25
Duquennoy, A., Mayor, M., 1991, Astr. Astrophys., 248, 485
Fegley, B., Lodders, K. 1996, ApJ, 472, L37
Fischer, D.A., Marcy, G.W. 1992 ApJ, 396, 178
Geballe, T., Kulkarni, S. R., Woodward, C. E., Sloan, G. C. 1996, ApJ, 467, L101
Gizis, J.E., Monet, D., Reid, I.N., Kirkpatrick, J.D., Liebert, J., Williams, R.J. 2000, AJ, in press
Kirkpatrick, J.D., Reid, I.N., Liebert, J., Cutri, R., et al. 1999, Apj, 519, 802 (K99)
Kirkpatrick, J.D., Reid, I.N., Liebert, J., Gizis, J.E., et al. 2000, AJ, 120, 447 (K00)
Koerner, D., Kirkpatrick, J.D., McElwain, M.W., Bonaventura, N.R. 1999, ApJL, 526, L25
Krishnamurthi, A., Terndrup, D.M., Pinsonneault, M.H., Sellgren, K. et al., 1998, ApJ, 493, 914
Leggett, S.K., Geballe, T. R., Fan, X., Schneider, D. P. et al., 2000, ApJL, 536, L35
Lodders, K. 1999, ApJ, 519, 793
McLean, I.S., Wilcox, M.V., Becklin, E.E., Figer, D.F., et al. 2000, ApJ, 533, L45
Marcy, G.W., Butler, P. 1998, ARAA, 36, 57
Marley, M.S., Saumon, D., Guillot, T., Freedman, R.S., Hubbard, W.B., Burrows, A., Lunine, J.I. 1996, Science, 272, 1919
Martín, E.L., Brandner, W., Basri, G. 1999a, Science, 283, 1718
Martín, E.L., Delfosse, X., Basri, G., Goldman, N., et al. 1999b, ApJ, 118, 2466
Martín, E.L., Brandner, W., Bouvier, J., Luhman, K.L., et al. 2000, ApJ, in press
Morgan, W.W., Keenan, P.C., Kellman, E. 1943, An Atlas of Stellar Spectra, (Chicago: Univ. of Chicago Press)
Morgan, W.W. 1979, Ricerche Astronomiche, 9, 59 (IAU Coll. 47)
Noll, K.S., Geballe, T.R., Leggett, S.K., Marley, M.S. 2000, ApJl, in press
Oke, J. B., Cohen, J. G., Carr, M., Cromer, J., et al. 1995, PASP, 107, 375
Perryman, M.A.C., Brown, A.G.A., Lebreton, Y., Gómez, A., et al. 1998. A&A, 331, 81
Rebolo, R., Martin, E.L., Magazzu, A. 1992, ApJ, 389, L83
Reid, I.N. 1992, MNRAS, 257, 257
Reid, I.N., Gizis, J.E., 1997a, AJ, 113, 2246
Reid, I.N., Gizis, J.E., 1997b, AJ, 114, 1992
Reid, I.N., Kirkpatrick, J.D., Liebert, J., Burrows, A., et al. 1999, ApJ, 521, 613
Reid, I.N., Hawley, S.L. 2000, New Light on Dark Stars, (Springer-Praxis: London, Heidelberg)
Reid, I.N., Kirkpatrick, J.D., Gizis, J.E., Dahn, C.C., Monet, D.G., Williams, R.J., Liebert, J., Burgasser, A.J. 2000a, AJ, 119, 369
Reid, I.N., Mahoney, S. 2000, MNRAS, in press
Reid, I.N., Gizis, J.E., Kirkpatrick, J.D., Koerner, D.W. 2000b, AJ, in press
Tinney, C.D., Tolley, A.J. 1999, MNRAS, 301, 1031
Tokunaga, A., Kobeyashi, N. 1999, AJ, 117, 1010
Tsuji, T. 1964, Ann. Tokyo Obs. ser. II, 9, 1
Tsuji, T., Ohnaka, K., Aoki, W. 1996, A&A, 305, L1
Vogt, S.S., Allen, S.L., Bigelow, B.C., Bresee, L. et al., 1994, S.P.I.E., 2198, 362