Infrared Spectra and Spectral Energy Distributions of Late–M– and L–Dwarfs
Abstract
We have obtained 1.0—2.5m spectra at R600 of 14 disk dwarfs with spectral types M6 to L7. For four of the dwarfs we have also obtained infrared spectra at R3000 in several narrow intervals. In addition, we present new L′ photometry for four of the dwarfs in the sample, which allows improved determinations of their bolometric luminosities. While obtaining the photometry we resolved the L-dwarf Denis-P J 0205-1159 into an identical pair of objects separated by 035. The spectra, together with the published energy distribution for one other L5 dwarf, are compared to synthetic spectra generated by upgraded model atmospheres. Good matches are found for 2200 K1900 (spectral types around M9 to L3), but discrepancies exist at 2300 K (M8) and for 1800 K (L4–L7). At the higher temperatures the mismatches are due to incompleteness in the water vapor opacity linelist. At the lower temperatures the disagreement is probably due to our treatment of dust: we assume a photospheric distribution in equilibrium with the gas phase and neglect any diffusion mechanisms. We derive effective temperatures for the sample from the comparison with synthetic spectra and also by comparing our observed total intrinsic luminosities to structural model calculations (which are mostly independent of the atmosphere but are dependent on the unknown masses and ages of the targets). The two derivations agree to about 200 K except for the faintest object in the sample where the discrepancy is larger. Agreement with other temperature determinations is also 200 K, except for the L7 dwarf.
1 Introduction
The last few years have seen rapid advances in both the observational data on low–mass stars and brown dwarfs and in the theoretical models of these objects. During this period we have been obtaining infrared spectra of a sample of halo and disk dwarfs approaching and below the stellar/sub–stellar boundary. This paper extends our spectroscopic study of M dwarfs presented in Leggett et al. 2000a (hereafter L00) to lower effective temperatures ( 2500 K). The data are compared to synthetic spectra generated from an upgraded version of Allard & Hauschildt’s NextGen model atmospheres (Hauschildt, Allard & Baron (1999)).
In §2 we present the target sample and in §3 we describe the instruments used to obtain the spectroscopic data. In §4 we present imaging results: new L′ photometry, confirmation of binarity of Denis-P J 0205-1159, and color–color diagrams. In §5 we describe the spectra and calculate integrated fluxes and bolometric magnitudes. §6 describes the models and the comparison process and the results of the comparison of the data to the synthetic spectra are presented in §7. In §8 we present derivations of effective temperature based on structural models. Our conclusions are given in §9.
2 The Sample
The fourteen dwarfs whose spectra are reported here were selected from various color or proper–motion surveys — Delfosse et al. (1997) (the DENIS-P survey, sometimes known as DBD objects); Irwin, McMahon & Reid (1991) (the BRI objects); Kirkpatrick, Beichman & Skrutskie (1997) (the 2MASS survey); Ruiz, Leggett & Allard (1997) (Kelu-1); Tinney (1993) (the TVLM objects) — or from follow–up studies of known high proper–motion objects — Kirkpatrick, Henry & Irwin (1997); Monet et al. (1992) — or from studies of low–mass companions to nearby stars — Becklin & Zuckerman (1988) (GD 165B). We also include for analysis the previously published energy distribution for the L dwarf SDSS 0539 found by the Sloan Digital Sky Survey (Fan et al. (2000); Leggett et al. 2000b ). The targets are listed in Table 1. We give discovery name, or LHS or LP number (Luyten (1979)), and/or Gliese or Gliese/Jahreiss number (Gliese & Jahreiss (1991)), for each dwarf. An abbreviated RA/Dec is also given to aid identification. The infrared instrumentation used for each object is given, using the configuration names from Table 2 (see §3).
The spectral types in Table 1 are based on optical spectra and are taken from Kirkpatrick et al. 1995, 1999a, 2000, Kirkpatrick, Henry & Irwin (1997) and Fan et al. (2000). These classifications are all on the same system; we note the significantly earlier spectral type assigned to Denis-P J 0205-1159 according to a classification system by Martín et al. (1999). The differences between the two classification systems are discussed further in §5.1.
The kinematic populations have been taken from Leggett et al. (1998); Leggett (1992), except for Kelu-1, Denis-P J 0205-1159, Denis-P J 1058-1548 and Denis-P J 1228-1547 for which we have calculated space velocities using parallaxes and proper motions from Dahn et al. (2000) and radial velocities from Basri et al. (1998), 2000. The space velocities of these four objects are low (U 20 to 30 km/s, V to km/s, W 1 to 5 km/s) and imply young disk population. The kinematic classification schemes for young disk (YD), young/old disk (Y/O) and old disk (OD) are described in Leggett (1992).
Detections of lithium in Kelu-1 (Ruiz, Leggett & Allard (1997); Basri et al. (1998)), Denis-P J 1228-1547 (Basri et al. (1998); Tinney, Delfosse & Forveille (1997)) and LP 944-20 (Tinney (1998)) imply that each of these objects is substellar and at an age of 1 Gyr. A non–detection for Denis-P J 1058-1548 (Basri et al. (1998)) implies a substellar mass if its age is 1 Gyr or a mass at the stellar/substellar transition of 0.075 M⊙ if it is several Gyr. The age of GD 165B also is uncertain; its mass is near the stellar/substellar boundary, but it is likely to be a brown dwarf (Kirkpatrick et al. 1999b ).
Denis-P J 1228-1547 was recently resolved to be a double system by Martín, Brandner & Basri (1999), using the Hubble Space Telescope. The binarity of Denis-P J0205-1159 was announced by Koerner et al. (1999) on the basis of K–band observations at Keck; in §4.2 we confirm this using JHKL′ imaging data from the United Kingdom 3.8 m Infrared Telescope (UKIRT). 2MASP J0345432254023 is suspected to be a double–lined spectroscopic binary (Reid et al. (1999)). Indirect evidence for further multiplicity in our sample is discussed in §4.3.
3 Spectroscopic Observations and Data Reduction
The infrared spectra were obtained at UKIRT and at the University of Hawaii 2.2 m telescope, using some of the same spectrographs as L00. Table 2 gives the observing dates, grating and slit information, and resolutions. The near–infrared data for SDSS 0539 were obtained using the configuration designated IR1 in Table 1, except that the slit was wider (12), yielding resolutions of 25 A at J and 50 A at H and K. The lower resolution data cover the entire JHK bandpasses, from 1.0m to 2.5m. The medium resolution data cover narrower spectral regions: 1.19—1.30m, 1.58—1.67m, and 2.02—2.18m. The data are available in electronic form on request.
Data reduction was carried out in the usual way using the Figaro software package. The effect of the terrestrial atmosphere was removed by dividing by the spectra of nearby early–type stars, after removing hydrogen lines seen in their spectra. The shape of each infrared spectrum was corrected for the known flux distribution of the early–type star. The low–resolution spectral segments were individually flux–calibrated using previously reported or recently obtained JHK photometry. Each segment was integrated over the appropriate filter profile (UKIRT JHK) and the observed flux from Vega was integrated over the same profile; Vega was assumed to be zero magnitude at all wavelengths, and the target flux was scaled to match the broadband photometry. The higher resolution data were scaled to match the calibrated lower resolution data.
Optical spectra were obtained from the literature for all the objects in the sample; the data sources are listed in Table 1. These data were flux-calibrated using the Cousins I filter and available I photometry, except for SDSS 0539 which was flux–calibrated using Sloan Digital Sky Survey photometry (Fan et al. (2000)).
4 Imaging Results
4.1 New Photometry
New infrared photometry was obtained for four of the objects in the sample. In 1999 February and March L′ data were obtained for Denis-P J 1058-1548 and Denis-P J 1228-1547AB using IRCAM3 (pixel scale 0.28 arcseconds/pixel) at UKIRT. In 1999 September data were obtained for Denis-P J 0205-1159 (JHK and L′) and 2MASP J0345432254023 (L′ only), using the same camera, which had been modified to a smaller pixel scale of 0.08 arcseconds/pixel (hereafter IRCAM/TUFTI). The results are presented in Table 3.
Standards with a range of color were observed; the results indicated that no color term was needed to convert the L′ data taken with IRCAM/TUFTI to the established UKIRT (IRCAM3) L′ system. However the J, H and K photometric systems are different due to significant differences in the filter set. The results in Table 3 are given in the new photometric system which we refer to here as the “UKIRT–UFTI(MKO–NIR)” system as the UFTI camera, with the new MKO–NIR filter set, is being used to define this system. Both UKIRT cameras, UFTI and IRCAM/TUFTI, are now configured with the new Mauna Kea consortium JHKL′ filter set. Transformations between the established UKIRT system and the new MKO–NIR system are presented in Hawarden et al. (2000).
4.2 Denis-P J 0205-1159 : an Identical Pair of L–Dwarfs
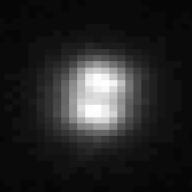
Denis-P J 0205-1159, which was observed in excellent seeing conditions on 1999 September 19 (UT) using the IRCAM/TUFTI camera, was easily resolved as a double system separated by 0.350.03 arcseconds at a position angle of 774 degrees. Figure 1 shows the K image of the system. The JHKL′ colors of each component are identical to within the measurement error. Proper motion measurements by Koerner et al. (1999) show that the object is a true binary. Those authors obtain a separation of 0.510.02 arcseconds and a position angle in 1997 July of 1065 degrees and, in 1999 January, 7210 degrees. We suggest that our values of 0.350.03 arcseconds and 774 degrees, based on higher resolution data (0.08 arcseconds/pixel cf. 0.15 arcseconds/pixel), are more accurate. The 035 separation translates to a physical separation of 6.3 AU. This system should be monitored to obtain orbital information.
4.3 Color–Color Diagrams
Table 4 lists distance moduli and VIJHKL′ colors for the sample. The V and I photometry were obtained from Dahn et al. (2000) for Denis-P J 0205-1159AB, Denis-P J 1058-1548, Denis-P J 1228-1547AB, 2MASP J0345432254023 and Kelu-1. The I magnitude for SDSS 0539 is synthesized from the flux–calibrated spectrum. J, H and K magnitudes for this object are from Leggett et al. 2000b . The L′ magnitude for GD 165B is taken from Jones et al. (1996). Otherwise the photometry is from this work or taken from the compilations by Leggett (1992); Leggett et al. (1998). The infrared photometry is on the established UKIRT (IRCAM3) system. We have averaged the JHK values for Denis-P J 0205-1159AB presented here with the earlier values in Leggett et al. (1998) after transforming the new JHK to the old photometric system using the known filter profiles. The two sets of values agree well.
Figures 2–4 show various VIJKL′ color–color diagrams; although similar diagrams are shown in Leggett et al. (1998) the ones shown here use improved or additional data at V, I and L′, and are useful references as clear trends are seen. Object labels in these and following plots are abbreviated: Denis-P J0205-1159AB, Denis-P J 1058-1548, Denis-P J 1228-1547AB become DNS 0205, 1058 and 1228 respectively; 2MASP J0345432254023 is labelled as 2M 0345; TVLM 513-46546 is shown as T 513-46546.
Figure 3 shows a synthetic color–temperature sequence for solar–metallicity and 5.0, generated from Ames–Dusty–2000 models (see §6) by convolving the calculated energy distributions with the known UKIRT filter profiles. There are some discrepancies between the calculated and observed colors due to known inadequacies in the models which we discuss in §6 and §7. Nevertheless this comparison provides the temperature range required for the spectral analysis model grid (approximately 1800 K to 2300 K).
Figure 5 shows MJ:JK with isochrones from Chabrier et al. (2000) for ages 5 Gyr and 0.1 Gyr. These isochrones use an earlier very similar Dusty version of the NextGen model atmospheres. The agreement is poor for the hotter dwarfs with M12, and not good for the coolest objects Denis-P J 0205-1159 and Denis-P J 1228-1547. The discrepancies reflect known inadequacies in the atmospheric models used to generate the colors (§6) rather than problems with the structural models.
As mentioned in §3, LP 944-20, Kelu-1 and Denis-P J 1228-1547AB are young substellar objects, and GD 165B (L4) and Denis-P J 1058-1548 (L3) are substellar or stellar/substellar transition mass objects, depending on their age. Kelu-1 is superluminous but no companion is seen in HST images (Martín, Brandner & Basri (1999)). Martín et al. (1999) point out that if Kelu-1 is a single object its luminosity implies an age of 0.1 Gyr. Basri et al. (2000) find that the object is a very rapid rotator (km/s) and so it may indeed be very young, if the correlation seen for hotter low–mass stars between youth and rapid rotation holds here. Nevertheless it is important to monitor it for radial velocity variations. 2MASP J0345432254023, which also appears superluminous, is suspected to be a spectroscopic binary (see §2). Both Denis-P J 0205-1159 and Denis-P J 1228-1547 are known to consist of pairs of very similar objects. The high frequency of binaries is not surprising in an effectively magnitude–limited sample such as this. Note that the evolutionary models imply that each component of the L5 dwarfs Denis-P J 0205-1159 and Denis-P J 1228-1547 must be substellar even for an age of several Gyr.
5 Spectroscopic Results
5.1 Spectroscopic Sequences
Figure 6 shows a representative set of R600 spectra covering the temperature range of our sample, which corresponds to spectral types dM7 to around dL7. The obvious features to note are: the CO bands at 2.3–2.4m; the water bands at 1.4m, 1.8m and longward of 2.4m; the FeH bands at 0.99m and 1.2m; and the KI doublets near 1.18m and 1.24m. Note that the TiO bands, which are used to classify the M dwarfs, are not apparent or very weak in the L dwarf spectra. A pseudo–continuum approach has been used by Martín et al. (1999) to classify the L dwarfs from optical spectra. They find a good correlation between this scheme and the strength of the water band at 1.4m. The trend of strengthening water absorption with later spectral type is seen in Figure 6. Kirkpatrick et al. 1999a use ratios of various optical absorption features to classify the L dwarfs. Both schemes roughly agree up to L5 at which point the Martín classes become earlier than Kirkpatrick’s (so that, for example, Denis-P J 0205-1159 is classified L5 in the Martín scheme and L7 on Kirkpatrick’s).
We note that the shape and depth of the water bands are calculated to be strongly affected by the presence of dust, which affects the emergent spectra for K, or spectral types dM7 and later. With no dust in the atmosphere, the bands are predicted to become deeper with increasingly steep wings as temperature decreases. When dust is present the atmosphere is heated in the line forming region and the bands become shallower and wider. It is likely that as infrared spectra are obtained for a larger sample of L dwarfs, more scatter will be seen in the relationship between the depth of the water bands and effective temperature or (optically derived) spectral type, as dust properties will vary from object to object (due to e.g. rotation, metallicity or age differences).
5.2 Integrated Fluxes and Bolometric Corrections
Table 4 gives integrated fluxes for the sample, expressed as flux at the Earth, apparent bolometric magnitude and intrinsic stellar luminosity. They were obtained by integrating the infrared spectra over wavelength and adding estimated flux contributions at shorter and longer wavelengths. Each shorter wavelength contribution was approximated as a linear extrapolation to zero flux at zero wavelength. The contributions at wavelengths beyond 2.4m were calculated by deriving the fluxes at L′ using an effective wavelength approach, interpolating the spectrum from the end of the K–band spectrum to the L′ wavelength, and assuming a Rayleigh–Jeans tail beyond L′ (model calculations imply that the Rayleigh–Jeans assumption is good to 1% at these temperatures). Although it is now known that methane absorption at 3.3m is seen in late L–dwarfs (Noll et al. (2000)), the feature is weak and will not significantly effect the determination of total flux for this sample. For SDSS 0539 we adopted an L′ magnitude based on JK, the K magnitude, and Figure 4. We note that for dwarfs with 2700 K 2000 K (spectral types later than dM5.5) the flux beyond 2.4m makes up 20% of the total flux and hence L′ measurements are crucial for an accurate determination of luminosity. The uncertainties are 5%, 0.05 mag and 0.02 dex in total flux, bolometric correction and log, respectively.
Figure 7 plots the K–band bolometric correction against IK and Figure 8 shows BCK against JK. We have included the results from Leggett et al. (1996) and L00. For the non–halo (disk and likely disk) dwarfs only, the relationship between K–band bolometric correction and color is represented by the cubic polynomials:
for 1.9 IK 5.5 and 0.75 JK 1.60. These relationships are indicated by the solid lines in Figures 7 and 8, and supercede that given in L00.
6 Models and Synthetic Spectra, and Comparison Process
The Ames–Dusty–2000 models used for this work were calculated as described in L00, and are based on the Ames H2O and TiO line lists by Partridge and Schwenke (1997) and Schwenke (1998). We stress that large uncertainties persist in these opacities for the temperature range of this work (see Allard, Hauschildt & Schwenke (2000)). The models have been upgraded with (i) the replacement of the JOLA (Just Overlapping Line Approximation) opacities for FeH, VO and CrH by opacity sampling line data from Phillips et al. (1987) and R. Freedman (NASA-Ames, private communication), and (ii) the extension of our database of dust grain opacities from 10 to 40 species. These models and their comparisons to earlier versions are the subject of a separate publication (Allard et al., in preparation).
The fitting of the synthetic to the observed spectra was done using an automatic IDL program. First, the resolution of the synthetic spectra was degraded to that of each individual observed spectrum and the spectra were normalized to unit area for scaling. The comparison was done using a model atmosphere grid that covers the range 1500 K K, and [M/H] and 0.0, with a total of 162 model atmospheres. For each observed spectrum we then calculated a quality function , similar to a value, for the comparison with all synthetic spectra in the grid. In order to avoid known problematic intervals in either the observed or the synthetic spectra, the wavelength range 1.5–1.7m was excluded from the comparison. Two particularly diagnostic wavelength ranges, 0.7–1.4m and 2.0–2.5m, were given 5 times higher weights than the remaining spectral ranges. We selected the models that resulted in lowest 3-5 values as the most probable parameters range for each individual star. The “best” value was then chosen by visual inspection. This procedure allows a rough estimate of the uncertainty in the stellar parameters. Note that it does not eliminate systematic errors in the stellar parameters due to missing or incomplete opacity sources.
This set of models relies on the assumption that the dust is in equilibrium with the gas phase at any depth in the atmosphere. This corresponds to a limiting case, discussed also by Chabrier et al. (2000) in the context of brown dwarf evolution, which could be met if the mixing of material (by convection, rotation or other processes) prevents the diffusion of the dust. Of course this situation may not be met at all layers of the atmosphere and/or at all effective temperatures since, for example, processes such as convective mixing retreat from the upper atmosphere as decreases. The current analysis will help determine the parameter range of stars over which this approximation is valid.
7 Results of Comparison of Data and Atmospheric Models
7.1 Low Resolution Spectra; Derived Temperatures and Diameters
Figure 9 shows examples of our best model fits to the observed spectral energy distributions. Table 5 lists the best–fit model parameters, , and [m/H], for each dwarf, sorted by spectral type (on the Kirkpatrick scheme). We also give diameters for the fourteen dwarfs with parallax measurements, derived in two ways — one from the scaling factor required to match the calculated surface flux to that observed at the Earth, and the other from the measured luminosity and derived effective temperature, via the Stefan–Boltzmann law. We return to the diameter measurements in §8.
The synthetic spectra fit the energy distributions for early–L dwarfs with 1900 K quite well, but there are obvious discrepancies for the hotter and cooler dwarfs. Discrepancies for late–M dwarfs are also apparent in L00 — the predicted water bands are too deep and there is too much flux predicted at the peaks of the J and H bands (in other words, the water vapor opacity profile is too cold). We attribute this to remaining problems in the calculated water opacity database, which is known to be incorrect for higher temperature transitions (Allard, Hauschildt & Schwenke (2000)). There are also discrepancies seen in the fits to the two latest spectral types in our sample, Denis-P J 1228-1547AB and Denis-P J 0205-1159AB. Although the shapes of the water bands are better matched for these objects, the calculated fluxes are too high at the peaks of the J and H bands and the models do not reproduce the shape of the K–band peaks. This indicates an inaccuracy in the atmospheric structure which appears to be too hot in the deeper layers from which the J– and H–band flux emerges. These discrepancies reveal the increasing inadequacy of the dust equilibrium assumption (or neglect of grain diffusion mechanisms) in the model photosphere construction as decreases. While models which incorporate gravitational settling by diffusion are not yet available, our result demonstrates the importance of such mechanisms in the L dwarf temperature range. Our determination that Denis-P J 1228-1547AB is metal–poor may only reflect problems in the Dusty models at this — it may in fact have solar metallicity (see §7.2). Note that despite the improved treatment of FeH, Figure 9 shows that better line data are still needed for this important opacity source. Note also that investigations of the effect of using different water opacities are presented in Allard, Hauschildt & Schwenke (2000).
For this particular model grid comparison the range of allowed by the spectral energy distribution fitting is constrained to 75–100 K, however this does not include systematic effects. There is further discussion of the errors in our values in §8 and §9. Surface gravity also affects the overall shape of the energy distribution. The best–fit models have of 5.5 or 6.0, except for the apparently metal–poor and slightly lower gravity Denis-P J 1228-1547AB. Given the remaining uncertainties tied to the water opacity and treatment of dust, we estimate the accuracy of our determinations of to be 0.5 dex. The structural models of Chabrier et al. (2000) yield 5.3 for objects in the observed temperature range with ages 1—5 Gyr.
7.2 Medium Resolution Spectra
Figure 10 shows the spectra we obtained at R3000. Only the J– and K–band regions are shown; the spectra of a portion of the H–band contain no obvious features. Also shown are the best–fit model synthetic spectra, based on the match to the lower resolution data but shown at higher resolution. We have rescaled the synthetic spectra to match the local pseudo–continuum.
The dominant narrow features in the J–band are the potassium doublets. The model spectra generally reproduce the shape and depth of the doublet, as well as the structure to the blue of the doublet. The pronounced asymmetry in the K I doublet for Denis-P J 0205-1159AB is real, but is not understood at this time. Most of the fine structure in the K–band is real and is due to water absorption; the synthetic spectra reproduce the observed structure well even at this detailed level. Experiments with varying and [m/H], while keeping the effective temperature fixed, showed that at R3000 the line profiles did not constrain gravity or metallicity significantly better than achieved with the R600 data (but they did support the parameters derived from the other data). For the Denis L dwarfs the J–band data were more diagnostic than the K–band, but only constrained to values between 5.0 and 5.5, and for Denis-P J 1228-1547AB showed that a metallicity of [m/H] was slightly preferable to the [m/H] implied by the low resolution fit.
8 Comparison of Data with Structural Models
Figure 11 shows the effective temperature implied by our atmospheric model fitting versus diameter derived by scaling the model flux to that observed at the Earth. We also show calculated sequences for ages 0.1 Gyr and 5 Gyr from Chabrier et al. (2000). There are discrepancies between our data points and the structural model at both the hot and cool ends of our sample. The diameters derived here are subject to errors in the parallax measurements as well as in the calculated surface flux. The variation in flux levels between the next–best–fit model and the best–fit model imply a typical total error in the diameter of 10—15%. The error in the diameter determined from luminosity and is dominated by the uncertainty in and is typically 15% if the error in is 100 K. These are the errors shown by the error bars in Figure 11.
However as discussed above there are large uncertainties remaining in the opacity treatment for the temperature range of this work (see Allard, Hauschildt & Schwenke (2000)), and in the treatment of dust — the assumption here that the dust is in equilibrium with the gas phase at any depth in the atmosphere corresponds to a limiting case, discussed also by Chabrier et al. (2000). It is possible that systematic errors exist in our derivations of effective temperature and diameter, despite our exclusion of the most suspect wavelength regions in the model fitting.
The theoretical determinations of radii and luminosity for low–mass stars and brown dwarfs are thought to be reasonably robust and reasonably independent of the surface atmosphere used for the structural model. This is demonstrated by the fact that the radii calculated by Burrows et al. (1997) for brown dwarfs of mass 0.03—0.07 M⊙ with 1300 K 2600, and age 0.3—3.0 Gyr, range (only) from 5.8e7 m to 7.6e7 m, in close agreement with those derived by Chabrier et al. (2000) of 6.0—7.6e7 m. Figure 12 plots versus log10L/L⊙ for objects ranging in mass from 0.03 M⊙ to 0.10 M⊙ and aged 0.1 Gyr to 10 Gyr. These are a reasonable to generous range in parameters for our observed range in luminosity. The sequences shown are from Chabrier et al. (2000), but one mass sequence from Burrows et al. (1997) is also shown to demonstrate the good agreement between evolutionary models. We have used this figure to derive effective temperatures for the targets in the sample with known distance (and hence luminosity) and these values are listed in the last column of Table 5. We assume all objects are single except for Denis-P J 1228-1547AB and Denis-P J 0205-1159AB, for which we assume two identical components. Note that the older kinematic population class for LHS 429 would suggest that the effective temperature lies at the high end of the tabulated range for this object.
There is an indication that our effective temperatures derived from fitting the spectral energy distributions with the synthetic spectra may be underestimated for the hotter stars in our sample, with spectral type around M7, and overestimated for the cooler mid– to late–L dwarfs. A hotter scale for the late–M dwarfs would agree better with that derived in Leggett et al. 2000b (i.e. K for type dM6). The agreement between these two approaches — the spectral synthesis and luminosity comparison — is 200 K, except for the coolest object in the sample, Denis-P J 0205-1159AB, where the discrepancy is 400 K. Better determinations of effective temperature for objects this late will have to await models with improved treatment of dust.
9 Discussion of the L–Dwarf Temperature Scale and Conclusions
Our derived temperatures agree with other derivations of for early–L type dwarfs within the likely errors. Pavlenko et al. (2000) use both the NextGenDusty and Tsuji (2000) atmospheric structures with their own spectral synthesis code to fit red spectra; they have to include an unknown additional opacity source, in the form of a power–law, to match the overall spectral shape because they do not include dust in solving for chemical equilibrium, or account for the opacity of known dust species (note that this is inconsistent with their adopted atmospheric structure). They derive for four dwarfs in common with us: for BRI 0021-0214 and Kelu-1 their values are higher than our spectral synthesis values by 100 K; for Denis-P J 1228-1547AB and Denis-P J 0205-1159AB their values are 200 K and 700 K lower. Their value of 1200 K for Denis-P J 0205-1159AB does not seem likely, as we would then expect to see methane features in the H– and K–band regions, which are not seen.
Basri et al. (2000) use Ames–Cond NextGen model fits to rubidium and cesium lines and derive effective temperatures within 100 K of our spectral synthesis values for Kelu-1, Denis-P J 1058-1548 and Denis-P J 1228-1547AB; they derive a value 150 K lower than ours for the coolest object in common, Denis-P J 0205-1159AB, and a value 300 K higher for the M9.5 dwarf LP 944-20. The Ames-Cond models include the formation of dust but neglect its opacity (i.e. assume the dust has settled below the photosphere), which corresponds to a limiting case which complements that assumed here of the dust in equilibrium with the gas phase. It is expected that dust clouds will sink lower in the atmosphere with decreasing effective temperature (in the absence of replenishment of material in the upper photosphere), hence the Cond models are likely to be more correct than the Dusty models for the latest L–dwarfs. The Basri et al. lower temperature of 1750 K for Denis-P J 0205-1159AB is likely to be more accurate than that derived here, but the opposite is true at hotter temperatures and so our lower for LP 944-20 is likely to be more accurate than their value. Given the discrepancies seen in the model fits to the observed spectral energy distributions for the coolest objects in our sample, it would appear that gravitational settling of dust becomes important at K.
Based on species condensation arguments, Kirkpatrick et al. (2000) argue for an effective temperature around 2000 K for L0 spectral types, which is in agreement with this work. They also advocate (based on luminosity) 1300 K for the L8 dwarf (by the Kirkpatrick scheme) GL 584C. However the discovery of three dwarfs optically redder than L8 and showing both CO and CH4 in their spectra (Leggett et al. 2000b ) suggests that these new later–type objects have 1300 K and by implication L8 spectral types have 1300 K. A hotter temperature scale also is supported by the preliminary model fits to L–band methane features seen in mid–L dwarfs reported by Noll et al. (2000). However all of these results can be estimates only as they either rely on the correlation between the appearance or disappearance of various species, which depends on the temperature of the line–forming region and not on the effective temperature, or they rely on what are acknowledged to be very preliminary atmospheric models in this temperature range.
In conclusion, the best current estimates are that the M dwarfs cover a range in of 3700—2100 K, the L dwarfs 2000—1500 K and the known methane (T) dwarfs 1300—800 K. A definitive temperature scale for the L dwarfs will not be possible until model atmospheres which include gravitational settling are available; such work is in progress by the modellers of this group and others. We note that any object with a spectral type L5 or later must be substellar based on evolutionary models, and late–M to early–L dwarfs may be substellar depending on their age. The discovery of binary L–dwarf systems offers a chance to further improve our knowledge of the fundamental parameters for this recently discovered low–mass population of our Galaxy.
References
- Allard, Hauschildt & Schwenke (2000) Allard, F., Hauschildt, P. H., Schwenke, D. W., 2000, ApJ, 539, August 20.
- Basri et al. (1998) Basri, G., Martín, E., Ruiz, M.T., Delfosse, X., Forveille, T., Epchtein, N., Allard, F. & Leggett, S.K., 1998, ASP Conf. Ser. 154, The Tenth Cambridge Workshop on Cool Stars, Stellar Systems and the Sun, Edited by R. A. Donahue and J. A. Bookbinder, p.1819
- Basri et al. (2000) Basri, G., Mohanty, S., Allard, F., Hauschildt, P.H., Delfosse, X., Martín, E., Forveille, T., & Goldman, B., 2000, ApJ, 538, 363
- Becklin & Zuckerman (1988) Becklin, E. E. and Zuckerman, B., 1988, Nature, 336, 656
- Burrows et al. (1997) Burrows, A., Marley, M., Hubbard, W.B., Lunine, J.I., Guillot, T., Saumon, D., Freedman, R., Sudarsky, D. & Sharp, C., 1997, ApJ, 491, 856
- Chabrier et al. (2000) Chabrier, G., Baraffe, I., Allard, F., Hauschildt, P. H., 2000, ApJ, 542, October 10
- Dahn et al. (2000) Dahn, C. et al. 2000, Giant Planets to Cool Stars, ASP Conf. Ser., Edited by C. Griffith and M. Marley,
- Delfosse et al. (1997) Delfosse, X., Tinney, C.G., Forveille, T., Epchtein, N., Bertin, E., Borsenberger, J., Copet, E., De Batz, B., Fouque, P., Kimeswenger, S., Le Bertre, T., Lacombe, F., Rouan, D., Tiphene, D., 1997, A&A, 327, L25
- Fan et al. (2000) Fan, X. et al. 2000, AJ, 119, 928
- Gliese & Jahreiss (1991) Gliese, W., & Jahreiss, H., 1991, Preliminary Version of the Third Catalog of Nearby Stars, Astronomisches Rechen–Institut Heidelberg Germany
- Hauschildt, Allard & Baron (1999) Hauschildt, P.H., Allard F. & Baron, E., 1999, ApJ, 512, 377
- Hawarden et al. (2000) Hawarden, T.G., Leggett, S.K., Letawsky, M.B., Ballantyne, D.R. & Casali, M.M., 2000, MNRAS, in preparation see also http://www.jach.hawaii.edu/JACpublic/UKIRT/astronomy/calib/fs_newJHK.html
- Irwin, McMahon & Reid (1991) Irwin, M., McMahon, R.G. & Reid, I.N., 1991, MNRAS, 252, 61p
- Jones et al. (1996) Jones, H.R.A., Longmore, A.J., Allard, F., Hauschildt, P.H., 1996, MNRAS, 280, 77
- Kirkpatrick (1992) Kirkpatrick, J. D., 1992, Ph.D. Thesis Arizona Univ., Tucson
- Kirkpatrick, Beichman & Skrutskie (1997) Kirkpatrick, J. D., Beichman, C.A. & Skrutskie, M.F., 1997, ApJ, 476, 311
- Kirkpatrick, Henry & Irwin (1997) Kirkpatrick, J. D., Henry, T. J., & Irwin, M.J., 1997, AJ, 113, 1421
- Kirkpatrick, Henry & Simons (1995) Kirkpatrick, J. D., Henry, T. J., & Simons, D. A., 1995, AJ, 109, 797
- (19) Kirkpatrick, J. D., Allard, F., Bida, T., Zuckerman, B., Becklin, E., Chabrier, G. & Baraffe, C., 1999b, ApJ, 519, 834
- (20) Kirkpatrick, J. D., Reid, I.N., Liebert, J., Cutri, R.M., Nelson, B., Beichman, C.A., Dahn, C.C., Monet, D.G., Gizis, J.E. & Skrutskie, M.F., 1999a, ApJ, 519, 802
- Kirkpatrick et al. (2000) Kirkpatrick, J. D., et al., 2000, AJ, 120, 447
- Koerner et al. (1999) Koerner, D.W., Kirkpatrick, J. D., McElwain, M.W. & Bonaventura, N.R., 1999, ApJ, 526, 25
- Leggett (1992) Leggett, S.K., 1992, ApJS, 82, 351
- Leggett et al. (1996) Leggett, S.K., Allard, F., Berriman,G., Dahn, C.C. & Hauschildt, P.H., 1996, ApJS, 104, 117
- Leggett et al. (1998) Leggett, S.K., Allard, F., & Hauschildt, P.H., 1998, ApJ, 509, 836
- (26) Leggett, S.K., Allard, F., Dahn, C., Hauschildt, P.H., Kerr, T.H. & Rayner, J., 2000a, ApJ, 535, 965 (L00)
- (27) Leggett, S.K., et al., 2000b, ApJ, 536, L35
- Luyten (1979) Luyten W.J. 1979, The LHS Catalogue, Second Edition (Minneapolis: University of Minnesota)
- Martín et al. (1999) Martín, E.L., Delfosse, X., Basri, G., Goldman, B., Forveille, T. & Osorio, M.R.Z., 1999, AJ, 118, 2466
- Martín, Brandner & Basri (1999) Martín, E.L., Brandner, W. & Basri, G., 1999, Science, 283, 1718
- Monet et al. (1992) Monet, D.G., Dahn, C.C., Vrba, F.J., Harris, H. C., Pier, J.R., Luginbuhl, C.B., Ables, H.D., 1992, AJ, 103, 638
- Noll et al. (2000) Noll, K.S., Geballe, T.R., Leggett, S.K. & Marley, M.S., 2000, ApJ,
- Partridge and Schwenke (1997) Partridge, H., Schwenke, D. W., 1997, J. Chem. Phys., 106, 4618
- Pavlenko et al. (2000) Pavlenko, Ya., Zapatero Osorio, M.R. & Rebolo, R., 2000, A&A, 355, 245
- Phillips et al. (1987) Phillips, J. G., Davis, S. P., Lindgren, B., Balfour, W. J., 1987, ApJS, 65, 721
- Reid, Hawley & Gizis (1995) Reid, I.N., Hawley, S.L., & Gizis, J.E., 1995, AJ, 110, 1838
- Reid et al. (1999) Reid, I.N., Kirkpatrick, J.D., Liebert, J., Burrows, A., Gizis, J E., Burgasser, A., Dahn, C., Monet, D., Cutri, R., Beichman, C.A.; Skrutskie, M., 1999, ApJ, 521, 613
- Ruiz, Leggett & Allard (1997) Ruiz, M.T., Leggett, S.K. & Allard, F., 1997, ApJ, 491, L107
- Schwenke (1998) Schwenke, D. W., 1998, “The Opacity of TiO from a Coupled Electronic State Calculation Parameterized by ab initio Chemistry and Physics of Molecules and Grains in Space”. Faraday Discussion. Vol. 109, 321
- Tinney (1993) Tinney, C.G., 1993, ApJ, 414, 279
- Tinney, Delfosse & Forveille (1997) Tinney, C.G., Delfosse, X. & Forveille, T., 1997, ApJ, 490, L95
- Tinney, et al. (1998) Tinney, C.G., Delfosse, X., Forveille, T. & Allard, F., 1998, A&A, 338, 1066
- Tinney (1998) Tinney, C.G., 1998, MNRAS, 296, L42
- Tinney & Reid (1998) Tinney, C.G., & Reid, I.N., 1998, MNRAS, 301, 1031
- Tsuji (2000) Tsuji, T., 2000, Low–Mass Stars and Brown Dwarfs in Stellar Clusters and Associations, Cambridge University Press
- van Altena, Lee, & Hoffleit (1994) van Altena, W.F., Lee, J.T., & Hoffleit, E.D. 1994, The General Catalogue of Trigonometric Parallaxes (New Haven: Yale University Observatory)


| LHS | Other | RA/Dec | SpectralaaSpectral types quoted on the Kirkpatrick scheme, note that Denis-P J 0205-1159AB is classified L5 on the Martín scheme, see text | Kinematic | InstrumentationbbPublished spectra taken from: 1 Tinney et al. 1998 resolution 7A 2 Tinney & Reid 1998 resolution 0.4A 3 Kirkpatrick, Beichman & Skrutskie 1997 resolution 12A 4 Leggett et al. 2000b resolution 25—50A 5 Fan et al. 2000 resolution 14A 6 Kirkpatrick et al. 1995 resolution 18A 7 Ruiz et al. 1997 resolution 17A 8 Kirkpatrick 1992 resolution 18A 9 Kirkpatrick et al. 1995 resolution 12A 10 Reid, Hawley & Gizis 1995 resolution 8A | |
|---|---|---|---|---|---|---|
| Number | Name | 1950 | Type | Population | Infrared | Optical |
| BRI 0021-0214 | 002102 | M9.5 | Y/O | IR1 | 1 | |
| Denis-P J 0205-1159AB | 020312 | L7 | YD | IR1,IR0 | 1 | |
| LP 944-20 | 033735 | M9 | YD | IR1 | 2 | |
| 2MASP J0345432254023 | 034225 | L0 | IR1 | 3 | ||
| SDSS 0539 | 053900 | L5 | 4 | 5 | ||
| 2065 | LP 666-9 | 085103 | M9 | YD | IR1,IR0 | 6 |
| Denis-P J 1058-1548 | 105815 | L3 | YD | IR1,IR0 | 1 | |
| Denis-P J 1228-1547AB | 122815 | L5 | YD | IR1,IR0 | 1 | |
| Kelu-1 | 130525 | L2 | YD | IR3 | 7 | |
| GD 165B | 142209 | L4 | IR3 | 6 | ||
| 2930 | LP 98-79 | 142959 | M6.5 | Y/O | IR4 | 8 |
| 3003 | LP 914-54 | 145327 | M7 | Y/O | IR4 | 9 |
| TVLM 513-46546 | 145823 | M8.5 | Y/O | IR3 | 9 | |
| 429 | Gl 644C | 165208 | M7 | OD | IR4 | 9 |
| 3406 | LP 229-30 | 184140 | M5.5 | Y/O | IR4 | 10 |
| Configuration | Instrument | Telescope | Date | Grating | Slit | Resolution A | |||
|---|---|---|---|---|---|---|---|---|---|
| Name | YYYYMM | lines/mm | Width ″ | Z | J | H | K | ||
| IR0 | CGS4 | UKIRT | 199801 | 150 | 1.2 | 4 | 6 | 6 | |
| IR1 | CGS4 | UKIRT | 199904 | 40 | 0.6 | 17 | 35 | 35 | |
| 199801 | |||||||||
| 199711 | |||||||||
| IR3 | CGS4 | UKIRT | 199704 | 75 | 1.2 | 16 | 30 | 30 | |
| IR4 | KSPEC | UH 88” | 199407 | 60 | 1.2 | 20 | 25 | 30 | 40 |
| Name | J (error) | H (error) | K (error) | L′ (error) |
|---|---|---|---|---|
| UKIRT–UFTI(MKO–NIR) | UKIRT | |||
| Denis-P J 0205-1159AB | 14.43 (0.04) | 13.61 (0.03) | 12.99 (0.03) | 11.44 (0.10) |
| 2MASP J0345432254023 | 12.01 (0.10) | |||
| Denis-P J 1058-1548 | 11.62 (0.10) | |||
| Denis-P J 1228-1547AB | 11.42 (0.10) | |||
| Name | aaDistance moduli from: 1: Tinney 1996 2: Dahn et al. 2000 3: Yale General Catalogue (van Altena et al. 1995) | VI | I | IJ | JH | HK | K | KL′ | FluxbbFlux at the Earth | mbolccApparent bolometric magnitude; adopting L W and M then: | BCKddBC K | log 10eeIntrinsic luminosity, adopting L W then: |
|---|---|---|---|---|---|---|---|---|---|---|---|---|
| W/m2 | L/L⊙ | |||||||||||
| BRI 0021-0214 | 11footnotemark: | 15.10 | 3.30 | 0.76 | 0.46 | 10.57 | 0.79 | 8.17e14 | 13.74 | 3.17 | 3.43 | |
| Denis-P J 02051159AB | 22footnotemark: | 18.44 | 3.94 | 0.98 | 0.51 | 13.01 | 1.57 | 8.60e15 | 16.19 | 3.18 | ||
| LP 944-20 | 1.5111footnotemark: | 14.16 | 3.48 | 0.70 | 0.45 | 9.53 | 0.81 | 2.20e13 | 12.67 | 3.14 | 3.77 | |
| 2MASP J0345432254023 | 22footnotemark: | 4.66 | 17.36 | 3.45 | 0.77 | 0.44 | 12.70 | 0.69 | 1.12e14 | 15.90 | 3.20 | |
| SDSS 0539 | 17.67 | 3.73 | 0.97 | 0.53 | 12.44 | 1.34e14 | 15.70 | 3.26 | ||||
| LHS 2065 | 0.3533footnotemark: | 4.36 | 14.44 | 3.22 | 0.80 | 0.48 | 9.94 | 0.75 | 1.45e13 | 13.12 | 3.18 | 3.49 |
| Denis-P J 10581548 | 22footnotemark: | 17.80 | 3.61 | 0.99 | 0.59 | 12.61 | 0.99 | 1.10e14 | 15.92 | 3.31 | 3.98 | |
| Denis-P J 12281547AB | 22footnotemark: | 18.21 | 3.83 | 1.05 | 0.57 | 12.76 | 1.34 | 9.94e15 | 16.03 | 3.27 | 4.00 | |
| Kelu-1 | 22footnotemark: | 4.84 | 16.94 | 3.65 | 0.92 | 0.55 | 11.82 | 1.04 | 2.37e14 | 15.09 | 3.27 | 3.56 |
| GD 165B | 33footnotemark: | 19.16 | 3.45 | 1.03 | 0.55 | 14.13 | 1.20 | 2.82e15 | 17.40 | 3.27 | 4.06 | |
| LHS 2930 | 0.0833footnotemark: | 4.57 | 13.31 | 2.54 | 0.65 | 0.38 | 9.74 | 0.52 | 2.05e13 | 12.74 | 3.00 | 3.23 |
| LHS 3003 | 0.9733footnotemark: | 4.52 | 12.53 | 2.51 | 0.65 | 0.42 | 8.95 | 0.52 | 4.14e13 | 11.98 | 3.03 | 3.28 |
| TVLM 513-46546 | 0.0411footnotemark: | 15.09 | 3.29 | 0.68 | 0.40 | 10.72 | 0.69 | 7.43e14 | 13.85 | 3.13 | 3.65 | |
| LHS 429 | 0.9533footnotemark: | 4.56 | 12.24 | 2.39 | 0.63 | 0.38 | 8.84 | 0.47 | 4.69e13 | 11.84 | 3.00 | 3.22 |
| LHS 3406 | 33footnotemark: | 4.36 | 13.87 | 2.56 | 0.61 | 0.35 | 10.35 | 0.57 | 1.24e13 | 13.29 | 2.94 | 3.12 |
| Spectral | Name | By Spectral Synthesis | By Structural Model | ||
|---|---|---|---|---|---|
| Type | K//[m/H] | Diameter m | K | ||
| by Scaling | by L, | ||||
| M5.5 | LHS 3406 | 2300/ 6.0/0.0 | 2.38 | 2.42 | 2550–2700 |
| M6.5 | LHS 2930 | 2300/ 6.0/0.0 | 2.09 | 2.14 | 2400–2650 |
| M7 | LHS 3003 | 2200/ 6.0/0.0 | 2.20 | 2.20 | 2400–2650 |
| M7 | LHS 429 | 2300/ 6.0/0.0 | 2.13 | 2.16 | 2450–2650 |
| M8.5 | TVLM 513-46546 | 2200/ 6.0/0.0 | 1.45 | 1.44 | 2000–2250 |
| M9 | LP 944-20 | 2100/ 6.0/0.0 | 1.43 | 1.38 | 1850–2100 |
| M9 | LHS 2065 | 2100/ 6.0/0.0 | 1.97 | 1.90 | 2150–2400 |
| M9.5 | BRI 0021-0214 | 2100/ 6.0/0.0 | 2.12 | 2.03 | 2200–2450 |
| L0 | 2MASP J0345432254023(SB?) | 2000/ 6.0/0.0 | 1.92 | 1.87 | 2050–2350 |
| L2 | Kelu-1 | 1900/ 5.5/0.0 | 2.10 | 2.14 | 2100–2350 |
| L3 | Denis-P J 10581548 | 1900/ 5.5/0.0 | 1.28 | 1.32 | 1700-1950 |
| L4 | GD 165B | 1900/ 5.5/0.0 | 1.14 | 1.20 | 1650–1850 |
| L5 | SDSS 0539 | 1900/ 5.5/0.0 | |||
| L5 | Denis-P J 12281547AB | 1800/ 5.0/0.5 | 1.42 | 1.44 | 1450–1650aaAssuming equal contribution to luminosity from each component of binary |
| L7 | Denis-P J 02051159AB | 1900/ 5.5/0.0 | 1.11 | 1.20 | 1400–1600aaAssuming equal contribution to luminosity from each component of binary |