Hard X-ray emission from IC443: evidence for a shocked molecular clump?
Abstract
We report BeppoSAX observations of spatially resolved hard X-ray emission from IC 443, a supernova remnant interacting with a molecular cloud. The emission is shown to come from two localized features spatially correlated with bright molecular emission regions. Both hard X-ray features have soft X-ray counterparts, in one case shifted by toward the remnant interior. The spectra of X-ray emission from both isolated features have photon index in the MECS regime. The emission detected from the remnant with PDS detector extends up to 100 keV. We discuss the observed properties of the hard X-ray features in relation to non-thermal emission from shocked molecular clumps and pulsar wind nebula.
Key Words.:
Acceleration of particles; Radiation mechanisms: non-thermal; ISM: clouds; ISM: cosmic rays; ISM: individual object: IC443; ISM: supernova remnants1 Introduction
Massive stars that are the likely progenitors of core collapsed supernovae are expected to be spatially correlated with molecular clouds. IC 443 (G189.1+3.0) is one of the best space laboratories to study rich phenomena accompanying supernova interaction with a molecular cloud. This was established from observed shock-excited molecular line emission from OH, CO and H2 (e.g. Burton et al. 1988; van Dishoeck et al. 1993; Cesarsky et al. 1999). Observations of OH masers and CO clumps towards IC 443, W28 and W44 also provide convincing evidence of molecular cloud interaction in this case (Claussen et al 1997).
IC 443 was a target of X-ray observations with HEAO 1 (Petre et al. 1988), Ginga (Wang et al. 1992), ROSAT (Asaoka & Aschenbach 1994) and ASCA (Keohane et al. 1997, K97 hereafter). The soft X-ray 0.2–3.1 keV surface brightness map of IC 443 from the Einstein Observatory (Petre et al. 1988) shows bright features in the northeastern part of the remnant as well as bright soft emission from the source central part. The presence of nearly uniform X-ray emission from the central part of the remnant was clearly seen also by ROSAT (Asaoka & Aschenbach, 1994), and corresponds to the emission from hot (T K), low density gas interior to the shock. ASCA GIS observations by K97 discovered the localized character of the hard X-ray emission. They concluded that most of the 2-10 keV GIS photons came from an isolated emitting feature and from the southeast elongated ridge of hard emission. Preite-Martinez et al. (1999) have reported a hard ( keV) component with BeppoSAX/PDS and two hot spots corresponding to the ASCA sources of K97 using the MECS.
The supernova remnants (SNRs) that are likely candidates to be -ray sources in CGRO EGRET observations (Esposito et al. 1996) also show evidence for interaction with molecular gas. In the case of IC 443, the molecular line emission region is partially inside the EGRET -ray detection circle.
Theoretical models of SNRs interacting with clouds were discussed recently by Sturner et al. (1997), Baring et al. (1999), Chevalier (1999). The non-thermal multi-wavelength spectrum of a SNR interacting with a molecular cloud was studied by Bykov et al. (2000). They showed that the propagation of a radiative shock wave within a molecular cloud lead to a substantial non-thermal emission both in hard X-rays and in -ray. The complex structure of molecular cloud consisting of dense massive clumps embedded in the inter-clump medium could result in localized sources of hard X-ray emission correlated with both bright molecular emission and extended source of non-thermal radio and -ray emission. In this Letter, we present the archive BeppoSAX observations of IC443 and, in particularly, we discuss the features detected in the MECS hard X-ray mosaiced map of the remnant.
2 Observations and data analysis
Results from the the Medium-Energy Concentrator Spectrometer (MECS; 1.8–10 keV; Boella et al. 1997) and the Phoswich Detection System (PDS; 15–300 keV; Frontera et al. 1997) on-board BeppoSAX are presented.
| Obs. | T | Coord (J2000) | Date |
|---|---|---|---|
| ksec | |||
| IC443H | 21.5 | 11/4/1999 | |
| IC443E | 48.4 | 11/4/1998 | |
| IC443C | 67.1 | 18/10/1997 | |
| IC443N | 23.8 | 20/10/1997 |
We have used all the 4 observation of IC443 available in the public BeppoSAX archive; Table 1 lists their coordinates and exposure times. Good data were selected from intervals when the elevation angle above the Earth’s limb was and when the instrument configurations were nominal, using the SAXDAS 2.0.0 data analysis package.
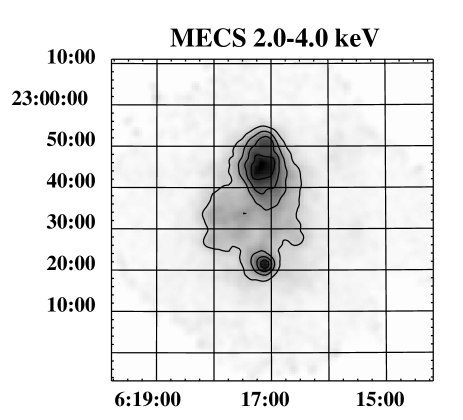
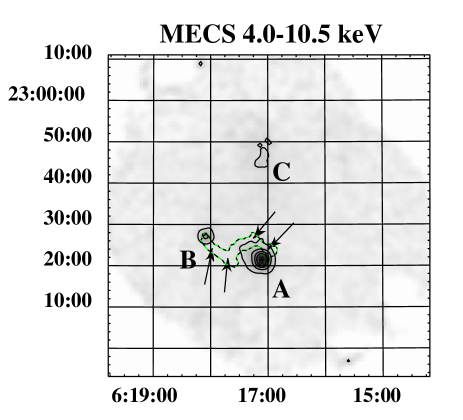
Fig. 1 shows the MECS mosaics of IC443 in different bands. The images are vignetting and exposure corrected. The 2.0-4.0 MECS images show an emission morphology similar to the GIS broad-band maps presented by K97. On the other hand, the hard MECS image above 4 keV is very different. There is weak diffuse extended emission in the north of the remnant, and two strong compact sources, Src A and B. Table 2 reviews the properties of the two sources. In Fig. 1, we also marked the weak extended hard X-ray emission with C. Both the Src A and B were observed by K97; Src A corresponds to the hard source named “HXF”, while Src B corresponds to the hard extended emission called “The Ridge” (also reobserved by Olbert et al. 2000, and detected by Preite-Martinez et al. 1999 as 1SAX J0618.1+2227). In the hard X-ray image in Fig. 1 we have also reported the contour of the molecular hydrogen line emissivity observed by Burton et al. (1988), which shows that the hard X-ray sources are closely correlated with it.


| Name | Count-rate111In the 4.0-10.0 keV energy range. | Position |
|---|---|---|
| (s-1) | (J2000) | |
| Src A | ||
| Src B |
In Fig. 2 we report the 4.0-10.5 keV profile of Src A and Src B compared with the MECS PSF profile in the same energy range. The PSF profile was derived from a BeppoSAX observation of the very bright point source Cyg X-1. Src A seems to be extended, while Src B is consistent with the expected PSF. The latter was reported as an elongated ridge by K97, but we note that the ASCA GIS pointing direction is such that the location of Src B is seen at large off-axis angle, which can account for most of source extension observed by ASCA. Instead, the BeppoSAX Src A and B are placed only at and off-axis, where the instrumental distorsion is at its minimum.
| Model | kT | ||
|---|---|---|---|
| keV | |||
| Src A | |||
| P.L. only | - | 34/41 | |
| Src B | |||
| P.L.+mekal | 41/33 | ||
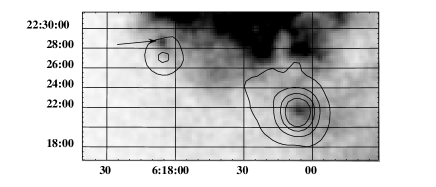
We have also investigated if Src A and Src B have soft X-ray counterpart using archive ROSAT observations. Fig. 4 is a PSPC 0.2-2.0 keV image of the region containing MECS Src A and B, with the MECS 4.0-10.5 keV contours of Fig. 1 (right panel) overimposed. Src A has an HRI counterpart quoted by K97 and the PSPC WGACAT source 1WGA J0617.1+2221 with a rate of cnt s-1 is located inside the BeppoSAX error circle. Src B has a weaker PSPC counterpart indicated by the arrow in Fig. 4, located north of the MECS source centroid and not reported in other PSPC catalogs. We have verified that the extended hard X-ray emission we have labelled with C in Fig 1 has a thermal origin and it represents the weak hard tail of the bright soft X-ray nebula visible in the PSPC image.
We have performed spectral fits of the MECS spectra of Src A and B using the mekal optically thin thermal plasma model modified by the interstellar absorption assuming the standard abundances. Spectra were extracted from circular regions with radii of and for Src A and B, respectively. We have used the IC443H observation for Src A and IC443E observation for Src B. Spectra have been rebinned to have at least 20 counts per channel. The MECS background was collected in an annulus between and for Src A, while we have used the standard background for Src B because no source-free background region could be found around it.
A thermal origin for the spectrum of Src A is strongly rejected (), while a power law model nicely fit the data (Table 3). The spectrum of Src B cannot be reproduced by a power law or by a thermal emission model alone ( 61/33 and 78/33 respectively) but requires a combination of the two, reported in Table 3.
We have also analyzed the PDS spectra. Background was subtracted using the OFF collimator positions; we have verified that no other contaminating sources are present in the background positions. Spectra were collected using the Variable Rise Time Threshold mode and have been rebinned following a logarithmic scheme suggested by the PDS hardware group to not undersample the instrument spectral resolution. Table 4 reports the observed countrates and flux in different energy ranges. A joint fit of Src A MECS spectrum and IC443H PDS spectrum (shown in Fig. 3) yields best-fit results similar to the ones reported in Table 3 and a PDS/MECS normalization ratio of . This value is consistent with the expected value of 1, also considering that the expected constribution of Src B in the PDS spectrum of IC443 could be up to . As for Src B, the joint fit yields a PDS/MECS ratio of , we argued that the PDS spectra of IC443E is heavily contaminated by the brighter Src A. In fact, using the best-fit model of Src A and considering the triangular spatial response of the PDS collimator, we predict a Src A contribution of cnt s-1 in the PDS spectra of Src B between 15 and 30 keV, consistent with the observed rate (Table 4). Therefore, a proper analysis of the PDS spectra of Src B cannot be done.

| Band | Count-rate | Flux (222Computed using the best-fit models and values reported in Table 3.) |
|---|---|---|
| keV | ( s-1) | erg cm-2 s-1 |
| Src A | ||
| 2–10 | ||
| 15–30 | ||
| 30–100 | ||
| 100-220 | ||
| Src B | ||
| 2–10 | 33347% mekal, 53% P.L. | |
| 15–30 | ||
| 30–100 | ||
3 Discussion
The compact hard X-ray features may be interpreted in terms of the interaction between the remnant shock and a molecular cloud. Bykov et al. (2000) have presented a model of non-thermal emission from an evolved SNR interacting with a molecular cloud, but the predicted diffuse hard X-ray emission in the MECS bandwidth is below the sensitivity threshold. On the other hand, several clumps have been observed in the molecular cloud near IC443. The spatial scales of the molecular clumps from IR line observations are in the range from 150′′ down to 1′′. The non-thermal X-rays from clumps were modelled by Bykov et al. (2000), who predicted a hard spectrum with a photon index below 2.0. The emission is originated from electrons of energy below 1 GeV. The predicted flux density is keV cm-2 s-1 keV-1 at 10 keV for a 30 shock in a clump of half parsec radius and density of 10. Using a power law with , this corresponds to MECS cnt s-1 in the 4.0–10.5 keV energy range and PDS cnt s-1 in the 15–30 keV. The predicted count-rates are consistent with the observed rate of Src B (Table 4), having in mind that cm-3 density is a representative number and other parameters could easily account for the difference. Because of hard spectrum and heavy absorption, localized spots of few arcmin size would be seen only in hard X-rays. Thus, the compact Src B correlated with bright spot of molecular hydrogen emission (Fig. 1) can be shocked molecular clump. The observed soft X-ray brightening having apparent shift from hard X-ray features towards the SNR interior (Fig. 4), can be attributed to the effects of the shocked clump edges. The morphology and the spectrum of the Src A are somewhat different from that of Src B.
As already discussed by K97, a low-luminosity pulsar nebula is a plausible explanation for isolated hard X-ray sources (especially for the slightly extended Src A), but we do not expect to see two of them in one SNR444However, Asaoka & Aschenbach (1994) pointed out that the soft X-ray emission is consistent with the presence of two large SNRs, and yr old.. High resolution Chandra or XMM data are needed to distinguish between pulsar nebula and shocked clump interpretation. We have also performed a timing analysis of MECS events collected inside a circle of radius in the 4.0–10.5 energy range for both Src A and B, and we found no pulsations at 99% confidence level, with an upper limit of the pulsed fraction of a sinusoidal signal in the Hz frequency range of 5% and 6%, respectively, more stringent than the one derived by K97 using ROSAT data.
We have also estimated the Src A and B EGRET -ray MeV flux contribution, using the best-fit models reported in Table 3, and they are and photons cm-2 s-1. The expected -ray flux of Src B therefore is compatible with the value of photons cm-2 s-1 observed by Esposito et al. (1996). Gamma-ray observations with forthcoming INTEGRAL mission with expecting angular resolution about 12′ could better constrain the spectrum of the sources above 30 keV.
Acknowledgements.
The authors thank M. Orlandini for his help in analyzing the PDS data and the referee (J.Keohane) for very constructive comments. The work of A.M.B was supported by the INTAS 96-0390 and INTAS-ESA 99-1627 grants. F.B. acknowledges an ESA Research Fellowship.References
Asaoka I., & Aschenbach B. 1994, A&A, 284, 573
Boella G., Chiappetti L., Conti G., et al., 1997, A&AS 122, 327
Baring M.G., Ellison D.C., Reynolds S.P., et al., 1999, ApJ, 513, 311
Burton M.G., Geballe T., Brand P., et al., 1988, MNRAS, 231, 617
Bykov A., Chevalier R., Ellison D., Uvarov, Yu., 2000, ApJ, 538, 203
Cesarsky D., Cox P., Pineau d. Forets G., et al., 1999, A&A, 348, 945
Chevalier, R.A. 1999, ApJ, 511, 798
Claussen M.J., Frail D.A., Goss W.M., et al., 1997, ApJ, 489, 143
Esposito J.A., Hunter S.D., Kanbach G., et al., 1996, ApJ, 461, 820
Frontera F., Costa E., Dal Fiume D., et al., 1997, A&AS 122, 371
Keohane J.W., Petre R., Gotthelf, et al., 1997, ApJ, 484, 350
Olbert C.M., Clearfield C.R., Williams N.E., Keohane J.W., & Frail D.A., 2000 (in preparation)
Petre R., Szymkowiak A.E., Seward F.D., et al., 1988, ApJ, 335, 215
Preite-Martinez A., et al. 1999, AIP Conf. Proc. 510, 73
Sturner S.J., Skibo J., Dermer, C. et. al. 1997, ApJ, 490, 617
van Dishoeck E.F., Jansen D., & Phillips T. 1993, A&A 279, 541
Wang Z.R., Asaoka I., Hayakawa S., et al., 1992, PASJ, 44, 303