Unlocking the Keyhole – H2 and PAH emission from molecular clumps in the Keyhole Nebula
Abstract
To better understand the environment surrounding CO emission clumps in the Keyhole Nebula, we have made images of the region in H2 1–0 S(1) (2.122 m) emission and polycyclic aromatic hydrocarbon (PAH) emission at 3.29 m. Our results show that the H2 and PAH emission regions are morphologically similar, existing as several clumps, all of which correspond to CO emission clumps and dark optical features. The emission confirms the existence of photodissociation regions (PDRs) on the surface of the clumps. By comparing the velocity range of the CO emission with the optical appearance of the H2 and PAH emission, we present a model of the Keyhole Nebula whereby the most negative velocity clumps are in front of the ionization region, the clumps at intermediate velocities are in it and those which have the least negative velocities are at the far side. It may be that these clumps, which appear to have been swept up from molecular gas by the stellar winds from Car, are now being over-run by the ionization region and forming PDRs on their surfaces. These clumps comprise the last remnants of the ambient molecular cloud around Car.
keywords:
ISM: clouds – globules: individual: Carina Nebula – ISM: molecules – kinematics and dynamics.1 Introduction
The Keyhole Nebula is part of the Carina Nebula, a star forming/giant
molecular cloud (GMC) complex, containing some of the most massive stars
known in our galaxy. It is bathed in the UV radiation field from the nearby
open star cluster, Tr 16. This cluster contains numerous O-type stars,
including three O3 stars [Walborn (1995)]. It is at a distance of 2.2 kpc
[Tovmassian (1995)] and is centred on one of the most massive stars known
– Car, which has a present day mass of about 120 M⊙ [Davidson &
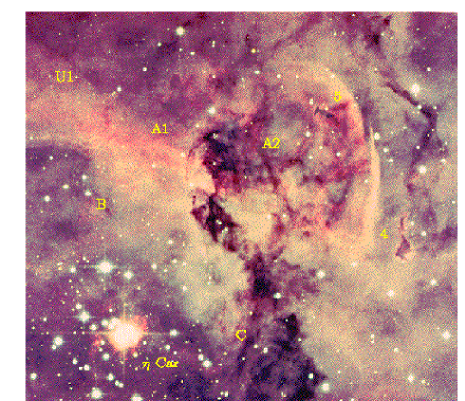
Humphreys (1997)]. The optical image of the Keyhole Nebula taken by
?) reveals many interesting features such as dark patches and
filaments, the most prominent being in the shape of an old-fashioned key
hole, which gave the nebula its name (see
Fig. 1a). ?) was the first to note
this peculiar feature and likened it to the shape of a
lemniscata”. Some of the smaller features also have bright rims. This
is beautifully illustrated in the recent colour-composite image taken with
NASA’s Hubble Space Telescope.111These data were collected by the
Hubble Heritage Team, N. R. Walborn, R. H. Barba and A. Caulet and were
released after the submission date of this article (see
http://oposite.stsci.edu/pubinfo/pr/2000/06/pr-photos.html).
The molecular gas in this region is highly inhomogeneous, breaking into several clumps which are all associated with the dark optical features [Cox & Bronfman (1995)]. The clumps, typically a few tenths of a pc across (10–30 arcsec) and with masses of M⊙ are distributed across a range of velocities (see Table 1). Some of the molecular clumps correspond to those optical features that have bright rims, suggesting the presence of photodissociation regions (PDRs) at the interface with the surrounding ionized gas. PDRs are regions where the far-UV radiation field dominates the heating and chemistry of the gas. They begin at the sharp ionized/neutral interface at the edge of molecular clouds and then extend well into the molecular gas (see [Tielens et al. (1993)]).
To better understand the environment surrounding these clumps we have imaged the Keyhole region at two wavelengths suitable for detecting emission from PDRs. We have used the University of New South Wales Infrared Fabry-Perot (UNSWIRF) to image H2 1–0 S(1) (2.122 m) emission and the SPIREX/Abu thermal infrared camera at the South Pole to image narrow-band emission at 3.29 m. This wavelength includes one of the more prominent ‘unidentified’ infrared (UIR) emission bands and is generally attributed to the C–H stretching mode of free polycyclic aromatic hydrocarbon molecules (PAHs) ([Léger & Puget (1984)], [Allamandola & Tielens (1985)], [Geballe et al. (1994)], [Joblin et al. (1995)]).
H2 1–0 S(1) emission in molecular clouds can be attributed to collisional excitation in the presence of shocks or to UV fluorescence in PDRs (see [Burton (1992)]). In dense gas, cm-3 where is the hydrogen nucleus density, UV excitation levels are collisionally redistributed leading to an increase in the population of the level. This subsequently increases the intensity of the =1–0 S(1) line (see [Allen et al. (1999)]). Previous observations of PDRs indicate that 3.29 m PAH emission zones are situated near the very edge of molecular clouds, peaking at the ionization front, while H2 1–0 S(1) emission zones extend further into the clouds by about 2 magnitudes of visible extinction (e.g. [Sloan et al. (1997)], [Tielens et al. (1993)], [Burton et al. (1989)]). So while H2 1–0 S(1) emission cannot be used alone to identify PDRs, if found to correspond to another PDR tracer (such as PAH emission) it can pinpoint regions of molecular gas that are high in density and exposed to the surrounding far-UV radiation field.
| Clump | Velocity | Mass | Optical |
| (km s-1) | (M) | Feature | |
| C | 6 | Faint | |
| B | 3 | Faint | |
| A1222Also known as the ‘Kangaroo Nebula’. | 14 | Bright rim | |
| A2 | – | – | Bright rim |
| 4 | 6 | Bright rim | |
| 5 | 1 | Bright rim | |
| 3 | 4 | Keyhole (dark) | |
| 1 | 17 | Keyhole (dark) | |
| 2 | 11 | Keyhole (dark) |
2 Observations
2.1 UNSWIRF observations
UNSWIRF [Ryder et al. (1998)] is a near-infrared tunable imaging spectrometer. It was used in conjunction with the Infrared Imager and spectrometer (IRIS) on the Anglo-Australian Telescope (AAT), and produces a circular field of 1.7 arcmin diameter at 0.77 arcsec pixel-1.
Images of H2 1–0 S(1) (2.122 m) emission towards the Keyhole region were obtained on 1996 April 24. A series of 30 pointings were made on a 1 arcmin grid at the wavelength of the 2.122 m line. An integration time of 60 s was used. An image of the sky was obtained after every five minutes, offset by 5 arcmin from the previous position. This entire sequence was repeated at 3–4 profile widths from the line centre in order to sample the corresponding continuum emission.
Bias subtraction and linearisation were performed during readout. All the object images were sky subtracted and then flat-fielded using normalised dome flat-fields. The continuum images, appropriately scaled, were then subtracted to leave just pure line emission in each. However, the strong emission from Car prevented a perfect subtraction and so residuals appear in the final image in frames containing Car. The continuum images were then combined into a mosaic sequence. A coordinate axis was added using a corresponding image obtained with the Digitised Sky Survey (see see http://skyview.gsfc.nasa.gov/cgi-bin/surv_comp.pl?dss) and the program koords [Gooch (1996)]. The same mosaic sequence and coordinate axis were then applied to the emission-line images. Observations of the spectroscopic standards BS 4013 and HD 105116 were used for the flux calibration and continuum scaling factors. The central wavelength measured varies by up to km s-1 between pixels ( of the FWHM). This can be corrected for by the use of a calibration lamp at closely-spaced etalon settings. Normally line images are then obtained by measuring at several plate spacings (typically 3–5) and fitting the instrumental profile to the line. However, because of the considerable overheads this incurs, this was not attempted for the mapping mode of operation used here. We estimate this introduces an uncertainty of per cent in the line fluxes. The seeing throughout the observations was 1.5 arcsec which, combined with tracking errors and co-addition of frames, produced a positional uncertainty of 2.5 arcsec. The final image has a rms of erg s-1 cm-2 pixel-1.
2.2 SPIREX/Abu observations
SPIREX is a 60-cm telescope commissioned in 1994 for operation at the South Pole [Herald et al. (1990)]. It was equipped in 1998 with the NOAO Abu IR camera [Fowler et al. (1998)], which incorporates an engineering grade ‘Aladdin’ InSb detector array able to image a circular field of view of diameter 10.2 arcmin with a 0.6 arcsec pixel scale.
Observations were carried out on 1998 November 11 (during daylight) using the narrow-band PAH filter. The response curve of this filter covers 3.262 – 3.336 m and is centred on 3.299 m, with a half-power width of 0.074 m. An integration time of 30 s was used for each frame. The overlapping region from a total of 52 frames was used to obtain a final image of 9 arcmin in diameter. The observing sequence consisted of 5 sky frames followed by 10 object frames. All frames were dark subtracted and flat-fielded. For the sky subtraction, a scaled median of the 6 nearest frames, regardless of their actual image type, were subtracted from each object image. The final image contains both PAH emission and continuum emission. A coordinate axis was added using a corresponding image obtained with the Digitised Sky Survey and the program koords.
Observations of the standard star, Dor, observed 1998 November 19, were used for flux calibration (L band magnitude of 3.711 mag). We estimate the PAH fluxes to have an uncertainty of per cent. The diffraction limit at 3.3 m of the telescope is 1.4 arcsec, comparable to the typical ice-level seeing of the site. However, a combination of tracking errors, tower shake and co-addition of frames limited the pointing accuracy to 2.8 arcsec. The final image has a rms noise of erg s-1 cm-2 pixel-1.
The observed wavelength range includes the Pf hydrogen recombination line. From the peak Br emission flux measured towards the southern edge of clump A1 ( erg s-1 cm-2 arcsec-2) and the calculated relative intensities of the Pf and Br emission lines (0.26 for the case of N cm-3 and T K, as listed in Table 6 of [Hummer & Storey (1987)]), we estimate the emission from Pf is less than erg s-1 cm-2 arcsec-2. This value is the same as the rms uncertainty of the final 3.29 m image and therefore we assume that the contribution from the Pf line is negligible.
3 Results
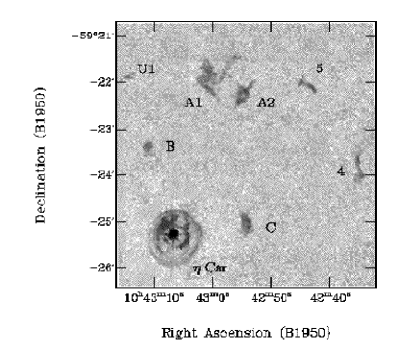
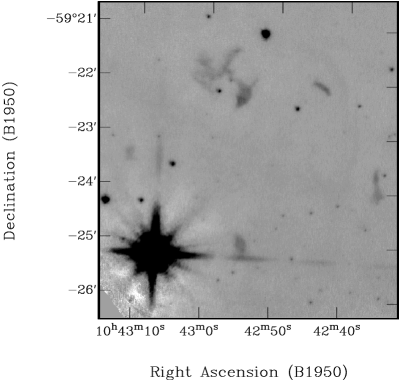
Fig. 1(b) shows a map of the H2 emission towards the Keyhole Nebula. The emission is distributed into seven discrete clumps of less than 1 arcmin in size spread over an area of arcmin2. Each emission feature corresponds to a 12CO(2–1) emission clump identified by ?) and has been labelled accordingly, with the exception of the faint H2 emission clump located in the north-eastern edge of the image which we have labelled U1. No CO observations have been made towards this clump. Fig. 1(c) shows an image of the PAH emission over the same region of sky. The emission is also distributed into clumps, all of which (except clump U1) can be matched almost exactly with H2 emission clumps. This confirms the H2 emission is caused by UV fluorescence and that the clumps are surrounded by PDRs. Table 2 lists the peak position, peak intensity, total integrated intensity and size of each H2 emission clump as well as the corresponding PAH peak intensity and total integrated intensity.
| Clump | H2 Peak position | H2 Peak 333H2 image has a 1 rms of erg s-1 cm-2 arcsec-2 | PAH Peak 444PAH image has a rms of erg s-1 cm-2 arcsec-2 | Size | H2 Total | PAH Total | PAH/H2 | |
|---|---|---|---|---|---|---|---|---|
| Intensity | Intensity | Intensity | Intensity | Ratio | ||||
| RA | DEC | ( erg s-1 | ( erg s-1 | \arcsec \arcsec | ( erg | ( erg | ||
| (1950) | (1950) | cm-2 arcsec-2) | cm-2 arcsec-2) | s-1 cm-2) | s-1 cm-2) | |||
| A1 | 10 43 01 | 22 05 | 2.1 | 5.8 | 9.9 | 33 | 33 | |
| A2 | 10 42 54 | 22 09 | 2.7 | 8.1 | 5.5 | 24 | 44 | |
| B | 10 43 11 | 23 20 | 1.8 | 4.7 | 1.8 | 3.6 | 20 | |
| C | 10 42 54 | 25 06 | 2.8 | 6.6 | 4.4 | 11 | 25 | |
| 4 | 10 42 35 | 23 42 | 2.2 | 2.8 | 3.7 | 9.1 | 25 | |
| 5 | 10 42 43 | 22 06 | 2.5 | 5.3 | 2.3 | 7.5 | 33 | |
| U1 | 10 43 14 | 21 53 | 1.7 | 0.7 | 5553 upperlimit | |||
Fig. 2 shows the PAH emission in grey-scale overlaid with contours of H2 emission for clumps A1666We have dubbed clump A1 the ‘Kangaroo Nebula’ owing to its morphological resemblance to an Antipodean marsupial, see Ryder et al. (1998)., A2, 4, 5, B and C . The overall distribution of the H2 and PAH emission is similar for all the clumps, however, there are small-scale differences. The emission is not uniform but exhibits many small bright knots and in some cases the H2 emission knots do not correspond to PAH emission knots. This is to be expected considering that the H2 and PAH emission zones within a PDR may not completely coincide with one another. The bright H2 and PAH emission knots are pinpointing high-density regions at different UV optical depths within the molecular clumps.
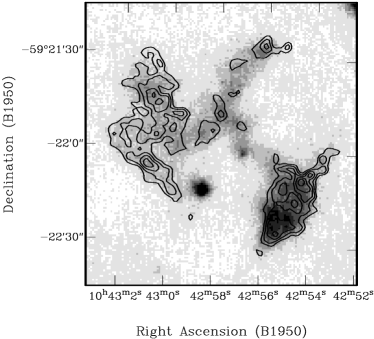
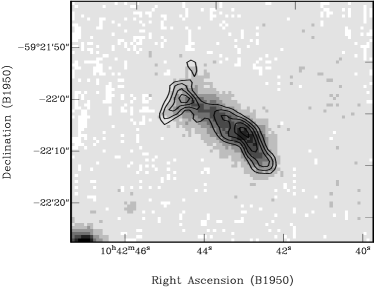
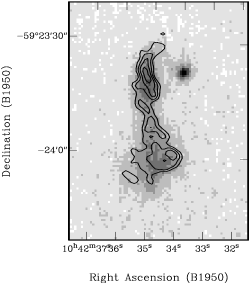
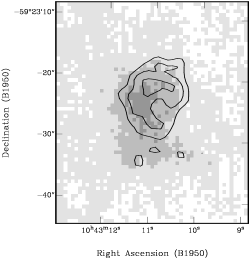
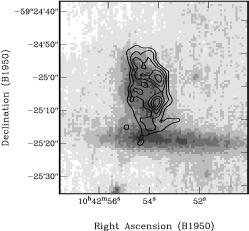
The ratio of the PAH total intensity to the H2 1–0 S(1) total intensity is reasonably consistent from clump to clump. Clump A2 has the highest ratio (44), while clump B has the lowest (20).
4 Discussion
4.1 Geometry
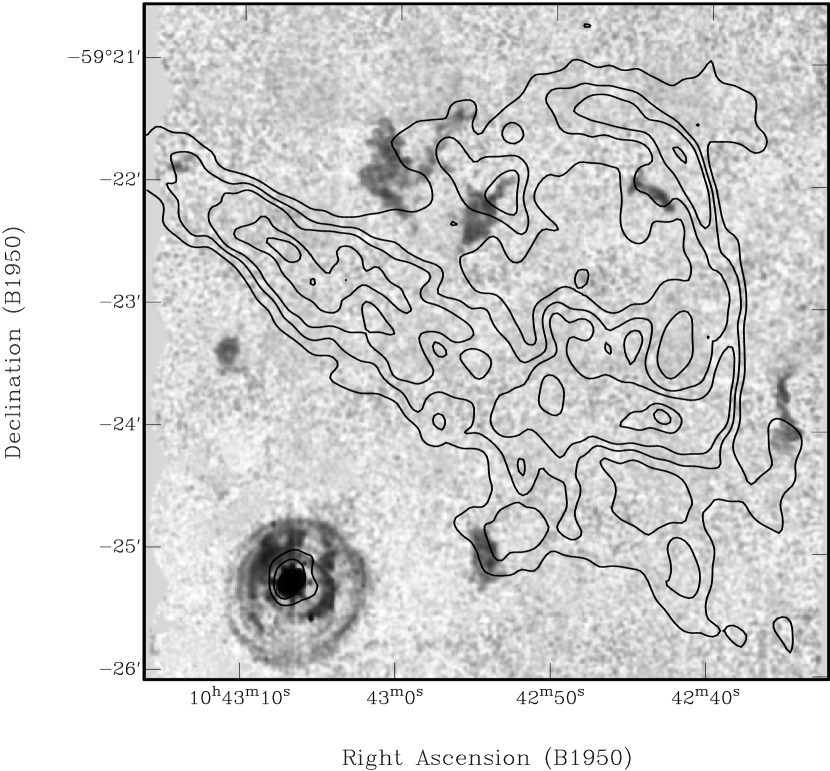
Fig. 3 shows the grey-scale H2 emission superimposed with the 4.8-GHz radio continuum emission from Brooks et al. (in preparation). The H2 clumps are distributed around the edges of the continuum emission. The absence of the Keyhole structure in the radio continuum emission indicates that the Keyhole is in the foreground of the nebula and obscuring it.
When comparing the H2 and PAH emission with the optical emission of Fig. 1(a) it appears that all the emission clumps correspond to dark optical features. Clumps A1, A2, 4 and 5 correspond to prominent patches which have bright rims, while clumps B and C coincide with very faint, filamentary patches. It is worth noting that no H2 or PAH emission was detected towards the most prominent optical obscuration—the Keyhole itself, or towards the boomerang-shaped filament to the western edge of the image. Neither of these latter two dark features appears to have a bright rim, unlike clumps A1, A2, 4 and 5.
The Keyhole has been traced in 12CO(2–1) emission by ?) and corresponds to clumps 1, 2, and 3 (see Table 1). These three clumps are the only molecular clumps detected by ?) which show no H2 or PAH emission.
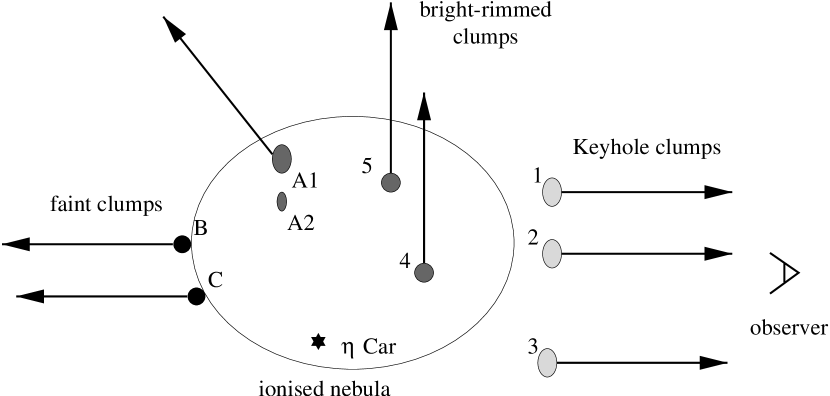
As listed in Table 1, the velocities with respect to the local stand of rest (LSR) of the molecular clumps taken from their 12CO(2–1) emission vary from to km s-1. When comparing these velocities with the clump’s corresponding optical, PAH and H2 emission features there appears to be an interesting trend. Firstly, the clumps with the most negative velocities (clumps 1, 2, and 3) are those which have the most prominent optical obscuration and also are the only clumps with no associated PAH and H2 emission. Secondly, those clumps with intermediate velocities (clumps A1, A2, 4 and 5) correspond to the optical features with bright rims. Thirdly, the clumps which have the least negative velocities (clumps B and C) correspond to the very faint patches. Using these results we present a model for the Keyhole Nebula whereby the velocities of the clumps are associated with positions along our line of sight; clumps 1, 2, and 3 (the Keyhole) are in front of the nebula, clumps A1, A2, 4 and 5 are in it and clumps B and C are located at the far side. This model is represented schematically in Fig. 4.
Radio recombination-line observations of the ionized gas in this region (Car II) reveal a complex velocity structure which has been interpreted as an expanding shell centred close to Car ([Huchtmeier & Day (1975)], [Deharveng & Maucherat (1975)]). There are two main velocity components whose relative fluxes vary across the region; one having LSR velocities between to km s-1; and the other having LSR velocities between to km s-1. These velocities are consistent with clumps A1, A2, 4 and 5 (i.e. those with bright rims), which have LSR velocities between and km s-1, being located in the ionized region and the remaining clumps, with LSR velocities near and km s-1, being situated at the far and near side, respectively. The systematic LSR velocity of Car is taken to be km s-1, similar to the other O-type stars in the region [Davidson et al. (1997)], placing it in the middle of the range.
4.2 Dynamics
It is generally thought that the strong stellar winds from the massive stars belonging to Tr 16, in particular Car, are responsible for the complex dynamics of the ionized and molecular gas in the Keyhole region (e.g. [Cox & Bronfman (1995)], [Cox (1995)] and [Deharveng & Maucherat (1975)]). Here we extend the analysis of previous studies to include a better estimate of the mechanical luminosity associated with Car and the energy conversion efficiency factor required to sustain the kinetic energy of a typical clump.
The kinetic energy of a typical clump, KC, with a mass of 10 M⊙ and a velocity of 10 km s-1, is of the order 1046 erg. We can equate this value with the mechanical luminosity, LW, of the stellar wind of Car using, KC LW , in order to obtain the required conversion efficiency factor, . We estimate the solid angle, , of a typical clump of cross-section 1 arcmin located 3.5 arcmin from Car is . The mechanical luminosity of the wind for Car, using a mass-loss rate of M⊙ yr-1 [Davidson & Humphreys (1997)] and a wind velocity of 700 km s-1 [Lamers (1989)] is erg. If we take the time period, , to be equal to the passage time across the ionized nebula, years (2 arcmin at 10 km s-1), then the efficiency factor need only be per cent.
In practice is likely to be very much less than 105 years, as the clumps will rapidly decelerate as they sweep up material. We estimate its value following ?). They show that the radius of a stellar wind-blown bubble is given by (L. For a typical clump-mass of 10 M⊙, the required density () of the swept-up gas is 000 cm-3. This yields years for the Car wind which leads to a required efficiency factor of per cent. This efficiency factor is still much less than the 20 per cent efficiency factor estimated by ?) for this process for a steady wind.
Thus, the kinetic energy of the clumps can readily be explained by the mechanical energy of a wind from Car. We conclude that the clumps represent swept-up ambient cloud material which is being driven out of the ionized region by such a wind. In this scenario we would expect the swept-up mass of each clump to be much greater than its wind mass (given by ). Substituting the figures above, we obtain 0.003 M⊙ for the wind mass, considerably less than the typical swept-up mass of 10 M⊙, as expected.
4.3 Excitation
The morphology of the H2 and PAH emission strongly suggests that UV fluorescence is responsible for the excitation. This conclusion can be quantitatively tested by comparing the observed fluxes with those expected for the physical conditions within the nebula.
We first estimate the ionizing (hv = 13.6 eV ) and far-UV (hv = 6 eV 13.6 eV) fluxes incident on clump A1 (taken to be 1 arcmin across), from both Car (3.5 arcmin away) and the O3 star HD 303308 (2.8 arcmin away). HD 303308 is taken to have Teff 47 500 K and radius cm, following ?). Using Kurucz’s (1997) model stellar spectra we find FUV = 0.34 erg s-1 cm-2 and FFUV = 0.26 erg s-1 cm-2. The spectral type of Car is uncertain. Based on the observations of ?) at wavelengths longer than 1 m, its luminosity has been estimated by ?) to be L⊙. At such high luminosities, blackbody and Kurucz models indicate that we can assume the bulk of the flux is distributed over the ionizing and far-UV wavelengths and that FUV FFUV. Using a stellar radius of cm [Davidson & Humphreys (1997)] we find that for Car FUV FFUV 13 erg s-1 cm-2, which is considerably greater than the corresponding fluxes from HD 303308.
We thus estimate the total number of ionizing UV photons incident on clump A1 is N photons s-1 and are mostly from Car. This number is an upper limit, and may be reduced if either internal extinction is present or the distance from the source is greater than its projected value. We have obtained an additional observation of Br emission at 2.166 m using UNSWIRF. The total Br flux from a region covering 0.7 arcmin2, adjacent to the northwest-southeast edge of clump A1, is erg s-1 cm-2. From this, assuming that each Lyman-continuum photon produces 70 Br photons, we derive N photons s-1, remarkably similar to our estimate based on the stellar luminosities.
We estimate the total far-UV radiation field on clump A1 is F erg s-1 cm-2, which is equivalent to 000G0, where G erg s-1 cm-2 and is the average interstellar radiation field [Habing (1968)]. Using a far-UV radiation field of G0 and density of 104 cm-3, PDR models (e.g. [Burton et al. (1990)]) predict an H2 1-0 S(1) line flux of erg s-1 cm-2 sr-1, which, integrated over a 1 arcmin region, gives a total line flux of erg s-1 cm-2. This is remarkably similar to that measured from clump A1, erg s-1 cm-2 (Table 2). Furthermore, if the density were cm-3 the prediction would be a factor of 10 smaller, while if the density were 105 cm-3 it would be a factor of 5 higher. A density of 104 cm-3 is consistent with CO and CS observations towards clump A1 by ?), which suggest a value in excess of cm-3.
A typical clump with a surface area of 1 arcmin2, hydrogen molecule density of cm-3 and mass of 10 M⊙ yields an emitting thickness, Av 1 (in a direction away from the exciting star) of cm (4 arcsec at 2.2 kpc). This order of magnitude calculation implies widths similar to those observed for the elongated clumps, 4 and 5, suggesting that they are seen edge-on. These two clumps and the larger clumps, A1 and A2, are thought to be situated inside the region (see Fig. 4). Clumps 4 and 5 may be moving edge on, in the plane of the sky, and clumps A1 and A2 may be moving mostly face on, away from us.
The emission measure, n L, derived from the Br line flux is cm-6 pc. Taking a typical clump thickness as representative of L gives L arcsec (or 0.03 parsec based on the above estimate). This yields an electron density, ne cm-3 for the ionized gas, which is intermediate in value between the estimates for the initial density and that swept-up in the clumps. The emission measure is also consistent with the value of cm-6 pc obtained from measurements of the 4.8 GHz continuum emission over the same region (Brooks et al., in preparation).
The H2 and Br line emission are thus consistent with UV excitation, from Car. The clumps themselves are swept-up cloud material, likely driven by the mechanical luminosity of a strong wind from Car. This wind is strong enough to also produce shocked H2 emission. Since there is now no clear evidence for any such emission this wind cannot still be interacting with the clumps. The clumps must currently be coasting while being externally heated by the radiation field from the nearby stars. Considering the episodic events of Car’s evolution the current state of the clumps may only represent a quiescent stage in their life and they may be overrun in the future by another fast stellar wind from Car, resulting in shocked emission. This type of variability however would be on time scales of the order of 1 000 years, considerably longer than the observed 5.54-year brightness fluctuation cycle of Car [Damineli et al. (1997)].
It is possible to estimate the number of PAH molecules that are emitting from the surfaces of the clumps, using their 3.29 m flux and the incident far-UV radiation field. Following Fig. 13 of ?), the typical energy emitted in the 3.3 m band by a PAH molecule, excited via far-UV fluorescence to 30 000 cm-1 of vibrational energy, is erg s-1 molecule-1 sr-1. For an incident far-UV field, G, there are photons cm-2 s-1. Taking a typical absorption cross-section for a PAH molecule of cm2 per C atom (Tielens, private communication), then for a typical 50-atom PAH molecule we expect an excitation rate of s-1, or about one excitation each hour. This energy is rapidly re-emitted through infrared fluorescence in the various PAH emission bands, including the 3.3 m band. For the peak 3.29 m flux of erg s-1 cm-2 sr-1 measured from clump A1, we thus derive an emitting PAH column density of cm-2 from this region. These estimates show that a significant fraction of the C-atoms may reside in PAH molecules. For instance, if the PAH emitting region were confined to an optical depth Av 0.1 from the front surface of the cloud, it would imply a C-abundance in the PAH molecules of relative to hydrogen, or around 30 per cent of the total carbon, assuming typical interstellar carbon abundances.
If the rate of destruction of H2 molecules by far-UV radiation exceeds their formation rate on dust grains, it is possible that photodissociation equilibrium will not exist in the molecular clumps. For instance, ?) derive a characteristic time-scale of years to establish equilibrium. This translates to years using the densities derived here, which is greater than the assumed age of years for the wind. If this were the case the ionization-dissociation front impinging on the clumps will constantly be exposing fresh molecular material to the radiation field and the fluorescent line intensities will be higher than steady-state model predictions. However the front, moving at perhaps km s-1, would not have had time to propagate through the clumps. If photodissociation equilibrium does not exist we would expect the ratio of the =1–0/2–1 S(1) lines to preferentially show pure fluorescent values () where the =1–0 S(1) line is strongest (see [Allen et al. (1999)]). This could be tested with further observations.
5 Conclusions
We have imaged the Keyhole region of the Carina Nebula in the H2 1-0 S(1) line at 2.122 m and in the PAH emission feature at 3.29 m, and compared the results to optical, radio continuum and 12CO(2–1) images of the region. The H2 and PAH images are remarkably similar, indicating they are fluorescently excited, and show a series of emission clumps typically 30–60 arcsec in extent distributed around the edges of the radio emission. When compared to the optical and CO images three categories of clumps are apparent: (i) dark regions of optical obscuration with CO but no H2 or PAH emission (clumps 1, 2, and 3 which form the Keyhole feature), (ii) faint, optically dark clumps with bright rims and H2 and PAH emission (clumps A1, A2, 4 and 5) and (iii) faint optically dark clumps with H2 and PAH emission (clumps B and C).
The clumps are typically of mass 10 M⊙ and appear to have been swept up from ambient cloud material by a wind from Car. They have been driven in all directions away from Car, and must now be coasting at speeds of 10 km s-1 as there is no evidence of any shocked emission. The prominent dark clumps of the Keyhole are coming towards us and are outside the region. The bright-rimmed clumps A1, A2, 4 and 5 are within the region and thus are being heated by the radiation field. Clumps such as A1 are seen face-on whereas clumps 4 and 5 are seen edge-on. Finally the faint dark clumps B and C are on the far side of the region and have been driven away from Car in the opposite direction to ourselves. The clumps comprise the last remnants of the ambient molecular cloud from which Car formed.
6 Acknowledgements
We would like to thank Lori Allen, Stuart Ryder and John Whiteoak for their help during the observations, and Rodney Marks and members of CARA (the Center for Astrophysical Research in Antarctica), in particular Al Fowler and Al Harper, for obtaining the SPIREX/Abu data. We thank David Malin for providing the colour image of the Keyhole Nebula and Xander Tielens for useful discussions concerning PAH abundances. We are grateful to Stuart Ryder for the UNSWIRF reduction software. We also thank Pierre Cox for helpful comments regarding the manuscript. KJB acknowledges the support of an Australian Post-graduate Award. This work has been supported by a grant from the Australian Research Council.
References
- Allamandola & Tielens (1985) Allamandola L. J., Tielens A. G. G. M., 1985, ApJ, 290, L25
- Allamandola et al. (1989) Allamandola L. J., Tielens A. G. G. M., Barker J. R., 1989, ApJS, 71, 733
- Allen et al. (1999) Allen L. E., Burton M. G., Ryder S. D., Ashley M. C. B., Storey J. W. V., 1999, MNRAS, 304, 98
- Burton (1992) Burton M. G., 1992, Aust. J. Phys, 45, 463
- Burton et al. (1990) Burton M. G., Hollenbach D. J., Tielens A. G. G. M., 1990, ApJ, 365, 620
- Burton et al. (1989) Burton M. G., Moorhouse A., Brand P. W. J. L., Roche P. F., Geballe T. R., 1989, in Interstellar Dust: contributed papers, I.A.U. Symposium 135, eds Allamandola L.J., Tielens. A.G.G.M. NASA CP-3036, p. 87
- Cox (1995) Cox P., 1995, RevMexAA (Serie de Conferencias), 2, 105
- Cox & Bronfman (1995) Cox P., Bronfman L., 1995, A&A, 299, 583
- Cox et al. (1995) Cox P., Mezger P. G., Sievers A., Najarro F., Bronfman L., Kreysa E., Haslam G., 1995, A&A, 297, 168
- Damineli et al. (1997) Damineli A., Conti P. S., Lopes D. F., 1997, New Astronomy, 2, 107
- Davidson et al. (1997) Davidson K., Ebbets D., Johansson S., Morse J. A., Hamann F. W., Humphreys R. M., Weiglet G., Frank A., 1997, ApJ, 113, 335
- Davidson & Humphreys (1997) Davidson K., Humphreys R. M., 1997, ARA&A, 35, 1
- Deharveng & Maucherat (1975) Deharveng L., Maucherat M., 1975, A&A, 41, 27
- (14) DSS, see http://skyview.gsfc.nasa.gov/cgi-bin/surv_comp.pl?dss
- Dyson & Williams (1997) Dyson J. E., Williams D. A., 1997, The physics of the interstellar medium. Institute of Physics Publishing, Bristol
- Fowler et al. (1998) Fowler A. M. et al., 1998, Proc. SPIE, 3354, 1170
- Geballe et al. (1994) Geballe T. R., Joblin C., d’Hendecourt L., Jourdain de Muizon M., Tielens A. G. G. M., Léger A., 1994, ApJ, 434, L15
- Gooch (1996) Gooch R., 1996, in Jacoby G. H., Barnes J., ed, Astronomical Data Analysis Software and Systems V, Vol. 101. ASP Conference Series, San Francisco, p. 80
- Habing (1968) Habing H. J., 1968, Bull. Astr. Inst. Netherlands, 19, 421
- Herald et al. (1990) Hereld M., Rauscher B. J., Harper D. A., Pernic R. J., 1990, Proc. SPIE, 1235, 43
- Herschel (1847) Herschel J. F. W., 1847, in Results of Astronomical Observations Made During the Years 1834-1888 at the Cape of Good Hope, Smith Elder, London, p. 153
- Hollenbach & Natta (1995) Hollenbach D., Natta A., 1995, ApJ, 455, 133
- Huchtmeier & Day (1975) Huchtmeier W. K., Day G. A., 1975, A&A, 41, 153
- Hummer & Storey (1987) Hummer D. G., Storey P. J., 1987, MNRAS, 224, 801
- Joblin et al. (1995) Joblin C., Tielens A. G. G. M., Allamandola L. J., Léger A., d’Hendecourt L., Geballe T. R., Boissel P., 1995, Planet. Space Sci., 43, 1189
- Kurucz (1997) Kurucz R., 1997, in Fundamental Stellar Properties, Proceedings of IAU Colloquium No. 189, eds Bedding T. R., Booth J., Davis J., Dordrecht Kluwer Academic Publishers, p. 217
- Lamers (1989) Lamers H. J. G. L. M., 1989, in Davidson K., Moffat A. F. J., Lamers H. J. G. L. M., ed, The Physics of Luminous Blue Variables. Kluwer, Dordrecht, p. 135
- Léger & Puget (1984) Léger A., Puget J. L., 1984, A&A, 137, L5
- Malin (1993) Malin D., 1993, A View of the Universe. Cambridge University Press, pages 104, 155
- Panagia & Walmsley (1978) Panagia N., Walmsley C. M., 1978, A&A, 70, 411
- Ryder et al. (1998) Ryder S. D., Sun Y.-S., Ashley M. C. B., Burton M. G., Allen L. E., Storey J. W. V., 1998, PASA, 15(2), 228
- Sloan et al. (1997) Sloan G. C., Bregman J. D., Geballe T. R., Allamndola L. J., Woodward C. E., 1997, ApJ, 474, 735
- Tielens et al. (1993) Tielens A. G. G. M., Meixner M. M., van der Werf P. P., Bregman J., Tauber J. A., Stuzki J., Rank D., 1993, Science, 262, 86
- Tovmassian (1995) Tovmassian H. M., 1995, RevMexAA (Serie de Conferencias), 2, 83
- Walborn (1995) Walborn N. R., 1995, RevMexAA (Serie de Conferencias), 2, 51