ASCA Observation of an X-Ray-Luminous Active Nucleus in Markarian 231
Abstract
We have obtained a moderately long ( second) ASCA observation of the Seyfert 1 galaxy Markarian 231, the most luminous of the local ultraluminous infrared galaxy (ULIRG) population. In the best-fitting model we do not see the X-ray source directly; the spectrum consists of a scattered power-law component and a reflection component, both of which have been absorbed by a column . About of the observed hard X-rays arise from the scattered component, reducing the equivalent width of the iron K line. The implied ratio of keV X-ray luminosity to bolometric luminosity, , is typical of Sy 1 galaxies and radio-quiet QSOs of comparable bolometric luminosities, and indicates that the bolometric luminosity is dominated by the AGN. Our estimate of the X-ray luminosity also moves Mrk 231 in line with the correlations found for AGN with extremely strong Fe II emission. A second source separated by about 2 arcminutes is also clearly detected, and contributes about of the total flux.
1 Introduction
Sixteen years ago, the IRAS all-sky survey revealed the existence of a class of objects which emit nearly all of their energy at far-infrared wavelengths (Soifer et al. 1984). At the high-luminosity end of the distribution, , the so-called “ultraluminous infrared galaxies” (ULIRGs), the space density of such objects is approximately twice that of optically-selected QSOs, the only objects with comparable bolometric luminosities (Sanders & Mirabel 1996). The far-infrared energy distributions of the prototype objects, Arp 220 and NGC 6240, are very similar to that of the classic starburst galaxy M82, peaking at m, and do not exhibit the “warm” IRAS colors typical of Seyfert galaxies (DeGrijp et al. 1992). A large fraction of the ultraluminous galaxies show evidence for interaction or merging with a companion galaxy (Sanders et al. 1988; Melnick & Mirabel 1990), and most show luminous molecular line emission, indicating substantial quantities of molecular gas, which could potentially fuel either a burst of star formation or an AGN (e.g., Sanders & Mirabel 1996, and references therein).
Ever since the discovery of this class of galaxies debate has raged over the nature of the dominant source of energy. The failure to detect any of the ULIRGs at X-ray wavelengths with HEAO-1 (Rieke 1988) strengthened a starburst interpretation, as did the recent failure of the OSSE instrument on the GRO to detect Arp 220, Mrk 231, or Mrk 273 in the keV energy range (Dermer et al. 1997); this rules out very luminous Compton-thin sources in these galaxies. Most recently, observations of a number of ULIRGs with the short-wavelength (SWS) spectrometer on the Infrared Space Observatory failed to detect any high-excitation lines in the mid-infrared, as might be expected from even a dust-shrouded AGN (Sturm et al. 1996; Genzel et al. 1998), and this has been taken to be evidence for starbursts rather than AGN. However, it is now clear that in many ULIRGs the column densities toward the nucleus are so high that the dust optical depth is greater than unity even in the mid-IR. Furthermore, the discovery of Compton-thick X-ray sources in a number of ULIRGs, notably including NGC 6240 (Iwasawa & Comastri 1998; Vignati et al. 1999), substantially weakens the argument against AGN-dominated sources based on hard X-ray non-detections. Such sources, in which even hard X-rays are seen only through reflection, are characterized by a relatively flat continuum above keV and very large equivalent widths of the iron line, exceeding 1 keV (e.g., Krolik & Kallman 1987; Krolik, Madau & Życki 1994; Matt, Brandt, & Fabian 1996). Such large equivalent widths can be produced only if the X-ray continuum incident on the line-emitting region is much larger than that which we observe. If the reflected fraction in NGC 6240 is similar to that in NGC 1068, the bolometric luminosity of the AGN is of order erg s-1, and dominates the far-infrared output of the galaxy.
Foremost among the local ULIRGs is Markarian 231 () , which is the most luminous object in the local universe () (Soifer et al. 1984). Its bolometric luminosity is ( km s-1 Mpc-1), nearly all of which emerges in the far-infrared. Although classified as a Seyfert 1, Mrk 231 shows evidence for substantial amounts of reddening (: Boksenberg et al. 1977) and when corrected for extinction its optical luminosity approaches quasar levels. Furthermore, Mrk 231 exhibits many features characteristic of (low ionization) Broad Absorption Line (BAL) QSOs: high optical polarization ( at 2800Å, Smith et al. 1995), strong Fe II emission (extremely strong in Mrk 231) (Boksenberg et al. 1977), red optical colors, and a large IR/optical flux ratio. ASCA and ROSAT observations of Mrk 231, analyzed by Iwasawa (1999) and Turner (1999), revealed an extended, soft X-ray component, with a luminosity , and a hard component exhibiting considerable absorption, with a 2-10 keV luminosity of only . If this is the intrinsic X-ray luminosity, then an AGN is unlikely to dominate the energetics unless Mrk 231 is X-ray-quiet. However, the signal-to-noise of the ASCA spectrum was too low to determine whether the observed X-ray emission is largely reflected, in which case the true X-ray luminosity could be much higher.
In this letter, we present an analysis of a much deeper ASCA observation of Mrk 231 than that presented by Iwasawa. We find strong evidence for a powerful, buried AGN in this ULIRG which we observe only through reflection and scattering. Indeed, we show that the AGN in Mrk231 may well be the dominant energy source.
2 Observation and Data Reduction
Mrk 231 was observed by ASCA on 1999-Nov-10. The SIS data were cleaned in order to remove the effects of hot and flickering pixels and subjected to the following data-selection criteria : i) the satellite should not be in the South Atlantic Anomaly (SAA), ii) the object should be at least 7 degrees above the Earth’s limb, iii) the object should be at least 25 degrees above the day-time Earth limb, and iv) the local geomagnetic cut-off rigidity (COR) should be greater than 6 GeV/c. We also applied a standard grade selection on SIS events in order to further minimize particle background. The GIS data were cleaned to remove the particle background and subjected to the following data-selection criteria : i) the satellite should not be in the SAA, ii) the object should be at least 7 degrees above the Earth’s limb and iii) the COR should be greater than 7 GeV/c. After these data selection criteria were applied, there are 96.3 ksec of good data per SIS detector and 99.2 ksec of good data per GIS detector.
Full-band images were extracted from each of the four ASCA detectors. Two point-like X-ray sources were found in the SIS image separated by 2 arcmin, with the dominant source (containing about 75% of the counts) coincident with Mrk 231. The GIS has insufficient spatial resolution to distinguish these sources. We extracted the SIS spectrum of each source and found them to have very similar shapes. Given that the fainter source does not dominate at any energy, and that detailed spectroscopy on these small scales is difficult due to the energy-dependent point spread function of ASCA, we chose to extract and analyze the combined spectrum of these sources (which is dominated by Mrk 231).
Source photons were extracted from a circular region centered on the two sources with radii of 3 arcmin and 4 arcmin for the SIS and GIS respectively. Background spectra were obtained from blank regions of the same field (using the same chip in the case of the SIS). No temporal variability was observed. In order to facilitate spectral fitting, all spectra were rebinned so as to contain at least 20 photons per spectral bin. In order to avoid poorly calibrated regions of the spectrum, the energy ranges considered were 1.0–10 keV for the SIS detectors, and 0.8–10 keV for the GIS detectors. Note that we use a lower-energy cutoff for the SIS that is considerably higher than the ‘standard’ 0.6 keV cutoff in order to avoid the effects of “residual dark current distribution”, or RDD, which is known to plague recent ASCA observations.
3 Spectral Analysis
Iwasawa (1999) finds evidence for soft X-ray emission from thermal plasma and measures a temperature of and an abundance of . Since we deem our soft () SIS data to be unusable, we cannot constrain the nature of the thermal plasma component. Therefore, in all that follows, we constrain the parameters of the thermal component ( and ) to the 90% error range found by Iwasawa.
Guided by Iwasawa (1999), we initially fit our SIS & GIS spectrum (Figure 1) with a model consisting of this thermal component and a power-law tail with photon index (representing the AGN emission), all absorbed by the Galactic column of . Although this spectral model produced an adequate goodness of fit (), the resulting photon index was extremely flat (). In particular, it is much flatter than the intrinsic spectrum of any known AGN (which usually have ). Adding intrinsic absorption to the power-law component increases the permitted photon index by (with for 1 new parameter) — insufficient to bring into the acceptable AGN range.
Since this AGN is likely to be highly obscured, we also examined classes of models in which the central power-law is completely absorbed by a Compton-thick screen, and is only seen via scattering and Compton reflection. In practice, we used the pexrav models within the xspec package, interpreting finite reflection fractions as representing mixed reflection/scattering (i.e., scattering of non-reflected as well as reflected continuum into our line of sight). A model consisting of this reflected/scattered component and the thermal plasma produced a good fit () and implied a reflection-dominated spectrum (with the reflection fraction ). However, the implied intrinsic power-law was much steeper () than the normal AGN range.
Physically acceptable results are produced when absorption of the reflected/scattered component is included. While this absorption is not statistically required, including a column of extends the range of allowable photon indices into the typical AGN range. In order to better constrain the fits, we hereafter assume that the hard X-ray photon index of the source is typical of radio-quiet AGN, . We also include a narrow iron K emission line of cold iron which is expected to accompany the X-ray reflection. The best fitting parameters (with 90% error range) are then: , , and an iron line equivalent width of (with ); the resulting model spectrum is shown in Figure 2. We have experimented with fits assuming partial covering of the source or ionized rather than neutral absorbers; neither the quality nor the nature of the best fits differ in any significant way from the above. This is to be expected since the hard X-ray spectrum largely decouples in the analysis from the soft, absorbed, spectrum.
We also investigated the potential presence of an unabsorbed power-law component (corresponding to AGN emission that has been scattered at sufficiently large distances to be free of any substantial absorption). No such component was required by the data, and limits were set on the luminosity of any such component of .
4 Discussion
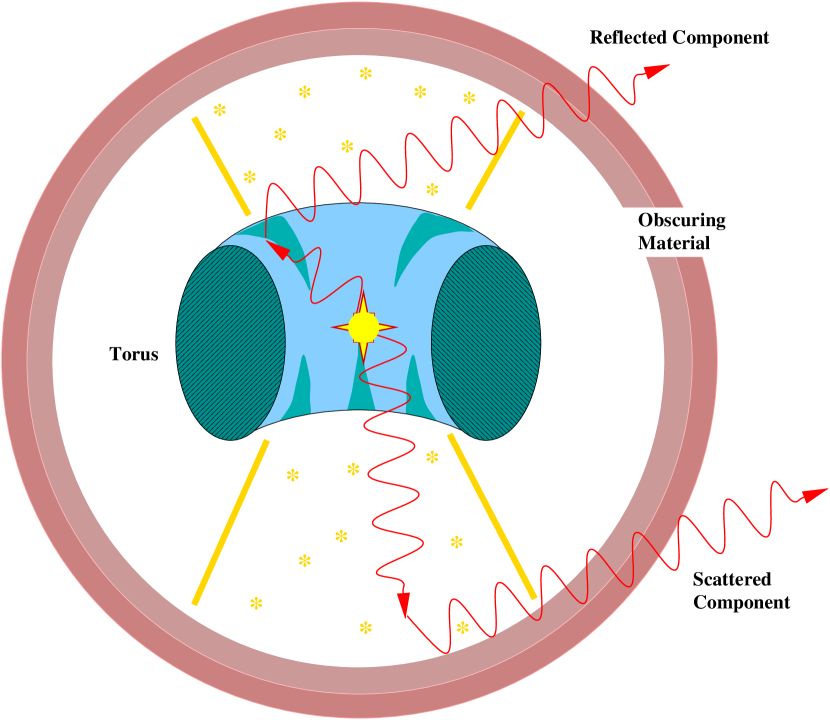
In his analysis of previous ASCA data, Iwasawa (1999) was unable to distinguish between a very flat, unabsorbed power-law and a heavily absorbed, typical () AGN spectrum. With the considerably better S/N provided by our ASCA observation, we can show unequivocally that no amount of neutral absorption can steepen the intrinsic photon index into the normal AGN range. We are therefore led to conclude that there is a Compton-thick screen blocking the X-ray source along our line of sight, and we see the AGN only by reflection and scattering of the X-rays into our line of sight (Figure 3). Furthermore, unless the spectrum of the hard X-ray emission is unusually steep, the reflected/scattered emission is fairly heavily absorbed, by a neutral column .
We can estimate the intrinsic luminosity of the X-ray source in two ways. When we subtract the contribution from the thermal emission, the observed keV luminosity is . Corrected for neutral absorption, this becomes , and with the reflection fraction set equal to zero, the scattered luminosity is . (Note that this implies that about three-quarters of the observed X-ray luminosity is due to scattering of X-rays into our line of sight, rather than reflection, thus reducing the equivalent width of the Fe K line from the value of keV expected for a reflection-dominated spectrum.) Hence the intrinsic luminosity of the X-ray source is given by
| (1) |
where the scattering fraction is expected to be on the order of for electron scattering, assuming that the scattering column density is of the same order as the inferred absorption column density, i.e., a Thompson optical depth of order .
Alternatively, we can estimate from the reflected fraction and modeling of the reflection process. From the above numbers, the observed luminosity in the reflection component is . Using xspec, we conclude that the product of and the reflection fraction is
| (2) |
and so
| (3) |
where we have normalized to under the assumption that only a small fraction of the reflecting surface is visible to us; for the Compton-thick Sy 2 NGC 1068, Iwasawa, Fabian & Matt (1997) infer . These two estimates of the luminosity agree for a ratio , i.e., for a reflected fraction for a scattered fraction which, as noted above, is the value expected if the scattering column is of the same order as the inferred absorbing column. (This ratio of is not independent of the value derived from the spectral fitting.) Thus we infer that , , and . This is times larger than the value of Iwasawa (1999), and a factor larger than the luminosity estimated by Turner (1999); hence our analysis implies that the AGN is much more X-ray-luminous than previously thought.
From our estimate of the intrinsic hard X-ray luminosity , we can estimate the contribution of the AGN to the bolometric luminosity of Mrk 231. The implied ratio of . For comparison, the ratio of for the sample of Sy 1 and radio-quiet QSOs of Elvis et al. (1994) for which X-ray data are available ranges from to , with the mean value decreasing somewhat with , from for (11 objects) to for (7 objects); all the latter are classified as radio-quiet QSOs. Hence, within the uncertainties, the energetics of Mrk 231 are consistent with complete domination by the AGN; in any case, the fraction of the bolometric luminosity contributed by the AGN is almost certainly large (). Extrapolating to high energies, the predicted keV luminosity is , a factor of five below the Dermer et al. (1997) upper limit from OSSE.
We also note that, with our estimate of the intrinsic X-ray luminosity, Mrk 231 is no longer an outlier in the significant correlations found by Lawrence et al. (1997) in the properties of AGN with extreme Fe II emission, in particular, those between the 2 keV – 1m spectral index and the Fe II emission strength and the emission line FWHM. Since our estimate of the flux density at 2 keV is times larger than the value used by Lawrence et al. (from Rigopoulou, Lawrence, & Rowan-Robinson 1996), we find a value of , smaller by than the value inferred by Lawrence et al., which moves Mrk 231 into line with the bulk of strong Fe II emitters in their sample. Furthermore, the expected hard X-ray luminosity from the correlation between broad H and keV emission (Ward et al. 1988), using the H flux measured by Smith et al. (1995, uncorrected for extinction), is , in excellent agreement with the inferred X-ray luminosity.
5 Summary
A moderately long ASCA observation of the infrared-luminous galaxy Mrk 231 shows a very flat hard X-ray spectrum, which strongly suggests that the central AGN is hidden behind a Compton-thick screen, and is observed in X-rays only by scattering and reflection of the radiation into our line of sight. The inferred X-ray luminosity in the keV band is for a scattering fraction , the value expected from the absorbing column density inferred from the X-ray spectrum. This is much larger than previous estimates, and the resulting ratio of is typical of luminous Sy 1 and radio-quiet QSOs, indicating that the AGN dominates the bolometric luminosity of the galaxy, and confirming the suggestion of Smith et al. (1995) that Mrk 231 is most properly classified as a low-ionization BAL QSO. The increase in the inferred X-ray luminosity over previous estimates also puts Mrk 231 in line with the correlations between 2 keV – 1m spectral index and both Fe II emission strength and emission line FWHM found by Lawrence et al. (1997) for AGN with extremely strong Fe II emission.
References
- (1) Boksenberg, A., Carswell, R.F., Allen, D.A., Fosbury, R.A.E., Penston, M.V., & Sargent, W.L.W. 1977, MNRAS, 178, 451
- (2) Elvis, M., Wilkes, B.J., McDowell, J.C., Green, R.F., Bechtold, J., Willner, S.P., Oey, M.S., Polomski, E.,& Cutri, R. 1994, ApJS, 95, 1
- (3) DeGrijp, M.H.L., Keel, W.C., Miley, G.K., Goudfrooij, P., & Lub, J. 1992, A&AS, 96, 389
- derm (97) Dermer, C.D., Bland-Hawthorn, J., Chiang, J., & McNaron-Brown, K. 1997, ApJ, 484, L121
- genzet (98) Genzel, R., et al. 1998, ApJ, 498, 579
- (6) Hamilton, D., & Keel, W.C. 1987, ApJ, 321, 211
- (7) Iwasawa, K. 1999, MNRAS, 302, 961
- (8) Iwasawa, K., & Comastri, A. 1998, MNRAS, 297, 1219
- (9) Iwasawa, K., Fabian, A.C., & Matt, G. 1997, MNRAS, 289, 443
- (10) Krolik, J.H., & Kallman, T.R. 1987, ApJ, 320, L5
- (11) Krolik, J.H., Madau, P., & Życki, P.T. 1994, ApJ, 420, L57
- (12) Lawrence, A., Elvis, M., Wilkes, B.J., McHardy, I., & Brandt, N. 1997, MNRAS, 285, 879
- (13) Matt, G., Brandt, W.N., & Fabian, A.C. 1996, MNRAS, 280, 823
- mm (90) Melnick, J., & Mirabel, I.F. 1990, A&A, 231, L19
- riek (88) Rieke, G.H. 1988, ApJ, 331, L5
- (16) Rigopoulou, D., Lawrence, A., & Rowan-Robinson, M. 1996, MNRAS, 278, 1049
- (17) Sanders, D.B., & Mirabel, I.F. 1996, ARAA, 34, 749
- (18) Sanders, D.B., Soifer, B.T., Elias, J.H., Madore, B.F., Matthews, K., Neugebauer, G., & Scoville, N.Z. 1988, ApJ, 325, 74
- (19) Smith, P.S., Schmidt, G.D., Allen, R.G., & Angel, J.R.P. 1995, ApJ, 444, 146
- (20) Soifer, B.T. et al. 1984, ApJ, 278, L71
- (21) Sturm, E., et al. 1996, A&A, 315, L133
- (22) Turner, T.J. 1999, ApJ, 511, 142
- (23) Vignati, P., et al. 1999, A&A, 349, L57
- (24) Ward, M.J., Done, C., Fabian, A.C., Tennant, A.F., & Shafer, R. A. 1988, ApJ, 324, 767