Sub-mm imaging of a proto-cluster region at
Abstract
We have used the Submillimetre Common-User Bolometer Array (SCUBA) detector on the James Clerk Maxwell Telescope (JCMT) to measure bright sub-mm emission associated with a recently discovered extensive (kpc) and highly luminous, ‘blob’ of Ly emission at . The blob lies within a known large overdensity of optical sources in the –3.11 range, and is centered on a locally overdense peak within this region. The best explanation for the copious sub-mm emission is a dust obscured continuum source, which may produce the ionizing flux for the Ly cloud. Cooling gas explanations are plausible but excessively complicated, and the 450/850m ratio rules out a significant fraction of the signal arising from the Sunyaev-Zel’dovich increment. At least two additional mJy sub-mm detections in the SCUBA map, with a surface density significantly higher than in blank field surveys, suggests that they may be associated with the structure. A SCUBA ‘photometry’ observation of a second nearby Ly blob tentatively detects a weaker sub-mm counterpart.
Subject headings:
galaxies: clusters: general – galaxies: evolution – galaxies: formation – submillimeter: galaxies – radio continuum: galaxies1. Introduction
Deep sub-mm surveys with SCUBA have detected distant luminous galaxies which emit most of their energy at far infrared wavelengths (e.g., Smail et al. 1997; Barger et al. 1998, Hughes et al. 1998, Eales et al. 1998). Although some of these sources have been identified with very faint and sometimes very red optical counterparts (Smail et al. 1999) their poorly constrained redshift distribution (Barger et al. 1999, Smail et al. 2000) has made their interpretation unclear. Bright distant SCUBA sources appear similar to local ultra-luminous infra-red galaxies (e.g. Sanders 2000), but represent a more significant fraction of the global star formation at high redshift. How these differ at high , and how they are related to optically selected galaxies remains to be understood.
We might expect such luminous sub-mm sources to be especially prevalent in regions that will one day become rich clusters of galaxies. For instance, if early type galaxies (which are dominant only in rich cluster environments) form by major merger events, then during the epoch of their formation they might produce a large fraction of the bright sub-mm sources in the Universe. There might therefore be a strong clustering signal from sub-mm sources at high redshift (e.g. Ivison et al. 2000). Even if the sub-mm sources are primarily AGN-driven, we might expect them to be strongly clustered, given the bulge to black hole mass correlations (cf., Gebhardt et al. 2000).
Since it is not yet possible to measure the clustering properties of sub-mm sources, the next best approach is to examine regions that are already known to be overdense from other techniques. The most likely time in a cluster’s history for a bright sub-mm phase is when smaller groups are collapsing, prior to virialization of the whole proto-cluster environment, when compact groups of objects with relatively low velocity dispersion present high probabilities for merger events. Therefore, galaxy concentrations within known large-scale overdensities are good places to search for significant sub-mm emission.
Extensive spectroscopic surveys have recently shown strong clustering among the star forming Lyman break galaxy (LBG) population at (e.g., Adelberger et al. 1998). In one striking example, a high-contrast redshift overdensity of LBGs at in the SSA22 survey field was discovered (Steidel et al. 1998), with deep, narrow band Ly imaging used to identify at least 160 likely members of this structure (Steidel et al. 2000). Most dramatic in this spike was the discovery of two extensive (kpc), highly luminous (W) ‘blobs’ of Ly emission. The ‘blobs’ resemble the giant Ly nebulae associated with high redshift radio galaxies (cf. van Ojik et al. 1996), but have 1% of the associated radio continuum flux and no obvious source of UV photons bright enough to excite the nebular emission. Fabian et al. (1986) suggested that such extended emission line nebulae might be the signature of ‘maximal cooling flows’ in proto-cluster and proto-galaxy environments – these ‘blobs’ resemble just such objects.
The SSA22 arcmin field at –3.11 is a factor of 6 overdense in LBGs relative to the general field, and about twice as overdense again within the local density peak centered on ‘blob 1’. At present, the SSA22 structure is by far the best studied candidate for a clustered region at . The space density of the LBG redshift ‘spikes’ is similar to that of rich x-ray clusters at low redshift, supporting the plausible identification of the LBG overdensities as proto-cluster sites.
We have obtained SCUBA 850m and 450m maps of the Ly blob lying at an overdensity peak within the already overdense field, revealing an extremely luminous sub-mm counterpart. In this letter, we describe the available multi-wavelength data for the blob regions and explore the relevant excitation mechanisms.
2. Observations and Reduction
The field centered on the Ly ‘blob 1’ (RA2000 = , = ) was observed with the SCUBA instrument (Holland et al. 1999) on the JCMT. During an observing run in May 2000, we obtained 450 and 850m images simultaneously in ‘jiggle’ mode, with half-power beam widths of 7.5 and 14.7 arcsec respectively. The effective integration time (total time spent on the map, on and off source) was 8.2 ks, reaching a 1 sensitivity of mJy and mJy at 850m and 450m respectively. We used 45 arcsec chop throws at fixed RA and declination with position angles of 0, 90 and 135 degrees from north, to avoid consistently chopping any structures onto each other. For the central source, the 850m flux density was measured by fitting a single beam template (derived from observing Mars) to the source in each scan and combining the results with inverse variance weighting. The fluxes are consistent with each other in each of the individual scans. Since no other sources are detected in the individual scans, we simply stacked and combined the scans and similarly fit beam templates to all sources representing peaks 2.8 in the final map. In addition, a ‘photometry’ observation in three-bolometer chopping mode (see Chapman et al. 2000a, Scott et al. 2000) was performed on the Ly ‘blob 2’ for an effective on-source observing time of 2.8 ks, reaching an RMS of 1.2 mJy at 850m.
Pointing was checked hourly on blazars and a sky-dip was performed to measure the atmospheric opacity. The pointing variations were around 2 arcsec, while the average atmospheric zenith opacities at 450m and 850m were 1.39 and 0.22. The data were reduced using the Starlink package SURF (Jenness et al. 1998). Spikes were first carefully rejected from the data, followed by correction for atmospheric opacity and sky subtraction using the median of the outer ring array elements. We then weighted each pixel by its timestream inverse variance, relative to the central pixel. The multiple scans taken at dithered positions, together with sky rotation throughout the observations, ensure that each point of the map is covered by several bolometers. The data were finally calibrated against the compact H ii region , observed during the same nights.
Archive VLA data were retrieved for this field, with RMS sensitivities of 60Jy at 1.4 GHz and 40Jy at 8.5 GHz. The beam is comparable to the SCUBA beam at 850m, but since the field was observed as a low declination snapshot, the beam is elongated to approximately arcsec.
The visible images on which our present analysis is based were obtained using the Palomar 200 inch telescope with the COSMIC camera. Spectroscopy and near-IR imaging were obtained with the Keck 10m telescope and the LRIS and NIRC instruments respectively, and are described elsewhere (Steidel et al. 2000).
3. analysis and results
3.1. The blob sources
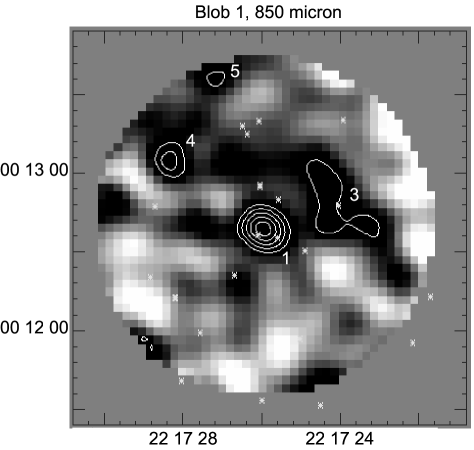
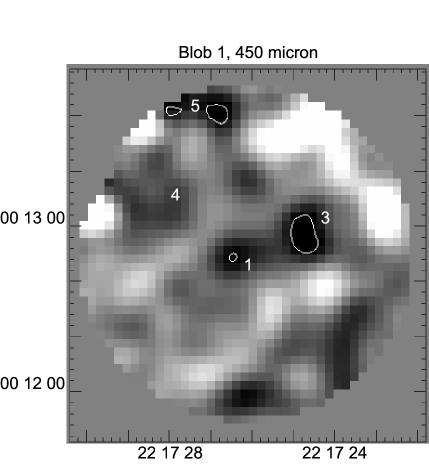
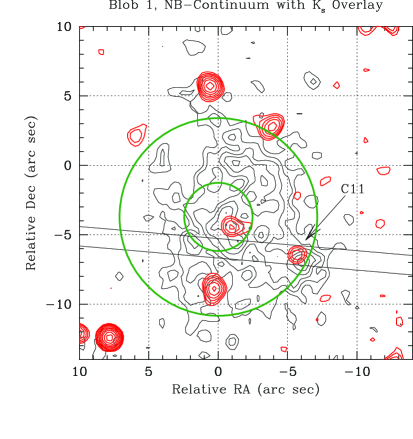
We have detected an unresolved sub-mm counterpart to the ‘blob 1’ (SMMJ 221726+0013) with an 850m flux density of 20 mJy. At this corresponds to a luminosity for an cosmology, giving a bolometric luminosity of for any reasonable temperature and emissivity index. There is also a detection at the central position in the 450m map (76 mJy), which also does not appear to be extended. A SCUBA photometry observation of the other Ly blob (‘blob 2’) gives a detection of a much weaker sub-mm counterpart, mJy. The 850m and 450m images of the ‘blob 1’ are presented in Fig. 1, convolved with a 14″ Gaussian, while the fluxes at various wavelengths for the two blob sources and surrounding sub-mm sources are listed in Table 1. Other known objects from Steidel et al. (2000) are denoted with crosses on the 850m map, while a Ly narrowband image with -band contours and SCUBA error circles overlaid is presented in Fig. 2 for both blobs. The extremely luminous sub-mm source appears coincident with the central Ly knot (‘blob 1’). Although this Ly peak remains undetected in the broadband optical to , it has a -band counterpart with an associated . The sub-mm centroid lies only 2 arcsec from this Ly peak, entirely consistent with the JCMT pointing errors. No radio counterpart was detected at the sensitivity limits of the VLA images consistent with a high- emitting source.
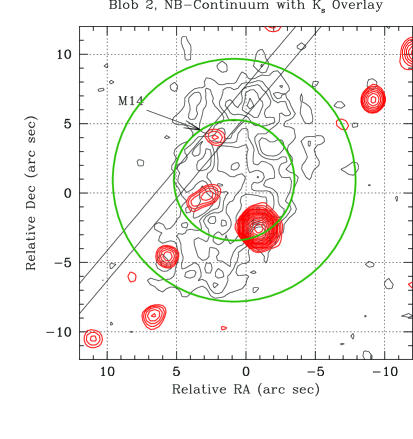
For ‘blob 2’, the SCUBA photometry observation was targeted on the Ly center, near a weak -band source, where we identify a possible mJy detection. However, without higher resolution it is difficult to know which source within the beam is giving rise to the sub-mm emission. In particular an LBG, M14, lies at the edge of the SCUBA beam, 6″ northeast of the ‘blob 2’ center. If M14 was generating the sub-mm flux, then the beam efficiency correction would imply an 850m flux of mJy, similar to the very red LBG () detected by SCUBA (Westphal-MMD11 – Chapman et al. 2000a). However, M14 is a very faint LBG () and is not especially red (), and is thus not expected to be a strong sub-mm emitter. Moreover the relatively faint sub-mm emission makes it unlikely that a radio counterpart could be detectable for a in the archive VLA maps.
3.2. The other sub-mm sources
As well as the central ‘blob 1’ detection, there are perhaps as many as three additional source detections ( mJy) in the 850m map. Our best attempt to describe the extended region to the west is as three separate sources in a blend (source 3 in the Table). However, low signal-to-noise and resolution means that this is little more than a guess. The 850m blend region may be extended at 450m, but is detected only in the northern part. Two possible sources to the NW (4th and 5th in the table) appear unresolved, but are near the edge where the noise is worse and poorly defined, although source 6 appears coincident with a 450m source.
Radio observations provide rough constraints on the redshifts of sub-mm sources (Carilli & Yun 1999,2000; Barger et al. 2000). Our sub-mm detected galaxies in SSA22 have inferred bolometric luminosities several times that of Arp 220, with expected 1.4 GHz radio fluxes Jy (Helou et al. 1985) and thus lie below the detection threshold of current VLA observations. Applying the Carilli & Yun (2000) relation to provide redshift constraints from the 850m detections and GHz upper limits shows that all these sources have predicted redshifts .
The ratio can also loosely constrain the source redshifts (cf. Hughes et al. 1998). While the central blob source, and source 4 are consistent with , the sources 3 and 5 in the Table with 450m detections have flux ratios suggesting lower redshifts. For the western blend region, confusion makes it hard to draw any inferences. The flux ratio for the northern source (850m source 5) suggests a redshift less than 2. However, the source is near the edge, identification of the 450m peak with the 850m source is far from certain, and the lack of an obvious radio counterpart suggests .
Turning now to optical identifications, we find no known optical/near-IR candidates within the error circles of these additional sub-mm source detections. The sub-mm sources may be extremely faint (, ), similar to the radio selected sub-mm bright populations studied by Barger et al. (2000) and Chapman et al. (2000b). However, not all sub-mm sources are associated with such optically faint counterparts (e.g. the LBG W-MMD11, Chapman et al. 2000a). In addition, only about half of the blue, UV bright galaxies are included in LBG catalogs (largely due to photometric errors and blending with foreground objects), thus it is possible that a sub-mm source could be associated with a UV bright galaxy even if it has no counterpart in our LBG list. The relatively low detection significance of these surrounding sub-mm sources, and the absence of any obvious counterparts at other wavelengths, suggest that we exercise caution in over-interpreting these objects. Nevertheless, the number density of mJy SCUBA sources is about an order of magnitude higher than in SCUBA blank fields (cf. Blain et al. 1999; Barger et al. 2000; Chapman et al. 2000c); at least some of these sources are likely to be associated with the structure.
4. Discussion and Conclusions
The central ‘blob 1’ SCUBA source is among the most luminous high- sub-mm sources known. It is especially interesting that this object was discovered through the presence of tremendous amounts of Ly emission, usually thought of as easily destroyed by the presence of dust. This begs the question: would other bright sub-mm sources (if their redshifts were known) exhibit similar Ly ‘halos’?
One luminous sub-mm selected source, SMMJ02399-0136, is known to be associated with an extended (8″) Ly region (Ivison et al. 1998), although the actual extent has not yet been constrained through a narrow-band image. Both star forming and AGN components have been identified, although the primary power source for the sub-mm emission has not been constrained. A few high- radio galaxies with giant Ly halos have also been detected in the sub-mm, including 4C41.17 (Chambers et al. 1990) which has a possible ‘cluster’ of sub-mm sources associated (Ivison et al. 2000). However, in the case of this SSA22 blob, the Ly halo is hard to explain through excitation of the ambient medium by a radio jet, since there is no known radio counterpart here. Archibald et al. (2000) have observed a sample of high redshift radio galaxies using SCUBA, detecting several with known Ly halos. The sub-mm emission from the ‘blob 1’ object is more luminous than any radio galaxy in this survey of 47 sources over . Indeed, the lack of significant radio emission from our blob 1 SCUBA object suggests that the Ly halos surrounding distant radio galaxies may not be entirely related to the radio sources.
The questions of the ionizing source for the Ly blobs and the nature of the sub-mm emission remain. The blobs are probably excited by either photoionization from a central source, or as a result of virialization in a deep potential. The sub-mm emission could be either a UV-luminous star forming galaxy or an obscured AGN. More extended sub-mm emission such as from a cooling flow or even from the Sunyaev-Zel’dovich effect are also possible. The lack of a UV source in the optical images, coupled with the large dust mass implied by the sub-mm detections, make direct photoionization of the Ly from such a central AGN or starburst difficult to imagine. However, it is conceivable that complicated geometrical and radiative transfer effects could conspire to allow substantial Ly fluxes at the same time that the continuum sources are heavily obscured by dust along our line of sight (e.g. Neufeld 1991). The fact that the second Ly blob is not a strong sub-mm source suggests that an obscured continuum source need not be the primary driver for the Ly emission.
For a pure star-burst galaxy, the star formation rate extrapolated from the sub-mm would be in excess of for ‘blob 1’. By analogy with the giant Ly halos around high- radio galaxies, there is reason to suspect a luminous AGN at the heart of the Ly blob. Although the redshift of the Ly ‘blob 1’ () is relatively high for radio detection, the farIR/radio correlation for radio quiet sources (Helou et al. 1995) suggests a 1.4 GHz flux density of Jy if it is a steep spectrum object (Carilli & Yun 1999), and possibly a comparable 8.5 GHz flux if it had the flatter spectrum characteristic of an AGN. Our Bayesian 95% upper limits of 142Jy (1.4 GHz) and 95Jy (8.5 GHz) lie well within the uncertainties of the Carilli & Yun (2000) relation, and deeper observations will be required to further constrain the properties of the system. The ratio for the central source is , which is consistent with a starburst or radio quiet AGN lying at (cf. Hughes et al. 1998).
Another possibility is that the 850m flux could be partly Sunyaev-Zel’dovich increment, although the detection of 450m flux argues against this being a significant component. On theoretical grounds, the surface brightness of the increment for rich local clusters would be expected to be around mJy per SCUBA beam, and all other things being equal, S-Z surface brightness is independent of redshift. The S-Z signal is approximately : the background density is proportional to , and so the core of a cluster virializing at high redshift would be much denser. However, the characteristic non-linear mass in an universe goes like , where is the power-spectrum slope. For CDM models is -1 to -2 on the relevant scales. Hence, though the estimate is dependent on cosmology, the simple argument suggests that the S-Z contribution is not likely to explain all our signal. The expected decrement at GHz would be Jy, and hence at the limit of being detectable currently.
If the blobs are associated with cooling-flow-like phenomena (e.g. Hu 1992), then some of the sub-mm emission could come from dust associated with distributed star-formation in the cooling flow. Edge et al. (1999) and Chapman et al. (2000c) have searched for such emission in well-known rich clusters with null results. However, local cooling flow clusters are not necessarily a proper benchmark, given that the associated gas densities could conceivably be much higher at . Fardal et al. (2000) and Haiman et al. (2000) have recently modelled the cooling radiation from forming galaxies and concluded that sub-virial temperatures for the gas could lead to much lower x-ray luminosities than one would expect from extrapolating local cooling flows. While it is not inconceivable that some of the flux has this source, even optimistic estimates for the strength of the signal, as discussed in the above papers, come out at a few mJy.
Future observations will continue to elucidate the nature of the ‘blobs’. For optically thin sub-mm emission, we can estimate the expected x-ray signal of the ‘blob 1’ sub-mm object using different analogs for the central source at , and representative sub-mm/x-ray indices (cf. Fabian et al. 2000). Even the most heavily obscured (Compton-thick) AGN, analogous to NGC 6240, should be detectable with Chandra or Newton with soft and hard x-ray fluxes of order , while an Arp220 analog would be even fainter. Deeper radio maps or higher frequency interferometer maps would be able to distinguish any SZ component, as well as confirm the other sub-mm sources and their positions.
The extreme sub-mm luminosity from the central Ly halo in ‘blob 1’ (and weaker emission detected from ‘blob 2’) is an intriguing phenomenon, given the fragility of the Ly line in the presense of dust. This combination of deep, large-area Ly surveys and sub-mm images may be interesting to explore further as a way of unearthing information about clusters in their early stages of formation.
References
- (1) Adelberger K., Steidel C.C., Giavalisco M., Dickinson M., Pettini M., et al. 1998, ApJ, 505, 18
- (2)
- (3) Archibald E.N., Dunlop J.S., Hughes D.H., Rawlings S., Eales S.A., et al. 2000, MNRAS, in press [astro-ph/0002083]
- (4)
- (5) Barger A.J., Cowie L.L., Sanders D.B., Fulton E., Taniguchi Y., et al. 1998, Nature, 394, 293
- (6)
- (7) Barger A.J., Cowie L.L., Smail I., et al. 1999, AJ, 117, 2656
- (8)
- (9) Barger A.J., Cowie L.L. Richards E.A. 2000, AJ, 119, 2092
- (10)
- (11) Blain A., Kneib J.-P., Ivison R.J., Smail I. 1999, ApJ, 512, L87
- (12)
- (13) Carilli C.L., Yun, S.M. 1999, ApJ, 513, L13
- (14)
- (15) Carilli C.L., Yun, S.M. 2000, ApJ, 530, 618
- (16)
- (17) Chapman S.C., Scott D., Steidel C.C., Borys C., Halpern M., et al. 2000a, MNRAS, in press [astro-ph/9909092]
- (18)
- (19) Chapman S.C., Richards E., Lewis G.F., 2000b, Nature, submitted
- (20)
- (21) Chapman S.C., Scott D., Borys C., Fahlman G.G. 2000c, MNRAS, submitted [astro-ph/0009067]
- (22)
- (23) Eales S., Lilly S., Gear W., Dunne L., Bond J.R., et al. 1999, ApJ, 515, 518
- (24)
- (25) Fabian A.C., Arnaud K.A., Nulsen P.E.J., Mushotzky R.F. 1986, ApJ, 305, 9
- (26)
- (27) Fabian A.C., Smail I., Iwasawa K., Allen S.W., Blain A.W., et al. 2000, MNRAS, 315, L8
- (28)
- (29) Fardal M., Katz N., Gardner J.P., Hernquist L., Weinberg D.H., et al. 2000, ApJ, in press [astro-ph/0007205]
- (30)
- (31) Gebhardt K., Bender R., Bower G., Dressler A., Faber S.M., et al. 2000, ApJ, in press [astro-ph/0006289]
- (32)
- (33) Haiman Z., Spaans M., Quataert E. 2000, ApJ, submitted [astro-ph/0003366]
- (34)
- (35) Helou G., Soifer B.T., Rowan-Robinson M. 1985, ApJ, 298, L7
- (36)
- (37) Holland W.S., Robson E.I., Gear W.K., Cunningham C.R., Lightfoot J.F., et al. 1999, MNRAS 303, 659
- (38)
- (39) Hu E.M. 1992, ApJ, 391, 608
- (40)
- (41) Hughes D.H., Serjeant S., Dunlop J., Rowan-Robinson M., Blain A., et al. 1998, Nature, 394, 241
- (42)
- (43) Ivison R.J., Smail I., Le Borgne J.-F., Blain A.W., Kneib J.-P., Bezecourt, J., et al. 1998, MNRAS, 298, 583
- (44)
- (45) Ivison R.J., Dunlop J.S., Smail I., Dey A., Liu M.C., et al. 2000, AJ, in press [astro-ph/0005234]
- (46)
- (47) Neufeld D.A. 1991, ApJ, 370, L85
- (48)
- (49) Sanders D.B. 2000, AdSpR, 25, 2251 [astro-ph/9904292]
- (50)
- (51) Scott D., Lagache G., Borys C., Chapman S.C., Halpern M., et al. 2000, A&A, 357, L5
- (52)
- (53) Smail I., Ivison R.J., Blain A.W. 1997, ApJ, 490, L5
- (54)
- (55) Smail I., Ivison R.J., Kneib J.-P., Cowie L.L., Blain A.W., et al. 1999, MNRAS, 308, 1061
- (56)
- (57) Smail I., Ivison R.J., Owen F.N., Blain A.W., Kneib J.-P. 2000, ApJ 528, 612
- (58)
- (59) Steidel C.C., Adelberger K.L., Dickinson M., Giavalisco M., Pettini M., et al. 1998, ApJ, 492, 428
- (60)
- (61) Steidel C.C., Adelberger K.L., Shapley A.E., Pettini M., Dickinson M., et al. 2000, ApJ, in press [astro-ph/9910144]
- (62)
- (63) van Ojik R., Röttgering H.J.A., Carilli C.L., Miley G.K., Bremer M.N., 1996, A&A, 313, 25
- (64)
| source | redshiftb | ||||
|---|---|---|---|---|---|
| (mJy) | (mJy) | (Jy) | (Jy) | ||
| Blobs | |||||
| (1) SMMJ221726+0013 | 20.13.3 | 7624 | 35.459.2 | 48.3 | |
| (2) SMMJ221717+0015 | 3.31.2 | 2915 | 55.459.7 | 51.1 | |
| Other sources | |||||
| (3) SMMJ221724+0012 | 15.43.5c | 9529 | 100.761.7 | 33.547.4 | |
| (4) SMMJ221728+0013 | 12.23.7 | 4133 | 214.247.8 | 45.7 | |
| (5) SMMJ221727+0014 | 10.73.8 | 8732 | 44.244.9 | 43.7 |
References. — .
a) Sub-mm flux densities do not contain a 10% calibration uncertainty at 850m and 20% at 450m. The 450m measurements are made in matched 15″ apertures to the 850m centroids.
b) redshift lower limits estmated from the sub-mm/radio index using the Bayesan 95% radio upper limit and Carilli & Yun (2000) indicator.
c) 20″ diameter aperture estimate.