The EMSS Radio Loud Quasar Sample
Abstract
We construct the first X-ray selected sample of radio-loud quasars from the EMSS survey. The X–ray selection allows us to explore the properties of radio–loud quasars 10–100 weaker than classical samples in the radio band. There are no radio–loud quasars whose synchrotron peak reaches the UV–soft X–ray band at these (radio) flux levels (as occurs for BL Lac objects selected in the X–ray band), but they appear to have comparatively stronger optical–UV emission. We suggest that this can be ascribed to a significant contribution from a quasi–thermal optical–UV component, emerging due to the comparatively weak non-thermal emission. The detection of sources at low radio fluxes also shows the presence of a large population of steep spectrum quasars, and the lack of the predicted turnover in the quasar counts.
Osservatorio Astronomico di Brera, via Brera 28, 20121 Milano, Italy
Sissa, via Beirut 2-4, 34014 Trieste, Italy
1. Introduction
To understand a population properties it is crucial to disentangle the intrinsic features from the selection induced ones. To this aim it is necessary to compare the characteristics of sources selected in different spectral bands. We have therefore considered radio–loud quasars – which so far have been extracted from radio surveys – and studied an X–ray selected sample. We are mainly interested in determining whether the relation between the Spectral Energy Distribution (SED) and the source power proposed by Ghisellini et al. (1998) and Fossati et al. (1998) – a blazar sequence from High-peaked BL Lacs (HBL), to Low-peaked BL Lacs (LBL) to Flat Spectrum Radio quasars (FSRQ) – holds also for fainter X-ray selected quasars. The trend in the SED can be physically accounted for by an increase in the external radiation field along the sequence.
2. The sample
The sample under study comprises the radio–loud quasars detected in the Einstein Medium Sensitivity Survey (EMSS; Gioia et al. 1990; Stocke et al. 1991). It is the first statistically complete X–ray selected sample of (39) radio–loud quasars. Details can be found in Wolter & Celotti (2000, A&A submitted). The sample is cut at , and excludes narrow line objects. We dub the sample the EMSS Radio Loud quasar sample (ERL). We divide the sample in flat (FS) and steep (SS) spectrum radio–loud objects (). The distribution of is not bimodal and therefore the choice of a dividing value is somewhat arbitrary. We formally consider it at =0.7.
3. Broad band properties
We study the luminosities in the radio, optical and X–ray bands (, , ) and the corresponding broad band spectral indices (, , ). Through X–ray selection we detect objects with a rather limited range in optical luminosity, but a large span in the radio one, extending the range of sampled towards fainter sources compared to radio–selected quasars.
The radio and X-ray luminosities seem to be correlated at the 99% level even taking into account the common redshift dependence. No differences are found between the distributions of FS and SS, neither in luminosities (KS probability ) nor in broad band spectral indices () nor in the trends, suggesting a behavior of the compact beamed component independent of the large scale radio flux dominance.
The shape of the SED appears to be related to the radio luminosity: in fact, the only statistically significant trends found are between , and , consistent with being caused by a change in the synchrotron peak energy: the flatter is , the higher is the peak energy.
4. Comparison with other samples
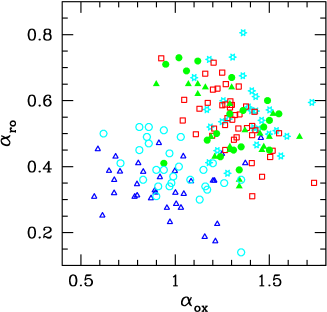
In Fig. 1a we show the ERL and samples of both FSRQ and radio and X–ray selected BL Lacs. The ERL occupy the transition region (in the “boomerang” shaped blazar distribution) between FSRQ and X–ray selected ( HBL) BL Lac objects, roughly overlapping with radio–selected ( LBL) ones. Note that the location of LBL and FSRQ in the spectral index plane is due to the dominance in the X–ray band of a flat Compton component.
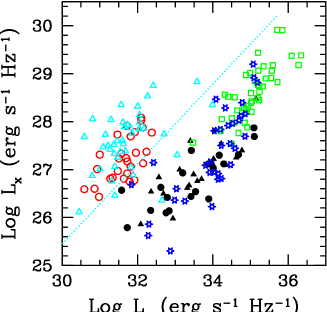
Even the X–ray selection is unable to detect radio–loud quasars with high peaked synchrotron components, albeit sampling sources with comparable to that of HBL (see Fig. 1b). These findings are therefore in global agreement with the expectation of the blazars sequence scenario, thus re-enforcing the view of a strong connection between the SED and the radio luminosity.
We propose that the concentration of ERL in the LBL region could be at least in part ascribed to the increasing dominance of a quasi–thermal optically–UV component (blue bump) in quasars of increasingly lower (non–thermal) radio power. Indeed the typical and of the low radio power ERL corresponds to SED whose peak is located in the optical–UV region. The presence of such a component would flatten and steepen in sources with decreasing non–thermal continuum. Optical and X–ray spectra will be able to verify such hypothesis.
5. LogN-logS, Evolution, and Luminosity Functions

| ERL | FS | SS | |
|---|---|---|---|
| Count slope | 1.9 [1.7-2.2] | 1.8 [1.6-2.1] | 2.0 [1.7-2.3] |
| z | 0.92 0.40 | 0.99 0.40 | 0.85 0.39 |
| 0.78 0.05 | 0.76 0.06 | 0.81 0.07 | |
| C | 6.6 [5.6-7.4] | 6.4 [5.6-7.1] | |
| LF integral slope | 1.6 [1.4-1.7] | 1.6 [1.3-1.8] | 1.9 [1.6-2.2] |
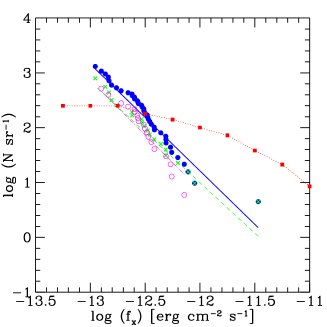
We plot the number counts of FS and SS sources in Fig. 2a. There is marginal evidence (though over the whole range in flux) for flatter counts of FS (see Table 1.) The count distributions of FS is in complete agreement with what found for all AGN – mostly radio quiet– in the EMSS (, Della Ceca et al. 1992); SS and all ERL counts are marginally steeper (at 1 level) than all AGN, possibly indicating larger amount of evolution.
The most interesting aspect is the extension to a factor 100 lower fluxes provided by the X–ray selection. At radio fluxes of a few tens of mJy (which corresponds for an average SED to ) the radio counts of X–ray selected objects are marginally consistent with the Euclidean extrapolation from higher fluxes and thus largely exceed (factor 10 for FS and 3 for SS) those predicted by the beaming model, which drop below 0.1 Jy (Padovani & Urry 1992). The EMSS BL Lac distribution (see Fig. 2a) is flatter, dominating by a factor at , and an ‘inversion’ of the two populations occurs just above 3 .
We have studied the cosmological evolution by applying the Ve/Va test (Avni & Bachall, 1980) - see Table 1. The derived evolution rate for ERL and FS is consistent with the total EMSS AGN sample (Della Ceca et al. 1992). SS require a slightly higher value for the evolution parameter. The differential luminosity functions are plotted in Fig. 2b as observed, and de-evolved at z=0. Derived slopes are in Table 1.
Acknowledgments.
This work has received partial finantial support from the Italian MURST under grant COFIN98-02-32.
References
Avni, Y. & Bachall, J.N., 1980, ApJ, 235, 694.
Della Ceca R. et al., 1992, ApJ, 389, 491.
Fossati, G. et al., 1998, MNRAS, 299, 433.
Ghisellini, G. et al., 1998, MNRAS, 301, 451.
Gioia, I.M. et al., 1990, ApJS, 72, 567.
Laurent-Muehleisen et al. 1999, ApJ, 525, 127.
Padovani, P. & Urry, M.C., 1992, ApJ, 387, 449.
Perlman E.S., et al., 1998, AJ, 115, 1253.
Stocke, J.T. et al., 1991, ApJS, 76, 813.
Wolter, A. et al., 1991, ApJ, 369, 314.