A Compact Population of Red Giants in the Blue Compact Dwarf Galaxy UGCA 290111 Based on observations made with the NASA/ESA Hubble Space Telescope, obtained at the Space Telescope Science Institute, which is operated by the Association of Universities for Research in Astronomy, Inc., under NASA contract NAS 5-26555.
Abstract
We present HST/WFPC2 single-star photometry for the blue dwarf galaxy UGCA 290, whose morphology is intermediate between classic iE Blue Compact Dwarfs and blue dwarfs which exhibit no red background sheet of older stars. The color-magnitude diagram of this galaxy in V and I, extending over six magnitudes, is remarkably similar to that of the star-forming region in the iE Blue Compact Dwarf VII Zw 403. There is no evidence for gaps in its star-formation history over the last billion years, and the color of its red giant branch indicates a very metal-poor stellar population. From the magnitude of the tip of the red giant branch, we derive a distance of 6.7 Mpc, more than twice the distance estimated from the brightest blue supergiants.
1 Introduction
The wide array of properties in dwarf galaxies, the most common and potentially simplest galaxies in the universe, presents a challenge to models of structure formation. In particular, single-star photometry of nearby dwarfs has revealed a variety of star formation histories, even for galaxies with similar morphology (e.g. Tolstoy 1999). Identifying patterns among the various internal and external properties of dwarfs is part of answering fundamental questions about structure formation, such as whether dwarf galaxy formation was delayed by photoinization in the early universe, what universal events produced the faint blue excess counts at intermediate redshifts, and the importance of the blowout of enriched gas and the infall of pristine gas from the intergalactic medium (see Kunth & Östlin 2000 for a review.)
One especially intriguing category of dwarf galaxy is the Blue Compact Dwarf (BCD). This designation actually comprises star forming dwarfs with a range of morphologies, selected for blue colors and/or emission line spectra, along with compact size (Thuan & Martin 1981). They also have low metallicities, which originally made them candidates for “primeval” galaxies forming in the local universe (Searle & Sargent 1972). Since then, the majority of BCDs, designated types iE and nE, have revealed relatively large, low surface-brightness red elliptical background sheets underlying the blue star-forming regions (Loose & Thuan 1986). HST observations have now resolved several of these background sheets into red giants (e.g. Schulte-Ladbeck, Crone, & Hopp 1998, Schulte-Ladbeck et al. 2000), showing that star formation took place in them at least 1 Gyr ago, and possibly much earlier. Those BCDs which do not show a red background sheet are still candidates for primeval galaxies, a hypothesis strengthened by studies of abundance ratios (Izotov & Thuan 1999, but see Kunth & Östlin for a discussion of alternative explanations.) However, recent results challenge this hypothesis: Pox 186, a BCD previously thought not to have a background sheet, is now seen to have one (Doublier et al. 2000); and even the lowest-metallicity galaxy on record, I Zw 18, may harbor stars at least as old as 0.5 Gyr (Aloisi, Tosi, & Greggio 1999; Östlin 2000.) Thus, the problem of whether any BCDs are primeval is not yet solved. Moreover, the typical mode of star formation in iE-type BCDs does not appear to be the traditional picture of short, intense bursts separated by long quiescent periods, but a more continuous “gasping” mode of star formation (Schulte-Ladbeck et al. 2000.) It is not yet clear what mode of star formation occurs in other types of BCDs.
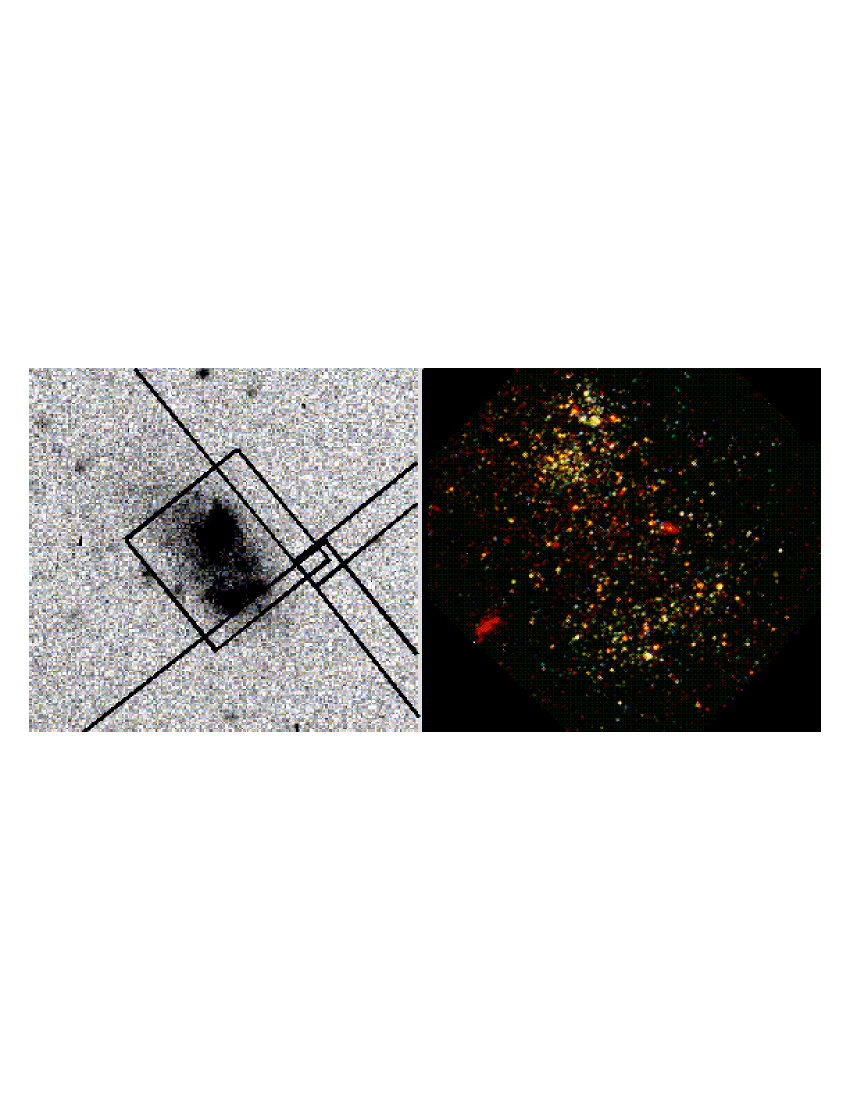
The dwarf galaxy UGCA 290, which was identified as a BCD based on its bright, compact HII emission (Karachentsev & Makarov 1998), provides a key to understanding these issues. Until now, all the BCDs resolved as deeply as the red giant branch have been type iE BCDs. Unlike these, UGCA 290 exhibits only a slight low surface-brightness halo in ground-based images; its star forming region appears as two large lobes which cover most of the visible galaxy (see Figure 1). Therefore, the stellar content of this galaxy can test whether the properties observed for deeply resolved BCDs are limited to the classic iE type or not.
2 Observations and reductions
We observed UGCA 290 in August of 1999 as part of GO program 8122. As Figure 1 shows, we captured most of the galaxy in the WFPC2 field of view, but missed the edge of the low-surface brightness region to the northeast. We obtained data in four filters: F814W, F555W, F336W, and F656N. For F814W and F555W, which approximate the I and V filters, we took six 1300 s exposures, at three dither positions, for a total of 7800 s in each filter. For F336W and F656N we obtained three 1300 s exposures at one position, for a total of 3900 s in each filter. In this paper we focus on the results in V and I.
We combined exposures at the same pointings using CRREJ and then combined the dithered images using DRIZZLE onto a 1600 x 1600 pixel grid. Figure 1 shows the color image of the Planetary Camera (PC), showing many resolved stars. Notice that the galaxy is relatively transparent (see the two red background galaxies) and free of individual HII regions. We masked out a few obvious background galaxies before conducting single-star photometry with DAOPHOT. We took the zero points from the May 1997 SYNPHOT tables and determined our point spread function (psf) from relatively isolated stars in our images. The residual errors from psf fitting remain below 0.1 mag for magnitudes up to in F555W and in F814W. We corrected for the small foreground extinction in this direction according to Schlegel et al. (1998), assuming an extinction curve: and . We have not attempted to correct for extinction within UGCA 290, but its transparancy outside major regions of star formation suggests that it is low, at least for stars in the background sheet. Finally, we transformed our magnitudes into ground-based V and I following Holtzman et al (1995).
We estimated the completeness of our photometry by adding artificial stars to our images using ADDSTAR and checking to see what percentages of them we could recover. In order to maintain the same level of crowding as in the original, we created simulated images by adding 5% of the observed number of resolved stars, consistent with their observed luminosity function. We created 200 such images for each filter in two different regions: in the PC chip, to model the more crowded inner part of the galaxy; and in the fourth of the WF2 chip closest to UGGA 290, to model the background sheet. In the analysis which follows, we refer to the completeness estimates for the background sheet.
3 Results
3.1 Stellar Content
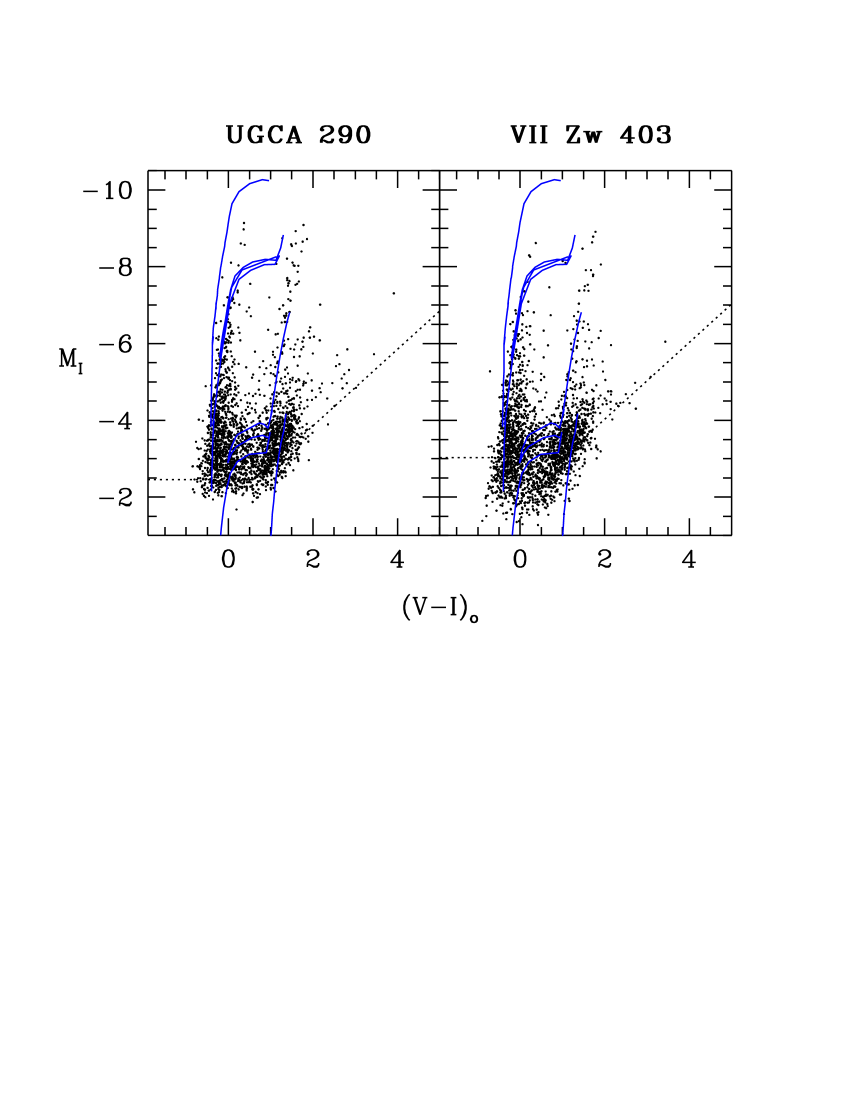
Figure 2 displays the color-magnitude diagram (CMD) for UGCA 290 along with that for the classic, well-studied iE BCD VII Zw 403 which is only 4.4 Mpc away (Schulte-Ladbeck et al. 1999.) For UGCA 290, we include only stars with errors smaller than 0.2 mag in both colors. Our data reduction for VII Zw 403 is described in Schulte-Ladbeck et al. (1999); here we show only those stars in the inner 30 arcseconds of this galaxy, which encompasses its entire star-forming core. Section 3.2 explains how we set the absolute magnitude scale.
The salient features in the CMD of UGCA 290 represent stellar populations with a range of ages. The bright “blue plume” at contains high-mass main sequence and He-burning blue loop stars, the bright “red plume” at contains red supergiants and asymptotic giant branch stars, the “red tail” extending past contains intermediate-mass asymptotic giant branch stars, and the concentration of red stars at contains low-mass red giants, along with some asymptotic giants. For reference, we overlay both CMDs with the Padova stellar evolutionary tracks for masses 40 M☉, 15 M☉, 4 M☉, and 1 M☉ (Fagotto et al. 1994). There is also a very bright, red object with which is located between the two main lobes of enhanced star formation. This may be a background galaxy, although it exhibits no extended structure in our images.
The resolved stellar contents of UGCA 290 and the core of VII Zw 403 are remarkably similar. The star formation history of VII Zw 403 was modeled by Lynds et al. (1998), but they focus on the asymptotic giant branch and red giant branch stars in the red background sheet. We will provide a more detailed comparison of the young stellar populations in these two galaxies in a later paper.
3.2 Distance and Metallicity
The identification of the red giant branch is especially useful in that it allows a reliable distance estimate; the tip of the red giant branch (TRGB) occurs at an absolute magnitude with only a small dependence on metallicity (see Lee, Freedman, & Madore 1993.) The location of our TRGB appears as a rise in the luminosity of function of red () stars at . Guided by our work with VII Zw 403, we attempted to refine this measurement by considering only stars far away from the star-forming regions, but any benefit of a better-defined RGB was outweighed by the small number of such stars. We measure the () color of the RGB for UGCA 290 to be at the TRGB and at half a magnitude fainter than the TRGB. Following Lee et al, this indicates a stellar metallicity of roughly [Fe/H]. (Our stated error includes only uncertainty in identifying the color from the CMD; see Lee et al. for the limitations of this method.) This low value suggests the possibility of a very low nebular metallicity log(O/H) (see Figure 1 of Kunth & Östlin 2000). With the approprate bolometric correction, the absolute magnitude of the TRGB is . Comparing to the observed TRGB at , the distance modulus is , for a distance of 6.7 Mpc. The error of 0.12 comes primarily from identifying the location of TRGB. The overall calibration of the TRGB method introduces an additional, systematic error of 0.18 mag.
The previous distance estimate for UGCA 290, based on the brightest blue supergiants, was 2.8 Mpc (Makarova et al. 1998) Our photometry is in agreement with Makarova et al.; our brightest three supergiants do occur at , as they obtain from ground-based measurements. However, the WFPC2 reveals that these supergiants are very bright indeed, a full five magnitudes in brighter than the TRGB. The apparently large difference in distance estimates is in fact not very surprising given the uncertainties in using the brightest supergiant method for such a faint galaxy (Greggio 1986). For a distance of 6.7 Mpc, the apparent magnitude found by Makarova et al. corresponds to an abolute magnitude of .
3.3 Morphology
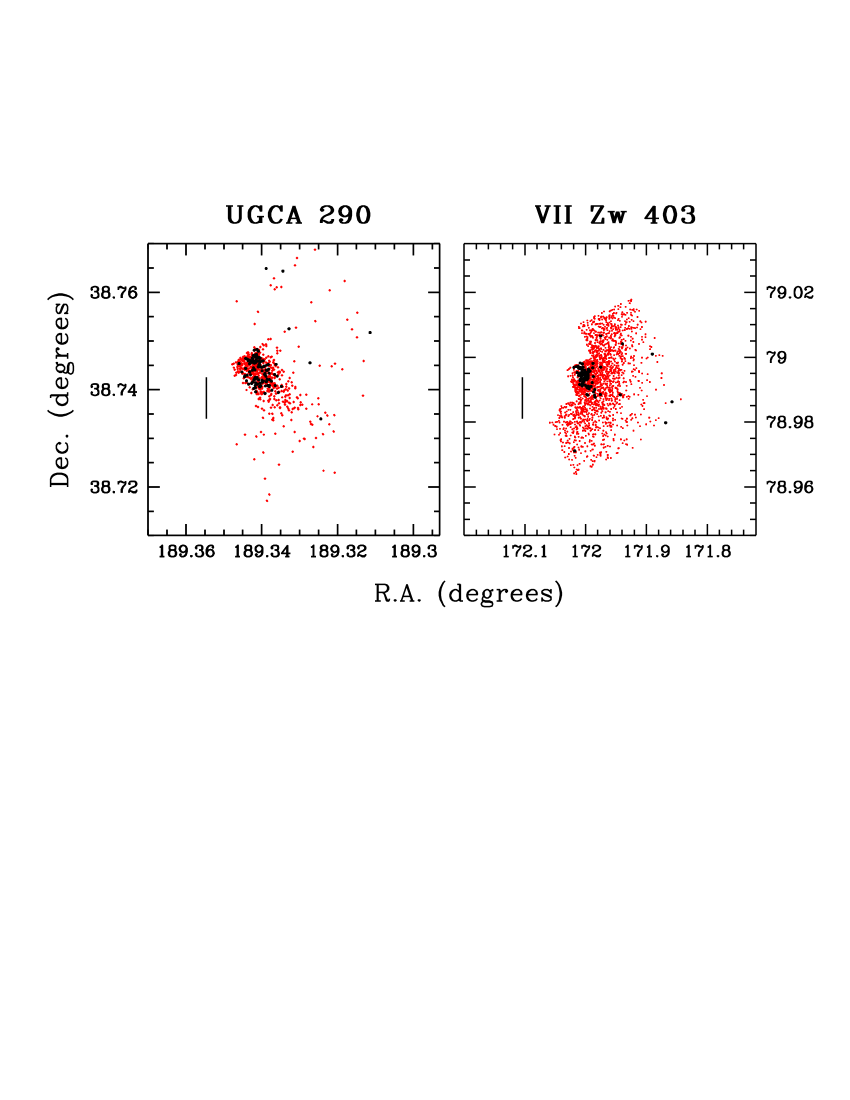
Figure 3 illustrates the difference in morphologies between VII Zw 403 and UGCA 290 by plotting the spatial distributions of “young” stars and “old” stars. Although most regions of the CMD can contain stars with a range of ages, very young and old populations are fairly straightforward to identify. The region with contains stars with ages Myr, while the region with contains stars with ages of at least 0.5 Gyr. For clarity, we leave out the stars in other regions of the CMD. In order to compare the intrinsic morphologies of the two galaxies fairly, we include only stars brighter than an absolute magnitude of . Note that in both galaxies, our completeness is better than 80% for such stars. Our completeness is actually better for UGCA 290, despite its greater distance, because of our longer exposure times and dithering, and the fact that this galaxy is simply not as crowded. The plots in Figure 3 are set to the same kpc scale. There is a significant difference between the morphologies of these two galaxies, even keeping in mind that part of the UGCA 290 halo is missed to the northeast.
Another difference in morphology, which is clear upon comparing the images directly, is that VII Zw 403 exhibits several small, bright H II regions, while the H II in UGCA 290 is more diffuse. From our continuum-subtracted F656N image, the total H flux of UGCA 290 is erg/s/cm2, which for an extinction of 0.1 mag corresponds to a luminosity of erg/s. This is about of the H luminosity of VII Zw 403 (Lynds et al. 1998). It is consistent with the observed relationship between and for irregular galaxies (Hopp 1999). For a Salpeter M☉ initial mass function, this luminosity correponds to a star formation rate of 0.0085 M☉/yr (Hunter & Gallagher 1986).
4 Discussion
There may in fact be a large range of BCD types with very similar recent star formation histories. Already, three other iE BCDs have shown similar star formation histories in the near-IR, with extended blue and red plumes, asymptotic giant branches, and red giants, indicating star formation over at least 1 Gyr with no major periods of quiescence during that time (Hopp et al. 1999). The stellar content of UGCA 290 shows that these features are not limited to the classic iE type of BCD. Perhaps these galaxies, despite the differences in their early histories reflected in their red halos, have recently found themselves in a similar star-forming environment — possibly due to infall of similar gas clouds from the intergalactic medium combined with isolated geography. It is tempting to speculate on universal changes which would explain these similarities. For example, perhaps universal conditions several billion years ago caused these galaxies to burst as part of the population we see as the faint blue excess, and a certain cool-down time was needed after that burst to allow gas to settle back into the small gravitational potential well and again reach a critical density for star formation. A more complete inventory of the properties of UGCA 290 and other key BCDs is needed to answer these questions.
Another implication of our result applies to the current debate which is raging over the status of those BCDs which exhibit no red background sheet in ground-based CCD images. If the star-forming region of UGCA 290 were only slightly more extended relative to its background sheet, the red giant population could easily be hidden to ground-based observation. Our results support the position that the absence of an obvious background sheet does not show that a BCD is undergoing its first bout of star formation.
References
- (1)
- (2) Aloisi, A., Tosi, M, & Greggio, L. 1999, AJ, 118, 302
- (3)
- (4) Arp, H. 1966, ApJS, 14, 1
- (5)
- (6) Doublier, V., Kunth, D., Courbin, F., & Magain, P. 2000, A&A, 353, 887
- (7)
- (8) Fagotto, F., Bressan, A., Bertelli, B. & Chiosi, C. 1994, A&AS, 104, 365
- (9)
- (10) Greggio, L. 1986 A&A, 160, 111
- (11)
- (12) Holtzman, J.A., Burrows, C.J., Casertano, S., Hester, J.J., Trauger, J.T., Watson, A.M. & Worthey, G. 1995, PASP, 107, 1065
- (13)
- (14) Hopp, U. 1999, A&AS, 134, 317
- (15)
- (16) Hopp, U., Schulte-Ladbeck, R.E., Greggio, L., Crone, M.M 1999, in ASP Conf. Ser. 192, Spectrophotometric Dating of Stars and Galaxies, ed. I. Huberny, S. Heap, & R. Cornett, (ASP), 85
- (17)
- (18) Hunter, D.A. & Gallagher, J.S. 1986, PASP, 98, 5
- (19)
- (20) Izotov, Y.I. & Thuan, T.X. 1999, ApJ, 511, 639
- (21)
- (22) Karachentsev, I.D. & Makarov, D.I. 1998, A&A 331, 891-893
- (23)
- (24) Kunth, D. & Östlin, G. 2000, A&A Rev., 10, 1
- (25)
- (26) Lee, M.G., Freedman, W.L., & Madore, B.F. 1993, ApJ, 417, 553
- (27)
- (28) Loose & Thuan, T.X. 1986, in Star-Forming Dwarf Galaxies and Related Objects, ed. D. Kunth, T.X. Thuan, & J.T.T. Van (Gif-Sur-Yvette: Editions Frontieres), 73
- (29)
- (30) Lynds, R., Tolstoy, E., O’Neil Jr,. E.J., & Hunter, D.A. 1998, AJ, 116, 146
- (31)
- (32) Makarova, L., Karachentsev, I., Takalo, L.O., Heinamaki, P., & Valtonen, M., 1998, A&AS, 128, 459-470
- (33)
- (34) Östlin, G. 2000, ApJ, 535, L99
- (35)
- (36) Schlegel, D.J., Finkbeiner, D.P., & Davis, M. 1998, ApJ, 500, 525
- (37)
- (38) Schulte-Ladbeck, R.E., Crone, M.M., & Hopp, U. 1998, ApJ, 493, L23
- (39)
- (40) Schulte-Ladbeck, R.E., Hopp, U., Crone, M.M., & Greggio, L. 1999, ApJ, 525, 709
- (41)
- (42) Schulte-Ladbeck, R.E., Hopp, U., Greggio, L., Crone, M.M., & Drozdovsky, I. 2000, in preparation
- (43)
- (44) Searle, L. & Sargent, W.L.W. 1972, ApJ, 173, 25
- (45)
- (46) Thuan, T.X., & Martin, G.E. 1981, ApJ, 247, 823
- (47)
- (48) Tolstoy, E. 1999, in IAU Symposium 192, eds. P. Whitelock & R. Cannon (ASP), 218
- (49)
- (50) Vorontsov-Velyaminov, B.A. 1959, Atlas and Catalogue of Interacting Galaxies, Part I, Moscow University