Eclipse mapping of accretion discs 11institutetext: Departamento de Física, UFSC, Campus Trindade, 88040-900, Florianópolis, Brazil
Eclipse mapping of accretion discs
Abstract
The eclipse mapping method is an inversion technique that makes use of the information contained in eclipse light curves to probe the structure, the spectrum and the time evolution of accretion discs. In this review I present the basics of the method and discuss its different implementations. I summarize the most important results obtained to date and discuss how they have helped to improve our understanding of accretion physics, from testing the theoretical radial brightness temperature distribution and measuring mass accretion rates to showing the evolution of the structure of a dwarf novae disc through its outburst cycle, from isolating the spectrum of a disc wind to revealing the geometry of disc spiral shocks. I end with an outline of the future prospects.
1 Introduction
Accretion discs are cosmic devices that allow matter to efficiently accrete over a compact source by removing its angular momentum via viscous stresses while transforming the liberated gravitational potential energy into heat and, thereafter, radiation acpower . They are widespread in astrophysical environments, from sheltering the birth of stars to providing the energetics of quasars and active galactic nuclei. It is, however, in mass-exchanging binaries such as non-magnetic Cataclysmic Variables (CVs) that the best environment for studies of accretion discs are possibly found. In these close binaries mass is fed to a white dwarf by a Roche lobe filling companion star (the secondary) via an accretion disc, which usually dominates the ultraviolet and optical light of the system bible .
Accretion discs in CVs cover a wide range of accretion rates, Ṁ, and viscosity regimes. For example, the sub-class of dwarf novae comprises low-mass transfer CVs showing recurrent outbursts (of 2–5 magnitudes, on timescales of weeks to months) which reflect changes in the structure of the discs – from a cool, optically thin, low viscosity state to a hot, optically thick, high viscosity state – and which are usually parameterized as a large change in the mass accretion rate (Ṁ) pvw . On the other hand, nova-like variables seem to be permanently in a high viscosity state, presumably as a result of the fact that the accretion rate is always high.
The temperatures in CV discs may vary from 5000 K in the outer regions to over 50000 K close to the disc centre, and the surface density may vary by equally significant amounts over the disc surface. Therefore, the spectrum emitted by different regions of the accretion disc may be very distinct. Additionally, the bright spot (formed by the impact of the gas stream from the inner Lagrangian point on the disc rim), the white dwarf at disc centre, and the secondary star may all contribute to the integrated light of the binary. Because what one directly observes is the combination of the spectra emitted from these diverse regions and sources, the interpretation of disc observations is usually plagued by the ambiguity associated with composite spectra. The most effective way to overcome these difficulties is with spatially resolved data.
Two complementary indirect imaging techniques were developed in the 1980’s that provide spatially resolved observational constraints on accretion discs on angular scales of micro arcseconds – well beyond the capabilities of current direct imaging techniques. One is Doppler Tomography mh88 , which is treated in detail elsewhere is this book doppler . It uses the changes in line emission profile with orbital phase to probe the dynamics of accretion discs and is applicable to binaries over a large range of orbital inclinations, although it is restricted to emission line data.
The other is Eclipse Mapping h85 . It assembles the information contained in the shape of the eclipse into a map of the accretion disc surface brightness distribution. While its application is restricted to deeply eclipsing binaries, eclipse mapping can be used with continuum as well as line data. When applied to time-resolved spectroscopy through eclipses this technique delivers the spectrum of the disc at any position on its surface. Information on the radial dependence of the temperature and vertical temperature gradients (for optically thick regions), or temperature, surface density and optical depth (where the disc is optically thin) can be obtained by comparing such spectra with the predictions of models of the vertical disc structure. The spatial structure of the emission line regions over the disc can be similarly mapped from data of high spectral resolution. Moreover, an eclipse map yields a snapshot of an accretion disc at a given time. By eclipse mapping an accretion disc at different epochs it is possible to follow the secular changes of its radial brightness temperature distribution – for example, thought the outburst cycle of a dwarf nova – allowing crucial tests of accretion disc instability and viscosity models.
After more than a decade of experiments, eclipse mapping has now become a mature and well established technique. There are already many good reviews on this topic in the literature hm86 ; h93 ; bible ; w94 . The main aim of this review is therefore not to provide another description of the technique, but to make a summary of the results obtained so far giving emphasis on the impact they had on our understanding of the physics of accretion discs.
2 The maximum entropy eclipse mapping method
2.1 The principles
The three basic assumptions of the standard eclipse mapping method are: (i) the surface of the secondary star is given by its Roche equipotential, (ii) the brightness distribution is constrained to the orbital plane, and (iii) the emitted radiation is independent of the orbital phase. The first assumption seems reasonably robust. The others are simplifications that do not hold in all situations. A discussion on the departures from assumptions (ii) and (iii) is presented in section 2.5.
A grid of intensities centred on the white dwarf, the eclipse map, is defined in the orbital plane. The eclipse geometry is specified by the inclination , the binary mass ratio (=, where and are the masses of, respectively, the secondary star and the white dwarf) and the phase of inferior conjunction h85 ; h93 . Given the geometry, a model eclipse light curve can be calculated for any assumed brightness distribution in the eclipse map. A computer code then iteratively adjusts the intensities in the map (treated as independent parameters) to find the brightness distribution the model light curve of which fits the data eclipse light curve within the uncertainties. The quality of the fit is checked with a consistency statistics, usually the reduced . Because the one-dimensional data light curve cannot fully constrain a two-dimensional map, additional freedom remains to optimize some map property. A maximum entropy (MEM) procedure sb84 ; s87 is used to select, among all possible solutions, the one that maximizes the entropy of the eclipse map with respect to a smooth default map.
Figure 1 illustrates the simulation of the eclipse of a fitted brightness distribution while showing the comparison between the resulting model light curve and the data light curve. The geometry in this case is and .
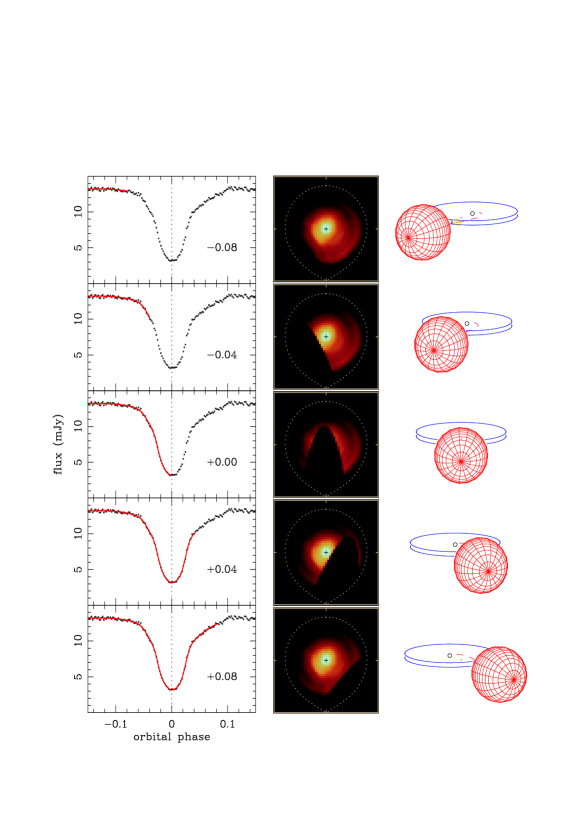
The left-hand panels show the data light curve (small dots) and the model light curve (solid line) as it is being drawn at five different orbital phases along the eclipse (indicated in the lower right corner). The right-hand panels depict the corresponding geometry of the binary for each orbital phase, in which the secondary star progressively occults the accretion disc as well as the white dwarf and the bright spot. The middle panels show the best-fit disc brightness distribution and how it is progressively covered by the dark shadow of the secondary star during the eclipse. At phase only a small fraction of the outer, faint disc regions are eclipsed and there is only a small reduction in flux in the light curve. The eclipse of the bright spot at the edge of the disc and of the bright inner disc regions occur at about the same time (slightly after ) and coincide with the steepest ingress in the light curve. The flux at phase does not go to zero because a significant fraction of the disc remains visible at mid-eclipse. The asymmetry in the egress shoulder of the light curve maps into an enhanced brightness emission in the trailing side of the disc (the right hemisphere of the eclipse map in Fig. 1).
2.2 The expressions
The expressions governing the eclipse mapping problem are as follows. One usually adopts the distance from the disc centre to the internal Lagrangian point, , as the length scale. With this definition the primary lobe has about the same size and form for any reasonable value of the mass ratio h85 . If the eclipse map is an points flat, square grid of side , each of its surface element (pixel) has an area and an associated intensity . The solid angle comprised by each pixel as seen from the earth is then
| (1) |
where is the distance to the system. The value of defines the area of the eclipse map while the choice of sets its spatial resolution.
The entropy of the eclipse map with respect to the default map is defined as
| (2) |
where and are written as
| (3) |
Other functional forms for the entropy appear in the literature h93 ; bible . These are equivalent to (2) when and are written in terms of proportions.
The default map is generally defined as a weighted average of the intensities in the eclipse map,
| (4) |
where the weight function is specified by the user. A priori information about the disc (p.ex., axi-symmetry) is included in the default map via . Prescriptions for the weight function are discussed in section 2.3. In the absence of any constraints on , the entropy has a maximum when , or when the eclipse map and the default map are identical.
The model eclipse light curve is derived from the intensities in the eclipse map,
| (5) |
where is the orbital phase. The occultation function specifies the fractional visibility of each pixel as a function of orbital phase and may include fore-shortening and limb darkening factors h93 ; r98 ; w94 . The fractional visibility of a given pixel may be obtained by dividing the pixel into smaller tiles and evaluating the Roche potential along the line of sight for each tile to see if the potential falls below the value of the equipotential that defines the Roche surface. If so, the tile is occulted. The fractional visibility of the pixel is then the sum of the visible tiles divided by the number of tiles.
The consistency of an eclipse map may be checked using the as a constraint function,
| (6) |
where is the data light curve, are the corresponding uncertainties, is the residual at the orbital phase , and is the number of data points in the light curve. Alternatively, the constraint function may be a combination of the and the R-statistics bs93 ,
| (7) |
to minimize the presence of correlated residuals in the model light curve bs91 . For the case of uncorrelated normally distributed residuals, the R-statistics has a Gaussian probability distribution function with average zero and unity standard deviation. Requiring the code to achieve an , is equivalent to asking for a solution with uncorrelated residuals in the model light curve.
The final MEM solution is the eclipse map that is as close as possible to its default map as allowed by the constraint imposed by the light curve and its associated uncertainties h93 ; r98 . In matematical terms, the problem is one of constrained maximization, where the function to maximize is the entropy and the constraint is a consistency statistics that measures the quality of the fitted model to the data light curve. Different codes exist to solve this problem. Many of the eclipse mapping codes are based on the commercial optimization package MEMSYS sb84 . Alternative implementations using conjugate-gradients algorithms bs91 ; bs93 , CLEAN-like algorithms spruit94 and, more recently, genetic algorithms bob00 are also being used.
2.3 Default maps
A crucial aspects of eclipse mapping is the selection of the weight function for the default map, which allows the investigator to steers the MEM solution towards a determined type of disc map. A list of different prescriptions for is given in Table 1.
| weight functions | reference | |
|---|---|---|
| A) most uniform map: | h85 | |
| B) smoothest map: | h85 | |
| C) most axisymmetric map: | h85 | |
| (full azimuthal smearing) | ||
| D) limited azimuthal smearing: | r93 | |
| (constant angle ) | ||
| E) limited azimuthal smearing: | bsh | |
| (constant arc length ) | ||
| NOTES: is the distance between pixels and ; and are the distances | ||
| from pixels and to the centre of the disc; is the azimuthal angle between | ||
| pixels and ; and is the arc-length between pixels and . | ||
Choosing (option A) results in a uniform default map and will lead to the most uniform eclipse map consistent with the data. This happens not to be a good choice for eclipse mapping because it results in a map severely distorted by criss-crossed artifacts bob97 ; h85 ; spruit94 . This effect may be reduced by setting the weight function as a Gaussian profile of width (option B), which results in the smoothest map that fits the data.
The third case (option C) sets as an axi-symmetric average of the eclipse map and will lead to the most nearly axi-symmetric map that fits the data. It suppresses the azimuthal information in the default map while keeping the radial structure of on scales greater than . This seems a reasonable choice for accretion disc mapping because one expects the disc material to be roughly in Keplerian orbits, so that local departures from axi-symmetry will tend to be diminished by the strong shear. This is a commonly used option and is also known as the default map of full azimuthal smearing.
The full azimuthal smearing default results in rather distorted reproduction of asymmetric structures such as a bright spot at the disc rim. In this case, the reconstructed map exhibits a lower integrated flux in the asymmetric source region, the excess being redistributed as a concentric annulus about the same radial distance. By limiting the amount of azimuthal smearing it is possible to alleviate this effect and to start recovering azimuthal information in the accretion disc. Two prescriptions in this regard were proposed. Reference r93 limited the amount of azimuthal smearing by averaging over a polar Gaussian weight function of constant angles along the map (option D) while bsh chosen to use a polar Gaussian function of constant arc length through the map (option E).
Figure 2 shows the effects of the three last weight functions when applied to an artificial map containing three Gaussian spots at different radial distances from its centre.
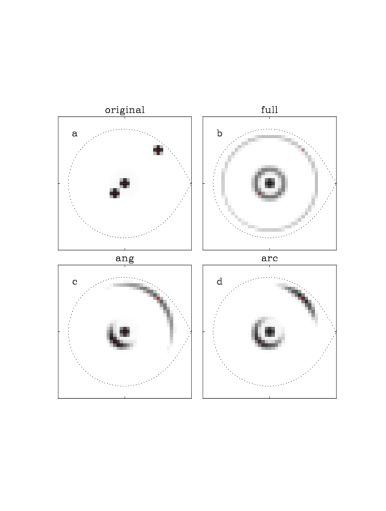
The default with constant angles is more efficient to reproduce asymmetries in the inner disc regions (such as an accretion column, or the expected dipole pattern for velocity-resolved line emission mapping, or in presence of a bipolar wind emanating from the inner disc), while the default of constant arc length is more efficient in recovering asymmetries in the outer parts of the disc (such as a bright spot at disc rim, or in the case of an eccentric disc). The choice between these two default functions, in a given case, is defined by whether it is more important to have a better azimuthal resolution at the inner or outer disc regions. The radial profile is not affected by this choice.
Other possibilities concerning the default map were proposed in terms of the combination of different weight functions bob97 ; spruit94 . Particularly, the mix of the smoothest and the most axi-symmetric defaults is, in a sense, equivalent to the default of limited azimuthal smearing and leads to similar results. Another interesting proposal is that of a negative weight function, that may be used to avoid or minimize a certain map property (p.ex., the presence of the undesired criss-crossed arcs) spruit94 .
2.4 The uneclipsed component
Reference rpt92 found that the entropy function can be a useful tool to signal and to isolate the fraction of the total light which is not coming from the accretion disc plane. They noted that when the light curve is contaminated by the presence of additional light (e.g., from the secondary star) the reconstructed map shows a spurious structure in the regions farthest away from the secondary star (the upper lune of the eclipse maps in Fig. 1, hereafter called the ‘back’ side of the disc). This is because the eclipse mapping method assumes that all the light is coming from the accretion disc, in which case the eclipse depth and width are correlated in the sense that a steeper shape corresponds to a deeper eclipse. The addition of an uneclipsed component in the light curve (i.e., light from a source other than the accretion disc) ruins this correlation. To account for the extra amount of light at mid-eclipse and to preserve the brightness distribution derived from the eclipse shape the algorithm inserts the additional light in the region of the map which is least affected by the eclipse, leading to a spurious front-back disc brightness asymmetry. Since the entropy measures the amount of structure in the map, the presence of these spurious structures is flagged with lower entropy values.
The correct offset level may be found by comparing a set of maps obtained with different offsets and selecting the one with highest entropy. Alternatively, the value of the zero-intensity level can be included in the mapping algorithm as an additional free parameter to be fitted along with the intensity map in the search for the MEM solution b95 ; r94 . A detailed discussion on the reliability and consistency of the estimation of the uneclipsed component can be found in bsh .
2.5 Beyond the standard assumptions
The standard eclipse mapping assumes a simple flat, geometrically thin disc model. Real discs may however violate this assumption in the limit of high Ṁ. Disc opening angles of are predicted for Ṁ mm82 ; smak92 . At large inclinations () this may lead to artificial front-back asymmetries in the eclipse map (similar to those discussed in section 2.4) because of the different effective areas of surface elements in the front and back sides of a flared disc as seen by an observer on Earth. In extreme cases, this may lead to obscuration of the inner disc regions by the thick disc rim (e.g., knigge00 ).
Motivated by the front-back asymmetry that appeared in the flat-disc map and by the difficulties in removing the asymmetry with the assumption of an uneclipsed component, rob95 ; rob99 introduced a flared disc in their eclipse mapping of ultraviolet light curves of the dwarf nova Z Cha at outburst maximum. They found that the asymmetry vanishes and the disc is mostly axi-symmetric for a disc opening angle of .
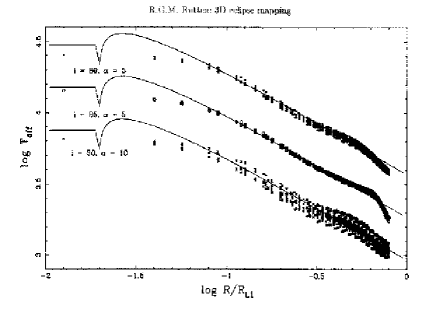
Simulations r98 show that eclipse mapping reconstructions obtained with the flat-disc assumption result in good reproduction of the radial temperature distribution of flared accretion discs provided that the inner disc regions are not obscured by the disc rim (Fig. 3).
Reference w94 shows that it is usually impossible to distinguish between a flared disc and an uneclipsed component to the total light. Both effects lead to the appearance of spurious structures in the back regions of the disc, and eclipse maps obtained with either model may lead to equally good fits to the data light curve. Reference bc00a pointed out that spectral eclipse mapping could help in evaluating the importance of each of these effects in a given case. If the uneclipsed component is caused by an optically-thin, vertically-extended disc wind, the uneclipsed spectrum shows a Balmer jump in emission plus strong emission lines, while in the case of a flared disc the spurious uneclipsed spectrum should reflect the difference between the disc spectrum of the back (deeper atmospheric layers seen at lower effective inclinations) and the front (upper atmospheric layers seen at grazing incidence) sides and should mainly consist of continuum emission filled with absorption lines.
Because of the assumption that the emitted radiation is independent of the orbital phase, in the standard eclipse mapping method all variations in the eclipse light curve are interpreted as being caused by the changing occultation of the emitting region by the secondary star. Thus, out-of-eclipse brightness changes (p.ex., orbital modulation due to anisotropic emission from the bright spot) has to be removed before the light curves can be analyzed. The usual approach is to interpolate the out-of-eclipse light curve across the eclipse phases h85 ; rpt92 . An alternative approach is to apply a light curve decomposition technique to separate the contributions of the white dwarf, bright spot and accretion disc wood86 ; wood89 . This technique however requires high signal-to-noise light curves and good knowledge of the contact phases of the white dwarf and bright spot, which limits its application to a few objects.
A step to overcome these limitations was done by bob97 with the inclusion of a disc rim in the eclipse mapping method. The out-of-eclipse modulation is modeled as the fore-shortening of an azimuthally-dependent brightness distribution in the disc rim. This procedure allows to recover the azimuthal (phase) dependency of the bright spot emission. It however requires a good estimate of the outer disc radius.
The more advanced code of r98 , including a flared disc, the disc rim, and the surface of the Roche-lobe filling secondary star, expanded the eclipse mapping method into a three-dimensional mapping technique. Nevertheless, it comes along with a significant increase in the degrees of freedom that aggravates the problem of non-uniqueness of solutions.
2.6 Performance under extreme conditions
In an eclipse mapping reconstruction, the brightness of a given surface element is derived from the information given by the changes in flux caused by its occultation (at ingress) and reappearance (at egress) from behind the secondary star. In the case of an eclipse light curve with incomplete phase coverage, there are regions in the disc for which only one of these pieces of information is available. Moreover, for a system with low inclination, there are regions in the back side of the disc which are never covered by the shadow of the secondary star and, therefore, there is no information about the brightness distribution of these regions on the shape of the light curve. This section presents simulations aiming to assess the reliability of eclipse mapping reconstructions obtained under the combined extreme conditions of incomplete eclipse coverage, low binary inclination and relatively low signal-to-noise data.
Four artificial brightness distributions with asymmetric polar Gaussian spots on the back, front, leading and trailing sides of the disc were constructed (Fig. 4). A low-inclination geometry ( and ) was adopted to simulate the eclipses and light curves with signal-to-noise and an incomplete set of orbital phases were produced. The artificial light curves were analyzed with the eclipse mapping method and the results are shown in Fig. 4.
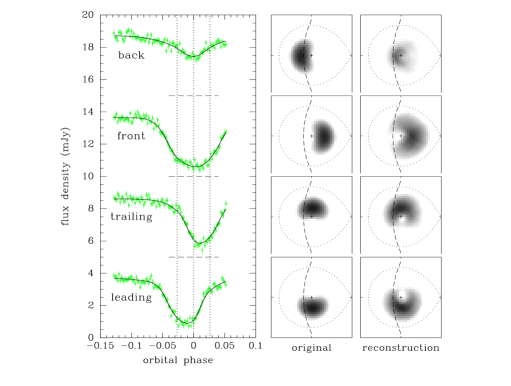
For the adopted set of orbital phases, the leading side of the disc (the lower hemisphere of the eclipse maps in Fig. 4) is mapped by the moving shadow of the secondary star both during ingress and egress, whereas much of the trailing side of the disc is only mapped by the secondary star at ingress phases. Dashed lines in the eclipse maps mark the locus of the far edge of the shadow of the secondary star along the eclipse. Regions to the left of this line are never covered by the secondary star.
Despite the incomplete eclipse coverage, good quality reconstructions are obtained for the front, trailing and leading maps. The spots appear spread in radius due to the low signal-to-noise of the light curves, and are elongated in azimuth because of the intrinsic azimuthal smearing effect of the eclipse mapping method. The results are equally good for the leading and the trailing maps, despite the fact that the spot in the latter case is located in the disc region for which there is limited information in the shape of the light curve. For the back map, much of the asymmetric brightness distribution completely escapes eclipse. Not surprisingly, the eclipse map does not correctly reproduce the brightness distribution in the disc regions beyond those covered by the secondary star. The missing flux appears in the uneclipsed component.
These simulations show that eclipse mapping obviously fails to recover the brightness distribution of disc regions for which there is no information in the shape of the eclipse, but performs reasonably well in the case of incomplete phase coverage even with relatively low signal-to-noise data.
The brightness distribution of the back map approximately simulates the intrinsic front-back asymmetry of a flared disc as seen at a high inclination angle (). It is fortunately that, in these cases, the shadow of the secondary star maps most (if not all) of the primary Roche lobe for any reasonable mass ratio.
3 A summary of results
When eclipse mapping appeared in the mid-1980’s, the standard picture of an accretion disc in a CV was that of a flat, nearly axi-symmetric disc with a bright spot on its edge. This section reviews some of the eclipse mapping results that helped to improve this picture either by allowing key tests of theoretical expectations or by revealing new and unexpected aspects of the physics of accretion discs.
3.1 Classical results
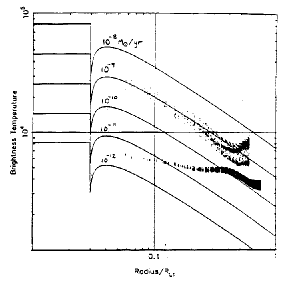
Early applications of the technique were useful to show that accretion discs in outbursting dwarf novae hc85 and in long-period novalike variables hs85 ; rpt92 closely follow the expected radial dependence of temperature with radius for a steady-state disc, , and to reveal that the radial temperature profile is essentially flat in the short period quiescent dwarf novae wood86 ; wood89 ; wood92 (Fig. 5). This suggests that the viscosity in these short period systems is much lower in quiescence than in outburst, lending support to the disc instability model, and that their quiescent discs are far from being in a steady-state. Eclipse mapping studies also contributed to the puzzle about the SW Sex stars – a group of mostly eclipsing novalike variables with periods in the range 3-4 hr that display a number of unexplained phenomena – by showing that the radial temperature profile in these systems is noticeably flatter than the law bsh ; rpt92 . A flat radial temperature distribution is also suggested for the old novae V Per, that lies in the middle of the CV period gap was92 . Unfortunately, this result is rather uncertain because it is based on uncalibrated white-light data and there is a large uncertainty on the eclipse geometry. A comprehensive account of these pioneering results can be found in h93 .
It has been a usual practice to convert the intensities in the eclipse maps to blackbody brightness temperatures and then compare them to the radial run of the effective temperature predicted by steady state, optically thick disc models. A criticism about this procedure is that a monochromatic blackbody brightness temperature may not always be a proper estimate of the disc effective temperature. As pointed out by b98 , a relation between these two quantities is non-trivial, and can only be properly obtained by constructing self-consistent models of the vertical structure of the disc. Nevertheless, the brightness temperature should be close to the effective temperature for the optically thick disc regions.
From the diagram it is possible to obtain an independent estimate of the disc mass accretion rate. Reference h93 compiled the inferred mass accretion rates from a dozen of eclipse mapping experiments to construct an Ṁ diagram. An updated version of this diagram is shown in Fig. 6. It seems a bit disappointing that the diagram is still loosely populated. In particular, there is yet no eclipse mapping estimate of Ṁ for a system inside the 2-3 hr CV period gap. There is a significant scatter in the Ṁ derived from different experiments for a given object (e.g., in UX UMa, from to yr-1 at ). Whereas part of this scatter is possibly a real effect due to long-term changes in the mass transfer rates, it stands as a warning that one should be careful in interpreting mass accretion rates derived from the brightness temperature distributions, as discussed above.
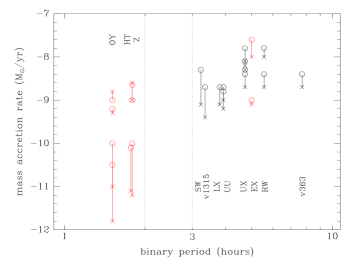
According to current evolutionary scenarios, CVs should evolve towards shorter orbital periods with decreasing mass transfer rates as a consequence of orbital angular momentum losses due mainly to magnetic braking (for systems above the period gap) or gravitational radiation (for systems below the gap) ps81 ; p84 . In Fig. 6 it appears that there is a tendency among the steady-state discs of novalike variables to show larger Ṁ for longer binary period – in agreement with the above expectation – and that the discs of novalike variables and outbursting dwarf novae have comparable Ṁ. The mass accretion rates in the eclipse maps of novalike variables increase with disc radius. The departures from the steady-state disc model are more pronounced for the SW Sex stars (period range 3-4 hs). Illumination of the outer disc regions by the inner disc or mass ejection in a wind from the inner disc are possible explanations for this effect.
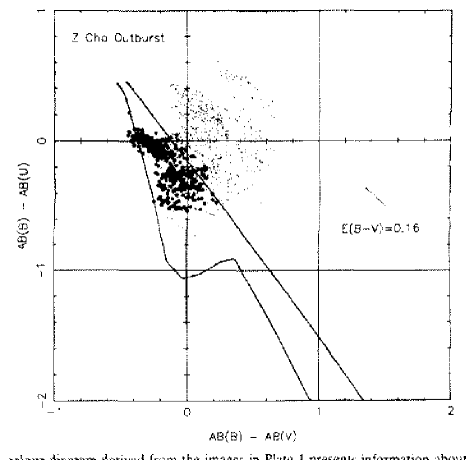
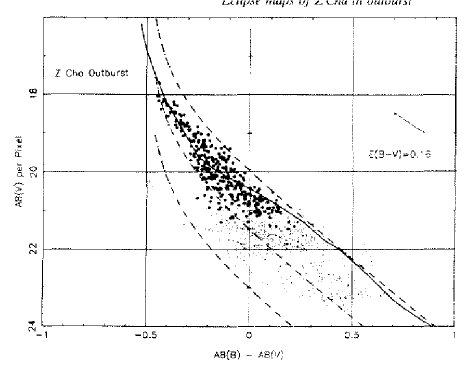
Multi-colour eclipse mapping is useful to probe the spectrum emitted by the different parts of the disc surface. Two-colour diagrams show that the inner disc regions of outbursting dwarf novae b3 ; hc85 and of novalike variables b95 ; bsh ; hs85 are optically thick with a vertical temperature gradient less steep than that of a stellar atmosphere, and that optically thin, chromospheric emission appears to be important in the outer disc regions (Fig. 7). The fact that the emission from the inner disc regions is optically thick thermal radiation opens the possibility to use a colour-magnitude diagram to obtain independent estimates of the distance to the binary with a procedure similar to cluster main-sequence fitting. Distance estimates with this method were obtained for Z Cha hc85 , OY Car b3 , UU Aqr bsh , RW Tri hs85 and UX UMa b95 .
3.2 Spectral studies
The eclipse mapping method advanced to the stage of delivering spatially-resolved spectra of accretion discs with its application to time-resolved eclipse spectrophotometry r93 . The time-series of spectra is divided up into numerous spectral bins and light curves are extracted for each bin. The light curves are then analyzed to produce a series of monochromatic eclipse maps covering the whole spectrum. Finally, the maps are combined to obtain the spectrum for any region of interest on the disc surface.
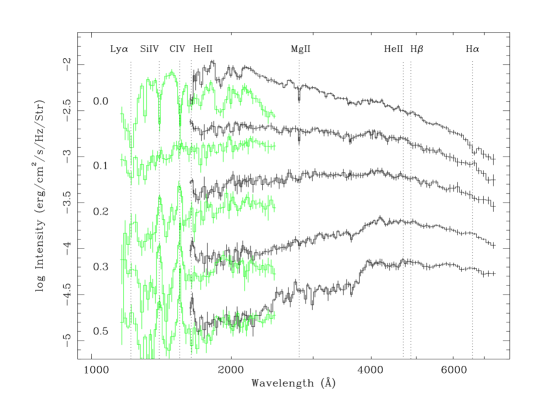
The spectral mapping analysis of the nova-like variables UX UMa b95 ; b98 ; r93 ; r94 and UU Aqr bssh shows that the inner accretion disc is characterized by a blue continuum filled with absorption bands and lines which cross over to emission with increasing disc radius (Fig. 8). The continuum emission becomes progressively fainter and redder as one moves outwards, reflecting the radial temperature gradient. Similar results were found for SW Sex gthesis and RW Tri groot . Not surprisingly, these high-Ṁ discs seem hot and optically thick in their inner regions and cool and optically thin in their outer parts.
However, the unprecedent combination of spatial and spectral resolution obtained with spectral mapping started to reveal a multitude of unexpected details. In UU Aqr, the lines show clear P Cygni profiles at intermediate and large disc radii in an evidence of gas outflow bssh . In UX UMa, the comparison of spatially resolved spectra at different azimuths reveals a significant asymmetry in the disc emission at ultraviolet wavelengths, with the disc side closest to the secondary star showing pronounced absorption bands and a Balmer jump in absorption. This effect is reminiscent of that observed previously in OY Car, where the white dwarf emission seems veiled by an “iron curtain” h94 , and was attributed to absorption by cool circumstellar material b98 . The spectrum of the infalling gas stream in UX UMa and UU Aqr is noticeably different from the disc spectrum at the same radius suggesting the existence of gas stream “disk-skimming” overflow that can be seen down to . Spectra at the site of the bright spot suggest optically thick gas, with the Balmer jump and the Balmer lines in absorption.
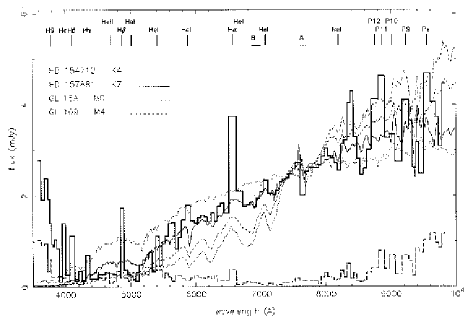
The spectrum of the uneclipsed component in these nova-like systems shows strong emission lines and the Balmer jump in emission indicating that the uneclipsed light has an important contribution from optically thin gas (Fig. 9). The lines and optically thin continuum emission are most probably emitted in a vertically extended disc chromosphere + wind b98 ; bssh . The uneclipsed spectrum of UX UMa at long wavelengths is dominated by a late-type spectrum that matches the expected contribution from the secondary star r94 . Thus, the uneclipsed component seems to provide an unexpected but interesting way of assessing the spectrum of the secondary star in eclipsing CVs.

Based on their spatially-resolved results, b98 suggested that the reason for the long standing discrepancies between the prediction of the standard disc model and observations of accretion discs in nova-like variables (e.g., knigge97 ; ladous ; w84 ) is not an inadequate treatment of radiative transfer in the disc atmosphere, but rather the presence of additional important sources of light in the system besides the accretion disc (e.g., optically thin continuum emission from a disc wind and possible absorption by circumstellar cool gas).
3.3 Spatial studies
Eclipse mapping has also been a valuable tool to reveal that real discs have more complex structures than in the simple axi-symmetric model.
Besides the normal outbursts, short-period dwarf novae (SU UMa stars) exhibit superoutbursts in which superhumps develop with a period a few per cent longer than the binary orbital period. Normal superhumps appear early in the superoutburst and fade away by the end of the plateau phase. Late superhumps, displaced in phase by roughly with respect to the normal superhumps, appear during decline and persist into quiescence bible . Eclipse mapping experiments have been fundamental in testing superhump models.
Reference o90 analyzed light curves of Z Cha during superoutburst with a modified eclipse mapping technique. Assuming that the superhump profile is fairly stable over a timescale of a dozen of binary orbits, he separated the eclipse of the superhump source by subtracting the light curve when the superhump maximum occurs far from eclipse from that in which the superhump is centred on the eclipse. The eclipse mapping of the resulting light curve show that the superhump light arises from the outer disc, and appears to be concentrated in the disc region closest to the secondary star. This result helped to establish the superhump model of whit88 , in which the normal superhumps are the result of an increased tidal heating effect caused by the alignment of the secondary star and an slowly precessing eccentric disc.
Further evidence in favour of the existence of eccentric discs in CVs comes from the recent study of permanent superhumps in the short-period novalike variable V348 Pup by rolfe00 . Their eclipse mapping analysis shows that the size of the disc emission region depends on superhump phase, and that the disc light centre is on the back side of the disc at superhump maximum. This phasing is reminiscent of that of the late superhumps in SU UMa stars. Their results indicate that the superhump maximum occurs when the secondary star is ligned up with the smallest disc radius, suggesting that these superhumps are the result of a modulation of the bright spot emission caused by the varying kinetic energy of the gas stream when it hits the disc edge vogt81 .
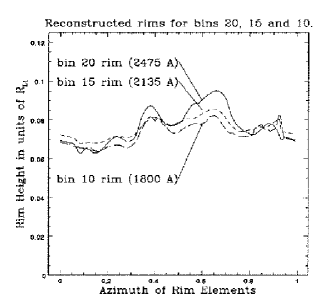
Ultraviolet observations of the dwarf nova OY Car in superoutburst show dips in the light curve coincident in phase with the optical superhump. Reference bill96 analyzed this data set with a modified version of the eclipse mapping method which simultaneously map the brightness distribution on the surface of the accretion disc and the vertical and azimuthal extent of a flaring at the edge of the disc. Their analysis indicates the presence of an opaque disc rim, the thickness of which depends on the disc azimuth and is large enough for the rim to obscure the centre of the disc at the dip phase (Fig. 10). These results are consistent with a model of normal superhumps as the consequence of time-dependent changes in the thickness of the edge of the disc, resulting in obscuration of the ultraviolet flux from the central regions and reprocessing of it into the optical part of the spectrum. Another evidence of discs with thick rims comes from the work of rob99 , who found that a relatively large disc opening angle is required in order to explain the ultraviolet eclipse light curves of Z Cha in outburst. It seems that the discs of dwarf novae become flared during normal outbursts and that the thickening during superoutbursts may be sufficient for the disc rim to obscure the inner disc regions.
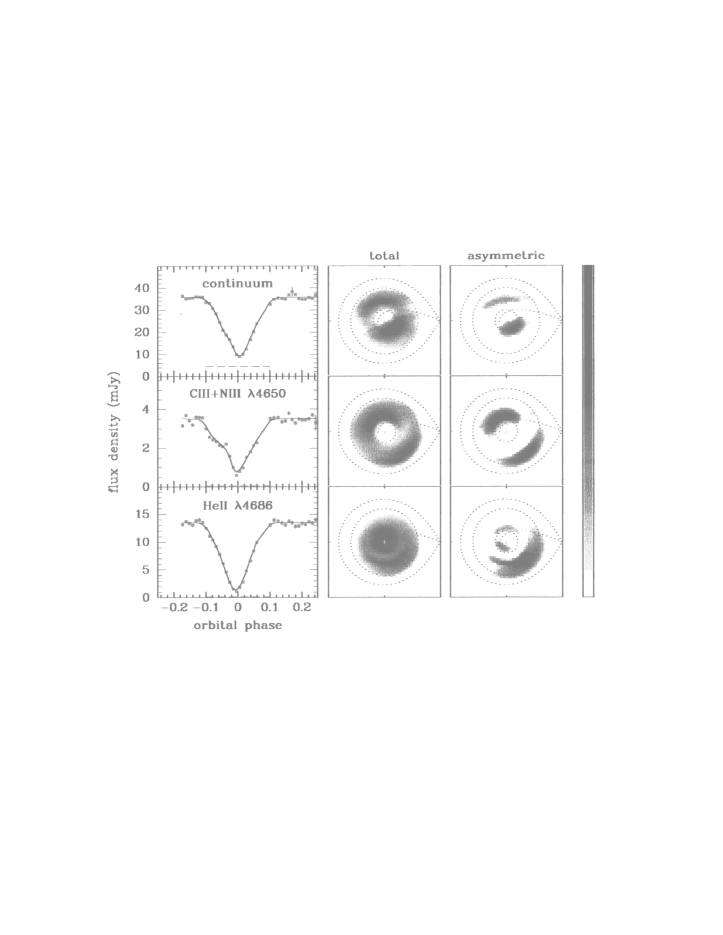
Tidally induced spiral shocks are expected to appear in dwarf novae discs during outburst as the disc expands and its outer parts feel more effectively the gravitational attraction of the secondary star makita ; steeghs . Eclipse mapping of IP Peg during outburst bhs helped to constrain the location and to investigate the spatial structure of the spiral shocks found in Doppler tomograms h99 ; steeghs97 . The spiral shocks are seen in the continuum and C III+N III emission line maps as two asymmetric arcs of degrees in azimuth extending from intermediate to the outer disc regions (Fig. 11). The He II eclipse map also shows two asymmetric arcs diluted by a central brightness source. The central source probably corresponds to the low-velocity component seen in the Doppler tomogram and is possibly related to gas outflow in a wind emanating from the inner parts of the disc. The comparison between the Doppler and eclipse maps reveal that the Keplerian velocities derived from the radial position of the shocks are systematically larger than those inferred from the Doppler tomography indicating that the gas in the spiral shocks has sub-Keplerian velocities. This experiment illustrates the power of combining the spatial information obtained from eclipse mapping with the information on the disc dynamics derived from Doppler tomography.
3.4 Time-resolved studies
Eclipse maps give snapshots of the accretion disc at a given time. Time-resolved eclipse mapping may be used to track changes in the disc structure, p.ex., to assess variations in mass accretion rate or to follow the evolution of the surface brightness distribution through a dwarf nova outburst cycle.
The observed changes in the radial temperature distribution (and mass accretion rate) of eclipse maps obtained at different epochs in the high viscosity, steady-state discs of the novalike variables UX UMa and UU Aqr are evidence that the mass transfer rate in these system is variable b95 ; bsh .
Eclipse maps of Z Cha during superoutburst show a bright rim in the outer disc regions which decreases in brightness relative to the inner regions as the superoutburst proceeds and the superhumps fade away wo88 . This underscores the indications that the superhumps are sited at the outer disc rim (section 3.3).
Reference r92a obtained eclipse maps of the dwarf nova OY Car along the rise to a normal outburst. Their maps show that the outburst starts in the outer disc regions with the development of a bright ring, while the inner disc regions remain at constant brightness during the rise. The flat radial temperature profile of quiescence and early rise changes, within one day, into a steep distribution that matches a steady-state disc model for Ṁ yr-1 at outburst maximum. Their results suggest that an uneclipsed component develops during the rise and contributes up to per cent of the total light at outburst maximum. This may indicate the development of a vertically-extended (and largely uneclipsed) disc wind, or that the disc is flared during outburst (see section 3.3).
Time-resolved eclipse mapping covering the decline of an outburst and of a superoutburst were obtained, respectively, for IP Peg bob97 and OY Car b3 . In both cases the radial temperature distribution evolves with the inward traveling of a transition front that leaves behind a cool disc ( K) while the temperatures at the inner disc remain almost constant at a higher value. The derived speed of this cooling front is km s-1 for OY Car and km s-1 for IP Peg.
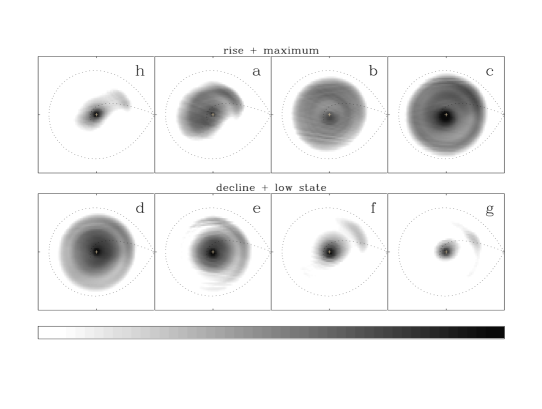
Eclipse maps covering the full outburst cycle of the long-period dwarf nova EX Dra bc00a show the formation of a one-armed spiral structure in the disc at the early stages of the outburst bc00b and reveal how the disc expands during the rise until it fills most of the primary Roche lobe at maximum light (Fig. 12). During the decline phase, the disc becomes progressively fainter until only a small bright region around the white dwarf is left at minimum light.
The evolution of the radial brightness distribution suggests the presence of an inward and an outward-moving heating front during the rise and an inward-moving cooling front in the decline (Fig. 13).
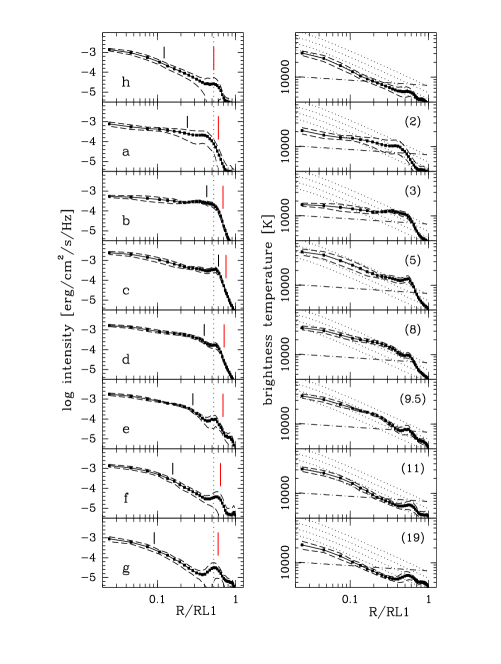
The inferred speed of the outward-moving heating front is of the order of 1 km s-1, while the speed of the cooling front is a fraction of that – in agreement with the results from IP Peg and OY Car. Their results also suggest a systematic deceleration of both the heating and the cooling fronts as they travel across the disc, in agreement with predictions of the disc instability model menou . A similar effect was seen in OY Car b3 . The radial temperature distributions shows that, as a general trend, the mass accretion rate in the outer regions is larger than in the inner disc on the rising branch, while the opposite holds during the decline branch. Most of the disc appears to be in steady-state at outburst maximum and, interestingly, also during quiescence. It may be that the mass transfer rate in EX Dra is sufficiently high to keep the inner disc regions in a permanent high viscosity, steady-state. An uneclipsed source of light was found in all maps, with a steady component associated to the secondary star and a variable component that is proportional to the out of eclipse brightness. Although disc flaring is likely in EX Dra during outburst, it seems it is not enough to account for the amplitude of the variation of the uneclipsed source. The variable component was therefore interpreted as emission arising from a disc wind, the strength of which depends on the disc mass accretion rate.
4 Future prospects
Eclipse mapping is a powerful probe of the radial and the vertical disc structures, as well as of the physical conditions in accretion discs. Partly due to the many experiments performed over the last 15 years, we have enriched our picture of accretion discs with an impressive set of new details such as gas outflow in disc winds, gas stream overflow, flared discs with azimuthal structure at their edge, ellipsoidal precessing discs, sub-Keplerian spiral shocks, and moving transition fronts during disc outbursts.
This is however far from being the end of the road. There are still many key eclipse mapping experiments remaining to be done. The spectral mapping of dwarf novae in outburst offers a unique opportunity to probe the physical conditions of disc spiral shocks and to critically test the disc instability model by comparing the spectra of disc regions ahead and behind the transition fronts. Eclipse mapping estimates of Ṁ for CVs inside the period gap may be instrumental in testing the current theories about the origin of the period gap. A still untouched area is the mapping of the flickering sources. Our understanding of this fundamental signature of accretion processes can certainly be considerably improved with flickering mapping experiments. The unprecedent combination of high spatial and high spectral resolution on the disc surface that can be achieved from time-resolved spectroscopic data yields an unbeatable amount of information to test and improve the current disc models. Fitting disc atmosphere models to the spatially-resolved spectra is the obvious next step to the spectral mapping experiments and will certainly be rewarding.
Eclipse mapping have been continuously expanding into new domains. Of promising prospects are the direct mapping of physical parameters in the accretion disc sonja , the mapping of the brightness distribution along the accretion stream and accretion column in magnetic CVs kgb00 , the 3-D mapping of flared discs and the surface of the secondary star dhillon ; r98 , and the combination of eclipse mapping and Doppler tomography bob99 .
The leap in knowledge about accretion physics that have been (and will probably continue to be) obtained by the study of close accreting binaries with tomographic techniques can lead to a better understanding of many other astronomical scenarios in which accretion discs may play an important role, such as AGNs and quasars – the environment of which are apparently more complicated and comparatively less well known than that of these compact binaries.
Acknowledgments
Thanks to Keith Horne and René Rutten for stimulating discussions and valuable advice on the art of eclipse mapping. CNPq and PRONEX are gratefully acknowledged for financial support through grants no. 300 354/96-7 and FAURGS/FINEP 7697.1003.00.
References
- (1) R. Baptista, M. S. Catalán: Astrophys. J. 539, L55 (2000)
- (2) R. Baptista, M. S. Catalán: Mon. Not. R. Ast. Soc., submitted
- (3) R. Baptista, E. T. Harlaftis, D. Steeghs: Mon. Not. R. Ast. Soc. 314, 727 (2000)
- (4) R. Baptista, K. Horne, R. Hilditch, K. O. Mason, J. E. Drew: Astrophys. J. 448, 395 (1995)
- (5) R. Baptista, K. Horne, R. A. Wade, I. Hubeny, K. Long, R. G. M. Rutten: Mon. Not. R. Ast. Soc. 298, 1079 (1998)
- (6) R. Baptista, C. Silveira, J. E. Steiner, K. Horne: Mon. Not. R. Ast. Soc. 314, 713 (2000)
- (7) R. Baptista, J. E. Steiner: Astron. & Astrophys. 249, 284 (1991)
- (8) R. Baptista, J. E. Steiner: Astron. & Astrophys. 277, 331 (1993)
- (9) R. Baptista, J. E. Steiner, K. Horne: Mon. Not. R. Ast. Soc. 282, 99 (1996)
- (10) I. Billington, et al.: Mon. Not. R. Ast. Soc. 279, 1274 (1996)
- (11) A. Bobinger, K. Horne, K. H. Mantel, S. Wolf: Astron. & Astrophys. 327, 1023 (1997)
- (12) A. Bobinger, H. Barwig, H. Fiedler, K.-H. Mantel, D. Simić, S. Wolf: Astron. & Astrophys. 348, 145 (1999)
- (13) A. Bobinger: Astron. & Astrophys. 357, 1170 (2000)
- (14) A. Bruch, D. Beele, R. Baptista: Astron. & Astrophys. 306, 151 (1996)
- (15) V. S. Dhillon: this volume
- (16) R. A. Downes, M. M. Shara: Pub. Ast. Soc. Pac. 105, 127 (1993)
- (17) J. Frank, A. R. King, D. J. Raine: Accretion Power in Astrophysics - 2nd edition (Cambridge University Press, Cambridge, 1992)
- (18) P. J. Groot: Optical Variability in Compact Source, PhD Thesis, University of Amsterdam (1999)
- (19) P. J. Groot: this volume
- (20) E. T. Harlaftis, D. Steeghs, K. Horne, E. Martín, A. Magazzú: Mon. Not. R. Ast. Soc. 306, 348 (1999)
- (21) K. Horne: Mon. Not. R. Ast. Soc. 213, 129 (1985)
- (22) K. Horne, T. R. Marsh: In: The Physics of Accretion onto Compact Objects, eds. K. Mason, P. Charles (Springer-Verlag, Berlin, 1986), p. 1
- (23) K. Horne: In: Accretion Disks in Compact Stellar Systems, ed. J. C. Wheeler (World Scientific Publ. Co., Singapore, 1993), p. 117
- (24) K. Horne, M. C. Cook: Mon. Not. R. Ast. Soc. 214, 307 (1985)
- (25) K. Horne, T. R. Marsh, F.-H. Cheng, I. Hubeny, T. Lanz: Astrophys. J. 426, 294 (1994)
- (26) K. Horne, R. F. Stiening: Mon. Not. R. Ast. Soc. 216, 933 (1985)
- (27) C. Knigge, K. S. Long, D. W. Hoard, P. Szkody, V. S. Dhillon: Astrophys. J. 539, L49 (2000)
- (28) C. Knigge, K. S. Long, W. P. Blair, R. A. Wade: Astrophys. J. 476, 291 (1997)
- (29) J. Kube, B. T. Gänsicke, K. Beuermann: Astron. & Astrophys. 356, 490 (2000)
- (30) M. Makita: this volume
- (31) T. R. Marsh: this volume
- (32) T. R. Marsh, K. Horne: Mon. Not. R. Ast. Soc. 235, 269 (1988)
- (33) K. Menou, J.-M. Hameury, R. Stehle: Mon. Not. R. Ast. Soc. 305, 79 (1999)
- (34) C. La Dous: Astron. & Astrophys. 211, 131 (1989)
- (35) F. Meyer, E. Meyer-Hofmeister: Astron. & Astrophys. 106, 34 (1982)
- (36) D. O’Donoghue: Mon. Not. R. Ast. Soc. 246, 29 (1990)
- (37) B. Paczyński, R. Sienkiewicz: Astrophys. J. 248, 27 (1981)
- (38) J. Patterson: Astrophys. J. Suppl. 54, 443 (1984)
- (39) J. E. Pringle, F. Verbunt, R. A. Wade: Mon. Not. R. Ast. Soc. 221, 169 (1986)
- (40) E. L. Robinson, et al.: Astrophys. J. 443, 295 (1995)
- (41) E. L. Robinson, J. E. Wood, R. A. Wade: Astrophys. J. 514, 952 (1999)
- (42) D. Rolfe, C. A. Haswell, J. Patterson: Mon. Not. R. Ast. Soc., in press (2000)
- (43) R. G. M. Rutten: Astron. & Astrophys. Suppl. 127, 581 (1998)
- (44) R. G. M. Rutten, V. S. Dhillon, K. Horne, E. Kuulkers, J. van Paradijs: Nature 362, 518 (1993)
- (45) R. G. M. Rutten, V. S. Dhillon, K. Horne, E. Kuulkers: Astron. & Astrophys. 283, 441 (1994)
- (46) R. G. M. Rutten, E. Kuulkers, N. Vogt, J. van Paradijs: Astron. & Astrophys. 254, 159 (1992)
- (47) R. G. M. Rutten, J. van Paradijs, J. Tinbergen: Astron. & Astrophys. 260, 213 (1992)
- (48) J. Skilling, R. K. Bryan: Mon. Not. R. Ast. Soc. 211, 111 (1984)
- (49) J. Skilling: In: Maximum Entropy and Bayesian Methods in Applied Statistics, ed. J. H. Justice (Cambridge University Press, Cambridge 1987) pp. 156
- (50) J. Smak: Acta Astr. 42, 323 (1992)
- (51) H. C. Spruit: Astron. & Astrophys. 289, 441 (1994)
- (52) D. Steeghs: this volume
- (53) D. Steeghs, E. T. Harlaftis, K. Horne: Mon. Not. R. Ast. Soc. 290, L28 (1997)
- (54) S. Vrielmann: this volume
- (55) N. Vogt: Astrophys. J. 252, 653 (1981)
- (56) R. A. Wade: Mon. Not. R. Ast. Soc. 208, 381 (1984)
- (57) B. Warner: Cataclysmic Variable Stars (Cambridge University Press, Cambridge, 1995)
- (58) B. Warner, D. O’Donoghue: Mon. Not. R. Ast. Soc. 233, 705 (1988)
- (59) R. Whitehurst: Mon. Not. R. Ast. Soc., 213, 129 (1988)
- (60) J. H. Wood: In Interacting Binary Stars, ASP Conference Series, Vol. 56, ed. A. W. Shafter (ASP, USA, 1994), p. 48
- (61) J. E. Wood, T. M. C. Abbott, A. W. Shafter: Astrophys. J. 393, 729 (1992)
- (62) J. H. Wood, K. Horne, G. Berriman, R. A. Wade, D. O’Donoghue, B. Warner: Mon. Not. R. Ast. Soc. 219, 629 (1986)
- (63) J. H. Wood, K. Horne, G. Berriman, R. A. Wade: Astrophys. J. 341, 974 (1989)
- (64) J. E. Wood, K. Horne, S. Vennes: Astrophys. J. 385, 294 (1992)