NUMERICAL STUDY OF THE COSMIC SHEAR
We study cosmic shear statistics using the ray-tracing simulation combined with a set of large -body simulations. In this contribution, we first describe our method. Then we show some selected results especially focusing on effects of the deflection of light rays and the lens-lens coupling which are neglected in making the theoretical predictions of the cosmic shear statistics.
1 Introduction
The cosmic shear statistics have been known as a powerful tool for probing the large-scale structure formation as well as for placing a constraint on values of the cosmological model . Recently, four independent groups have reported detections of cosmic shear variance . Although those detections were made with relatively small fields which limit their accuracy, on going wide field cosmic shear surveys will provide a precious measurement of not only the cosmic shear variance but also higher order statistics such like the skewness of the lensing convergence.
Since the pioneering work by Gunn , there has been a great progress in the theoretical study of the cosmic shear statistics . The analytical formulae for making the theoretical prediction of the cosmic shear statistics are based on the perturbation theory of the cosmic density field combined with the nonlinear clustering ansatz. The accuracy and limitations of the theoretical predictions should be tested against numerical simulations that is one purpose of numerical studies .
In this contribution, we summarize, briefly, the methods and selected results of our research project on the numerical study of the cosmic shear, details are presented in . The project aims (1) to test the analytical predictions against the numerical simulation, (2) to examine the higher order statistics of the cosmic shear, (3) to simulate a cosmic shear observation to examine possible systematic effects caused by, e.g., the source clustering .
2 Models and methods
| SCDM | 1.0 | 0.0 | 0.6 | 0.5 |
|---|---|---|---|---|
| OCDM | 0.3 | 0.0 | 0.85 | 0.7 |
| CDM | 0.3 | 0.7 | 0.9 | 0.7 |
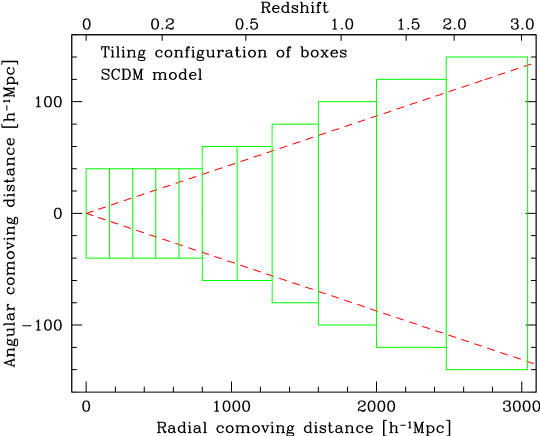
We consider three cluster normalized cold dark matter (CDM) models, parameters in the models are summarized in Table 1. -body simulations were performed with a vectorized particle-mesh code. They use particles and the same number of force mesh in a periodic rectangular comoving box and use light-cone output . In order to generate the density field from to , we performed 11, 12 and 13 independent simulations for SCDM, OCDM and CDM model, respectively. We adopted the tiling configuration of the boxes , i.e., the box size of each realization is chosen so that we have a field of view of square degrees (see Figure 1).
Light ray trajectories are followed through the density field generated by -body simulations adopting the multiple-lens plane algorithm . The lens planes are located at intervals of . The initial ray directions are set on grids with the grid spacing of arcmin. For each ray, positions of the ray on each lens plane are computed, and then the lensing magnification matrix, , is computed at the ray position on each plane. The lensing convergence, shear and net rotation are expressed by , , , and , respectively. We performed 40 realizations for each model changing the underlying density field (i.e., making random shifts of boxes to and directions (perpendicular to the line-of-sight) using the periodic boundary condition in -body simulations).
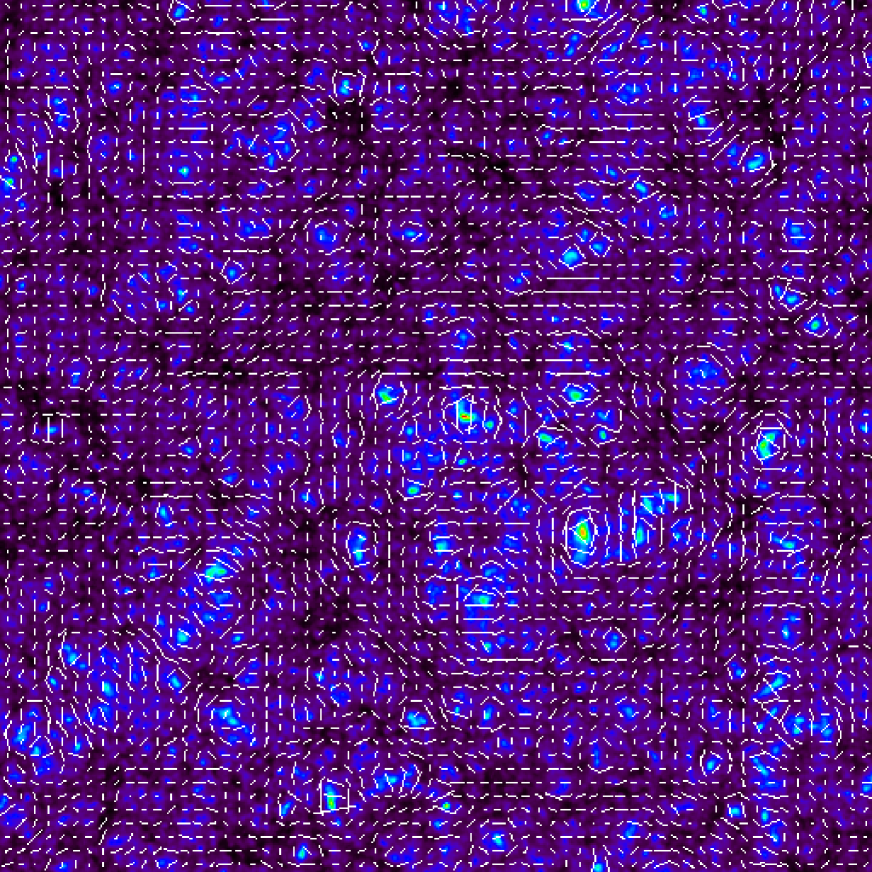
Figure 2 shows the lensing shear map overlaid on the convergence map for CDM model, the sources are assumed to be at a single redshift of . The filed is 5-degree on a side and contains line-of-sights. The angular resolution is limited by the spatial resolution of -body simulation. We found that the effective resolution is about 2 arcmin for the source redshift of and is slightly better (worse) for the higher (lower) redshift.
3 Results and discussion
Figure 4 shows the root-mean-square of the top-hat filtered lensing convergence measured from the ray-tracing simulations compared with the nonlinear prediction . The dumping on smaller scales comes from the fact that the lack of the power on scales smaller than the resolution in -body simulation, while that on larger scales reflects the finite field effect, i.e., a lack of powers on scales larger than -body simulation box. One may find very good agreement between the measurements and the nonlinear predictions.
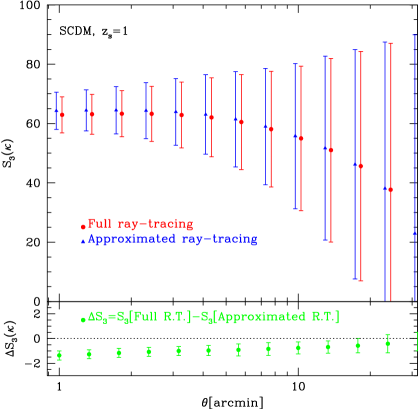
The skewness parameter defined by is known as a powerful probe of density parameter, , though, it is difficult to make a precious prediction of its value because a description of the nonlinear evolution of the density bispectrum is required. The upper panel of Figure 4 shows measured from the results of ray-tracing simulations compared with the prediction based on the quasi-linear theory of density perturbation. It is clearly shown in Figure 4 that the nonlinearity of the evolution of density field is very important even at the scale arcmin .
In addition to the usual full ray-tracing simulations, we performed approximated ray-tracing simulations to examine the effects of the deflections of the light rays and the lens-lens coupling which are neglected in making the theoretical predictions. The procedure of the approximated ray-tracing simulations is same as that of full ray-tracing except for artificial by-passing of both the deflection of light rays and all lens-lens couplings.
It is found that the difference in the variance of the lensing convergence (and of shear) between measured from full and approximated ray-tracing is very small, . Therefore the the deflections of the light rays and the lens-lens coupling can be neglected safely for making the theoretical predictions of the variance. For the convergence skewness, we found that the difference is not significant, for three cosmological models. These numerical results are compared with the theoretical predictions and a good agreement is found .

Acknowledgments
We would like to thank L. van Waerbeke, F. Bernardeau and A. Thion for useful discussions. This research was supported in part by the Direction de la Recherche du Ministère Français de la Recherche. The computational means (CRAY-98) to do the -body simulations were made available to us thanks to the scientific council of the Institut du Développement et des Ressources en Informatique Scientifique (IDRIS) Numerical computation in this work was partly carried out at the the TERAPIX data center. TH would like to thank Moriond organization for financial supports.
References
References
- [1] Y. Mellier, ARAA, 37, 127 (2000).
- [2] L. van Waerbeke et al., A&A, 358, 30 (2000).
- [3] D. Bacon, A. Refregier and R. Ellis, MNRAS submitted (astro-ph/0003008), (2000).
- [4] D. N. Wittman et al., Nature, 405, 143 (2000).
- [5] N. Kaiser, G. Wilson and G. A. Luppino, ApJ submitted (astro-ph/0003338), (2000).
- [6] J. E. Gunn, ApJ, 150, 737 (1967).
- [7] M. Bartelmann and P. Schneider, submitted to Physics Report (astro-ph/9912508), (2000)
- [8] B. Jain, U. Seljak and S. White, ApJ, 530, 547 (2000).
- [9] M. White and W. Hu, ApJ, 537, 1 (2000).
- [10] T. Hamana, S. Colombi and Y. Mellier, in preparation, (2000).
- [11] L. van Waerbeke, T. Hamana, R. Scoccimarro, S. Colombi and F. Bernardeau, MNRAS submitted (2000).
- [12] F. Bernardeau, A&A, 338, 375 (1998)
- [13] T. Hamana, et al, in preparation,
- [14] T. Hamana, S. Colombi and Y. Suto, A&A submitted (2000).
- [15] P. Schneider, J. Ehlers, & C. C. Falco, Gravitational Lenses (Springer, Berlin, 1992).
- [16] F. Bernardeau, L. van Waerbeke and Y. Mellier, A&A, 323, 1 (1997).
- [17] B. Jain and U. Seljak, ApJ, 484, 560 (1997).