Diffraction-limited bispectrum speckle interferometry and speckle polarimetry of the young bipolar outflow source S140 IRS1
Abstract
We present bispectrum speckle interferometry and speckle polarimetry of the deeply embedded infrared bipolar outflow source S140 IRS1, a massive protostellar object in the L1204 molecular cloud. Using the SAO 6 m telescope, we obtained 280 mas resolution polarization maps of S140 IRS1 as well as a K-band image with diffraction-limited resolution /D of 76 mas, which is the highest angular resolution image of a young outflow source ever obtained in the infrared. Our data suggest that the central source is marginally resolved with a FWHM diameter of approximately 20 mas ( AU). The most remarkable feature in our image is a bright extended and very clumpy structure pointing away from the central source in exactly the same direction as the blue-shifted CO outflow lobe. A centro-symmetric pattern of high polarization in this feature suggests that we see scattered light from the central source. We interprete this feature as the clumpy inner surface of a partially evacuated cavity in the circumstellar envelope around IRS1, which has been excavated by the strong outflow from IRS1.
Key Words.:
techniques: interferometric; stars: individual: S140 IRS1; stars: formation; stars: outflows1 Introduction
The formation process of massive stars is still not well understood (cf. Garay & Lizano 1999 for a recent review). The evolutionary timescales for massive stars are very short, as they start to burn hydrogen while still accreting material from the surrounding protostellar cloud. Young massive stars also affect their environment strongly by driving very powerful winds, molecular outflows, and jets, and also by emitting intense UV radiation. An especially interesting aspect of massive star formation is the observational result that many massive protostars drive very energetic outflows that are often more massive than the central protostar (cf. Churchwell 1997). To reach a better understanding of the physics of massive star formation, observations with high spatial resolution are crucial in order to disentangle the numerous different physical processes taking place simultaneously. This is the motivation for our high-resolution study of the massive protostellar object S140 IRS1, well known for driving a massive bipolar molecular outflow.
S140 is an HII region at the south-east edge of the L1204 dark cloud and part of a cloud complex located at the edge of a prominent infrared emission ring, known as the Cepheus ring. This ring is probably the result of a supernova explosion and stellar winds from massive stars in the open cluster NGC 7160, close to the center of the ring (cf. Kun et al. 1987.)
About north-east of the S140 HII region, Rouan et al. (1977) detected strong far-infrared emission at a position at which no objects could be seen in visible light. Harvey et al. (1978) found that the spectral energy distribution of this infrared source, called S140 IRS, strongly increases between 2 m and 100 m and estimated an infrared luminosity of (for a presumed distance of 1 kpc). Beichman et al. (1979) carried out 20 m observations of this region and were able to resolve the infrared emission into three individual sources. At 20 m, the dominant source IRS1 is 7 – 10 times brighter than the two other sources IRS2 and IRS3. The luminosity of IRS1 was estimated to be (Lester et al. 1986), suggesting it to be a deeply embedded ( mag; Harker et al. 1997) early B-type star with a mass of about . However, these estimates of the stellar parameters appear to be quite uncertain. A determination of the extinction towards IRS1 based on 3 m ice-band spectroscopy by Brooke et al. (1996) yielded a column density of corresponding to an extinction of mag. This would suggest a somewhat higher luminosity and thus also a higher mass for IRS1.
A strong molecular CO outflow in the S140 IRS region was first detected by Blair et al. (1978). The total outflow mass was estimated to be (Bally & Lada 1983), i.e. about 6 times more than the mass of the central protostar. Minchin et al. (1993) studied the CO molecular line emission in the S140 region with the JCMT and found a bipolar outflow morphology. S140 IRS1 lies just in the middle between the blue- and red-shifted outflow lobes; since the other two infrared sources IRS2 and IRS3 are clearly not located on the outflow axis, IRS1 can reliably be assumed to be the source of this outflow. The position angle of the outflow axis is about . Since the blue- and red-shifted outflow lobes overlap strongly, the outflow axis is believed to be rather close to the line of sight.
In previous studies, near-infrared images of S140 were obtained for example by Harker et al. (1997) and Yao et al. (1998). Near-infrared polarization maps were reported by Lenzen (1987), Whitney et al. (1997), and Yao et al. (1998). These observations, however, were seeing-limited and therefore did not have the resolution required to study the inner environment ( AU) of the central source S140 IRS1. In order to get a better insight into the nature of this interesting object, we have carried out bispectrum speckle interferometry and speckle polarimetry of S140 IRS1.
2 Observations
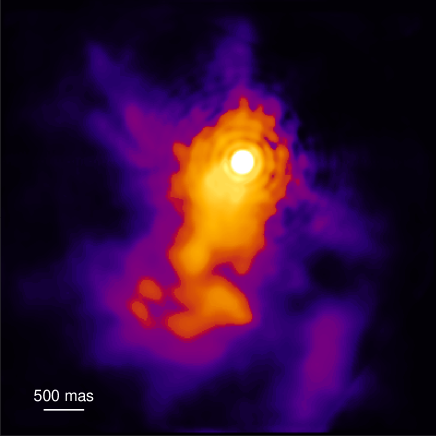
The speckle interferograms were obtained with the 6 m telescope at the Special Astrophysical Observatory (SAO) in Russia on 19 September 1999. The data were recorded through a -filter with a central wavelength of 2.165 m and a bandwidth of 0.328 m. 5552 speckle interferograms of S140 IRS1 and 5736 speckle interferograms of the reference stars HIP 110410 and HIP 110498 were taken with our Hawaii array speckle camera. The exposure time per frame was 150 ms, the pixel size was 27.0 mas and seeing was . The images were reconstructed using the bispectrum speckle interferometry method (Weigelt 1977; Lohmann et al. 1983; Weigelt et al. 1991). The object power spectrum was determined with the speckle interferometry method (Labeyrie 1970). The bispectrum of each frame consisted of 100 million elements. The resulting image (Fig. 1, upper right) has a diffraction-limited resolution of 76 mas. In order to increase the SNR we also reconstructed an image with a reduced resolution of 130 mas (60% of the diffraction limit), which is shown in Fig. 1, upper left.
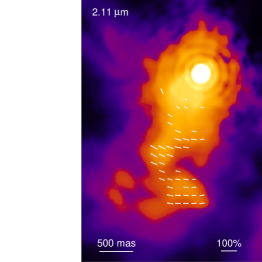
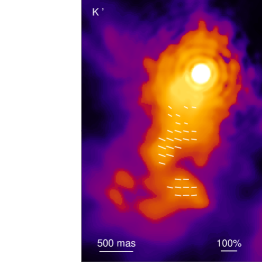
The speckle polarimetry observations were carried out on 13 June 1998 using the SAO 6 m telescope, our two-beam polarimeter, and a NICMOS 3 camera. The data recording parameters were as follows: 2800 polarized object speckle frames and 2800 reference star (HIP 109981) frames recorded through a m-filter with central wavelength / FWHM bandwidth of 2.110 m / 0.192 m, 2400 polarized object speckle frames and 2400 reference star (HIP 110498) frames recorded through a -filter with central wavelength/FWHM bandwidth of 2.165 m / 0.328 m, exposure time per frame 150 ms, pixel size 30.1 mas, field of view (256 256 pixels), and seeing . Our 2-beam speckle polarimeter has the following standard design: achromatic K-band collimator objective to obtain a parallel beam behind the f/4 primary focus of the SAO 6 m telescope, rotatable plate for rotating the polarization direction, Wollaston prism to obtain two polarized images separated by on the detector, and a second achromatic K-band objective behind the plate and Wollaston prism (more technical details of the speckle polarimeter will be described elsewhere). Polarized speckle interferograms were recorded at the four plate positions , , , and . For each of these four data sets and the corresponding reference star data sets, polarized images were reconstructed using the bispectrum speckle interferometry method. In each of the four reconstructed images two images of the object were obtained which were polarized parallel and perpendicular to the separation vector of the two images. From these polarized images polarization maps were reconstructed using the standard technique (see e.g. Whitney et al. 1997 and references therein). In order to improve the SNR of the images, the resolution was reduced to 280 mas. In Fig. 1 (lower left) polarization vectors are plotted at the positions where the SNR of the degree of polarization (derived by splitting the data sets) is better than 5 and the error of the polarization vectors is smaller than .
3 Results

upper right: Contour representation of the diffraction-limited 76 mas resolution -band image with annotation; the contour level intervals are 0.3 mag, down to 7.9 mag difference relative to the peak intensity. The thin line marks the direction of the symmetry axis of the extended structure with a position angle of ; the thick arrows mark the directions of the red- and blue-shifted CO outflows (position angle ).
lower left: Color representation of the central part of the -band image with overlaid polarization vectors (for details see Section 2) derived from the data (left) and the data (right). A vector appears in the lower right corner for reference. In all images north is up and east is to the left.
3.1 Morphology in the -band image
In Fig. 1 we present our reconstructed -band images of S140 IRS1. Our images show a wealth of previously unseen details. The central source IRS1 has a point-like appearance. A series of diffraction rings are clearly visible around IRS1. While the first ring is perfectly closed, the following diffraction rings are broken. A detailed investigation of the data indicates that the central source is marginally resolved with a FWHM Gaussian diameter of approximately 20 mas (corresponding to a physical size of AU at the assumed distance of 900 pc) and is probably elongated in a north-south direction.
Our images show a bright extended feature of diffuse emission pointing from IRS1 towards the south-east. This emission has a very clumpy structure with several prominent knots as indicated in our contour image. Clump A is located on the axis defined by the general shape of the emission structure. Three other clumps, denoted as B, C, and D, can be seen to the right or left of the axis. Additionally, a rather extended feature of emission, denoted as G, is seen south-east of IRS1. Nevertheless, the general shape of the diffuse emission follows a well defined direction. The line connecting the central maximum with clump A has a position angle of (measured counter-clock wise from north). The two features denoted as E and F seem to trace a structure that is oriented roughly perpendicular to the outflow direction.
3.2 Polarization maps
Our polarization maps show that the light from the elongated feature is strongly polarized, with degrees of polarization ranging up to 50%. Our two polarization maps, which were taken in slightly different filters (see above), agree very well. If we draw lines perpendicular to each polarization vector in our maps, nearly all these lines cross within less than of the central intensity peak. Thus, our maps are very consistent with a centro-symmetric polarization pattern around the central source. Comparison of our polarization maps with theoretical simulated polarization maps (e.g. Fischer et al. 1996) suggests that the light from the elongated feature is scattered light, originating from the central source.
4 Interpretation of the observed structures
The near-infrared emission is dominated by the central intensity peak, that contains of the total flux in our image. This peak probably marks the location of the central protostar S140 IRS1. An alternative explanation might be that the protostar is too deeply embedded to be directly visible in our image, and the intensity peak might be light from the protostar that is scattered at the walls of the outflow cavity. However, the observed polarization pattern which is centro-symmetric around the intensity peak strongly suggests that the location of the illuminating source actually is at the intensity peak of our image. The observed ratio of diffuse versus direct light together with typical optical properties of circumstellar dust (e.g. Preibisch et al. 1993) suggests an extinction of mag ( mag) along the line-of-sight to the protostar, i.e., the dominant intensity peak seems to be a highly extincted image of the central protostar. The possibly elongated structure of the central source might be caused by bright emission from the innermost part of the larger extended structure, or might indicate that the central object is a binary star.
The most striking feature in our image is the bright extended and very clumpy structure pointing from IRS1 to the south-east. Interestingly, the position angle of this structure of matches the direction of the blue-shifted CO outflow very well: the 12CO map of Minchin et al. (1993) gives a position angle of for the blue-shifted outflow lobe. This strongly suggests that the elongated feature in our image is related to the blue-shifted CO outflow. The axis of the CO outflow is known to be closer to the line-of-sight than to the plane of the sky (Minchin et al. 1993), i.e. the south-eastern lobe of the outflow is oriented roughly towards us, while the north-western lobe is pointing away from us. This suggests the following interpretation of the observed features:
The central object IRS1 is deeply embedded in a dense circumstellar envelope or perhaps a thick circumstellar disk. The outflow has cleared a cavity in the circumstellar material and what we see as the bright extended structure south-east of IRS1, is light from the central protostar that is scattered by dust grains at the inner wall of this outflow cavity into our direction. The very clumpy appearance of the emission suggests that the surface of the cavity wall is not smooth but highly structured. This might be the signature of the violent interaction between the outflowing material and the circumstellar envelope.
Our image traces the diffuse emission out to at least about away from the central source. This suggests that the size of the circumstellar envelope or disk around IRS1 is at least AU. The asymmetric general shape of our image, i.e. the fact that we do not see a counter lobe north-west of IRS1, is easily explained as a geometrical effect. The red-shifted outflow component, pointing in the north-west direction, has probably cleared a similar cavity. That cavity, however, is not visible in our near-infrared images because it is pointing away from us and the light predominantly escapes in a direction away from us.
5 Conclusions
Our high-resolution data provide new insight into the circumstellar environment of S140 IRS1 and enable us to study the structure of the envelope around the central protostar at scales of AU for the first time. Our images reveal bright emission that most probably is reflected light from the inner walls of a partially evacuated cavity in the circumstellar material around S140 IRS1. Due to the high spatial resolution of our data we even can see details in the structure of the cavity walls, which appear to have a highly inhomogeneous and clumpy surface. The fact that the orientation of the evacuated cavity perfectly agrees with the direction of the molecular outflow strongly suggests that this cavity has been carved out by the strong molecular outflow from S140 IRS1. This demonstrates the close relationship between the structure of the dense inner circumstellar material around the central protostar IRS1 at scales of a few hundred AU, and the large scale molecular outflow at scales of several 10 000 AU.
Acknowledgements.
We thank the referee for her helpful comments.References
- (1) Bally J., Lada C.J., 1983, ApJ 265,824
- (2) Beichman C.A., Becklin E.E., Wynn-Williams C.G., 1979, ApJ 232,L47
- (3) Blair G.N., Evans N.J. II, Vandenbout P.A., Petters W.L. III, 1978, ApJ 219,896
- (4) Brooke T.Y., Sellgren K., Smith R.G., 1996, ApJ 459,209
- (5) Churchwell E., 1997, ApJ 479,L59
- (6) Fischer O., Henning Th., Yorke H.W., 1996, A&A 308,863
- (7) Garay G., Lizano S., 1999, PASP 111,1049
- (8) Harker D., Bregman J., Tielens A.G.G.M., Temi P., Rank D., 1997, A&A 324,629
- (9) Harvey P.M., Campbell M.F., Hoffmann W.F., 1978, ApJ 219,891
- (10) Kun M., Balazs L.G., Toth I., 1987, ApSS 134,211
- (11) Labeyrie C.D., 1970, A&A 6, 85
- (12) Lenzen R., 1987, A&A 173,124
- (13) Lester D.F., Harvey P.M., Joy M., Ellis H.B.Jr., 1986, ApJ 309,80
- (14) Lohmann A.W., Weigelt G., Wirnitzer B., 1983, Appl. Opt. 22,4028
- (15) Minchin N.R., White G.J., Padman R., 1993, A&A 277,595
- (16) Preibisch Th., Ossenkopf V., Yorke H.W., Henning T., 1993, A&A 279,5 77
- (17) Rouan D., Lena P.J., Puget J.L., de Boer K.S., Wijnbergen J.J., 1977, ApJ 206,L35
- (18) Weigelt G., 1977, Opt Commun. 21,55
- (19) Weigelt G., 1991, in “Progress in Optics”, Vol. 29, ed. E. Wolf, Elsevier Science Publishers, p. 295
- (20) Whitney B.A., Kenyon S.J., Gomez M., 1997, ApJ 485,703
- (21) Yao Y., Ishi M., Nagata T., Ogawa Y., Sato S., Watanabe M., Yamashita T., 1998, ApJ 500,320