A nearly symmetric double-image gravitational lens 111 Based on observations using the Very Large Array (VLA) and Very Long Baseline Array (VLBA); the Multi-Element Radio Linked Interferometer Network (MERLIN); and the Blanco 4m telescope at the Cerro Tololo Inter-American Observatory (CTIO). The VLA and VLBA are operated by the National Radio Astronomy Observatory (NRAO), a facility of the National Science Foundation (NSF) operated under cooperative agreement by Associated Universities, Inc. MERLIN is a UK national facility operated by the University of Manchester on behalf of SERC. CTIO is operated by the Association of Universities for Research in Astronomy Inc., under a cooperative agreement with the NSF as part of the National Optical Astronomy Observatories.
Abstract
We report the discovery of a new double-image gravitational lens resulting from our search for lenses in the southern sky. Radio source PMN J2004–1349 is composed of two compact components separated by in VLA, MERLIN and VLBA images. The components have a flux ratio of 1:1 at radio frequencies ranging from 5 GHz to 22 GHz. The -band optical counterpart is also an equal double, with roughly the same separation and position angle as the radio double. Upon subtraction of the components from the -band image, we identify a dim pattern of residuals as the lens galaxy. While the present observations are sufficient to establish that PMN J2004–1349 is a gravitational lens, additional information will be necessary (such as the redshifts of the galaxy and quasar, and precise astrometry and photometry of the lens galaxy) before constructing detailed mass models.
1 Introduction
The new double-image gravitational lens presented in this paper was found during a systematic search for lenses in the southern sky. Among the reasons to search for new lenses are: to find objects well-suited for determining the Hubble constant via time-delay measurements (Refsdal, 1964; Myers, 1999; Schechter, 2000); to constrain the cosmological constant by measuring the incidence of multiple-image lensing (Turner, 1990; Fukugita et al., 1992; Kochanek, 1996; Falco et al., 1998); and to study the mass distributions (e.g., Keeton, Kochanek & Seljak 1997; Rusin & Ma 2000) and evolution (Keeton, Kochanek & Falco, 1998) of medium-redshift galaxies.
Our search methodology will be described in a future paper, but is briefly as follows. Our sample consists of southern radio sources () with flat radio spectra (, where ), as measured between the 4.85 GHz Parkes-MIT-NRAO catalog (Griffith & Wright, 1993) and the 1.4 GHz NRAO VLA Sky Survey (Condon et al., 1998, NVSS). This declination range is relatively unexplored for lenses and therefore likely to contain bright and useful specimens, and is far enough north to be within reach of the VLA and VLBA, instruments that facilitate the search.
We obtained a snapshot of each object at 8.46 GHz with the VLA in its A configuration. Objects exhibiting multiple compact components (about 5% of the sample) were selected as lens candidates and scheduled for appropriate follow-up radio and optical observations. The goal of the follow-up observations is to determine whether the components have comparable spectral properties and surface brightnesses (as lensed images should have) and to search for a lens galaxy.
This paper describes the second confirmed lens from our survey. The first was PMN J1838–3427, described by Winn et al. (2000a). Following the organization of that paper, we end this introduction with a short chronology of the discovery of PMN J2004–1349, then examine the evidence in detail in subsequent sections.
The initial VLA image of 1998 May 18 contained two compact components separated by . In the majority of such cases, higher-resolution radio imaging reveals one component to be flat-spectrum and compact, and the other to be steep-spectrum and extended: a core-jet structure. However, both components were unresolved in a MERLIN image obtained on 2000 April 1, which had 2.5 times the resolution of the VLA image. The components were also nearly unresolved in a VLBA image obtained on 2000 April 28, which had 100 times the resolution of the VLA image.
With two compact components in such close proximity, PMN J2004–1349 was established as either a binary quasar or gravitational lens.222Here and elsewhere in this paper, we refer to the radio components as “quasars” because they are compact radio sources with pointlike optical counterparts, although strictly speaking they are not spectroscopically verified quasars. The most conclusive way to distinguish between these possibilities is to search for optical evidence of a lens galaxy. Such evidence was found in optical images obtained on 2000 July 25 with the Blanco 4m telescope at CTIO.
Section 2 presents the radio properties of the system, and § 3 presents the optical properties. Within the latter section, § 3.1 presents the evidence for the lens galaxy, and § 3.2 provides photometry of PMN J2004–1349 and 5 nearby reference stars. In the last section we review the evidence that PMN J2004–1349 is a gravitational lens and use the observed properties to speculate on the nature of the lens galaxy and to estimate the order of magnitude of the time delay.
2 Radio images
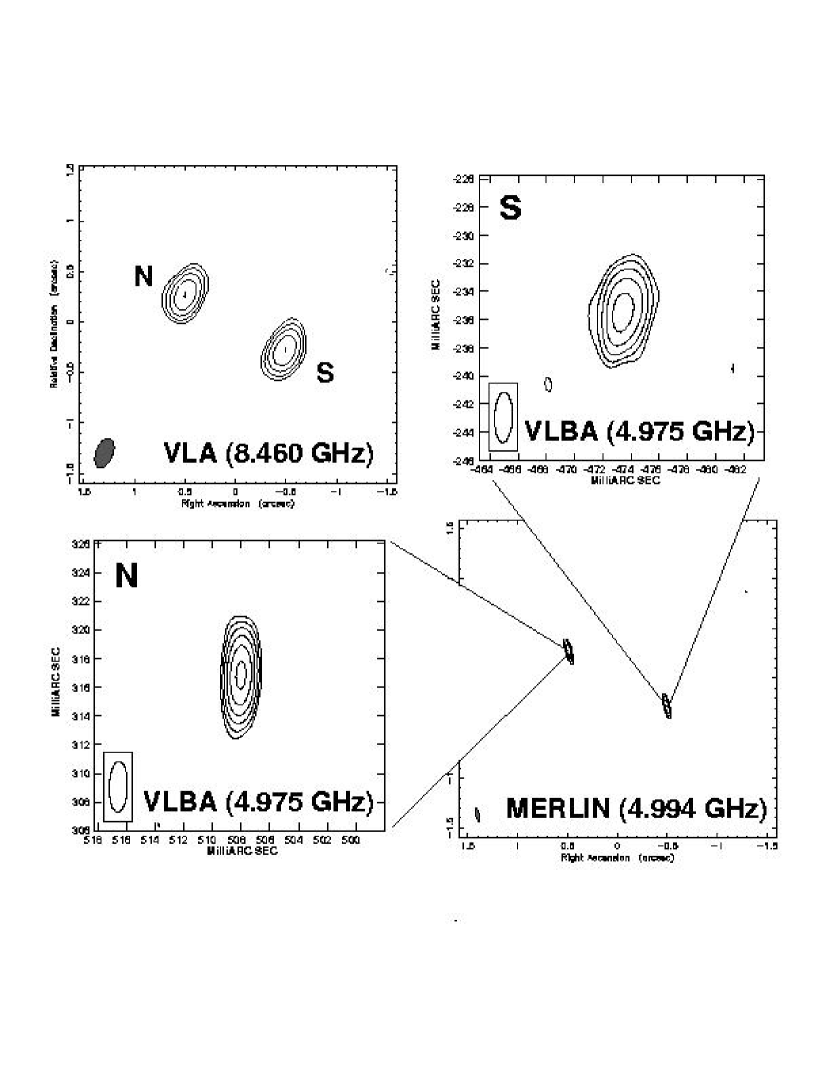
We present results from radio images obtained with the VLA, MERLIN and VLBA, at frequencies ranging from 5 GHz to 22.4 GHz. In all the images, there are two components with nearly equal fluxes, separated by at P.A. . We refer to the northeast component as NE and the southwest component as SW. Based on the average of our VLA measurements, the position of component NE is R.A. (J2000), Dec. (J2000) , within .
2.1 VLA images
We observed PMN J2004–1349 on 1998 May 18 for 35 seconds with the VLA at 8.46 GHz as part of the first phase of our lens search. Radio source 3C286 was used to set the absolute flux density scale, following the procedure suggested in the VLA Calibration Manual and adopting a flux density of 5.52 Jy.
On 2000 November 1 we obtained additional VLA observations at 14.94 GHz and 22.46 GHz. These observations employed fast-switching between the target and the phase calibration source J2011–157 (from the VLA Calibration Manual). The total dwell time on PMN J2004–1349 was 5 minutes at 14.94 GHz and 8.3 minutes at 22.46 GHz. To set the absolute flux density scale we observed J2355+498, a calibration source that is monitored monthly by S. Myers and G. Taylor of the NRAO and has proven to have a constant flux (within 5%) at these frequencies. The assumed flux densities of J2355+498 were 0.602 Jy at 14.94 GHz and 0.473 Jy at 22.46 GHz.
In all cases, the total observing bandwidth was 100 MHz. Calibration was performed with AIPS using standard procedures, and imaging was performed with Difmap (Shepherd et al., 1994). In all cases, two compact components were obvious in the image prior to any deconvolution. We fit a model consisting of two elliptical Gaussian components to the visibility function using the “modelfit” utility of Difmap. After repeated iterations of model-fitting and phase-only self-calibration, we created a uniformly-weighted image with an elliptical Gaussian restoring beam. The 8.46 GHz image is shown in Figure 1.
2.2 MERLIN image
On 2000 April 1 we observed PMN J2004–1349 with MERLIN, using all 6 telescopes of the array. The total observing bandwidth was 15 MHz centered at 4.994 GHz. To calibrate the antenna phases, we switched between the target and the nearby compact bright source J1939–1525 (from the VLBA Calibrator Survey) with a cycle time of 5 minutes. We divided the observation into four segments, separated in time by about an hour, in order to improve the -coverage. The total dwell time on PMN J2004–1349 was 59 minutes. Radio source 3C286 was used to set the absolute flux density scale, assuming a flux density of 7.38 Jy on the shortest baseline. Calibration was performed at Jodrell Bank using standard MERLIN software, and imaging was performed with Difmap.
Using the same procedure as was applied to the VLA data, we fit a two-component model to the visibility function. After repeated iterations of model fitting and phase-only self-calibration with a 5-minute solution interval, we arrived at our final image (Figure 1) and model (Table 1). The image is uniformly weighted and restored with an elliptical Gaussian beam. Both components were unresolved.
The gravitational deflection of light is achromatic in the regime of lensing by galaxies, so the magnification ratio of point components should be independent of frequency. The near-equality of flux density ratios from 5 GHz to 22 GHz is therefore evidence that the two components are gravitationally lensed images. It is unlikely that two unrelated radio sources, or even the members of a binary quasar, would have identical continuum radio spectra. Stronger evidence for lensing is presented in § 3.1.
We note that the flux density ratio measured at 8.5 GHz is not in formal agreement with the others, although it is within . This discrepancy is not a serious challenge to the gravitational lensing interpretation. The 8.5 GHz measurement was made 2 years earlier than the others. Variability of the background source causes the instantaneous flux density ratio to vary, because each lensed image displays the source at a different moment in its history.
2.3 VLBA image
We examined the system with all ten antennas of the VLBA on 2000 April 28. The phase center was approximately the midpoint between NE and SW. The observing bandwidth was 32 MHz centered at 4.975 GHz. This bandwidth was divided into 4 intermediate frequencies, each of which was subdivided into sixteen 0.5 MHz channels. To calibrate the antenna phases, delays, and fringe rates, we switched between PMN J2004–1349 and J1939–1525 with a cycle time of 5 minutes. The total dwell time on PMN J2004–1349 was 66 minutes.
Calibration, including fringe-fritting, was performed with standard AIPS procedures. We used a fringe-fit interval of 2 minutes on the phase reference source and applied interpolated solutions for delay and rate to PMN J2004–1349. Prior to imaging, we reduced the data volume by averaging in time into 6-second bins and in frequency into 1 MHz bins. This level of sampling was just enough to prevent significant bandwidth or time-average smearing over the required field of view.
For imaging, we employed the multiple-field implementation of the Clean algorithm in AIPS, with a field (with 20 mas pixels) centered on each component of PMN J2004–1349. The model constructed by the Clean algorithm was then used to self-calibrate the antenna phases with a solution interval of 2 minutes. This process, Cleaning and phase-only self-calibration, was iterated 10 times before arriving at the final model. The images based on this model, with uniform weighting and an elliptical Gaussian restoring beam, are displayed in Figure 1. The restoring beam is elongated in the north-south direction, with FWHM diameters mas.
Using the UVFIT task of AIPS, we fit a surface-brightness model consisting of two elliptical Gaussian components to the visibility data. To estimate of the uncertainty in each parameter, we observed the scatter in the results of separately fitting the model to individual 1 MHz spectral channels of data. The flux densities of the best-fit model components are listed in Table 1. Again, the flux density ratio is consistent with unity. The best-fit values of R.A. and Decl. are printed in the table caption. The models based on VLA and MERLIN data have separations that are consistent with these values, which are the most precise.
The widths of component NE converged to values smaller than half the width of the restoring beam. We conclude NE is unresolved. Component SW converged to mas at a position angle of , with a scatter of 0.5 mas in each width and in angle. Because the major axis is larger than the restoring beam, it appears that SW is resolved along one direction. These results are consistent with the visual appearance of the images in Figure 1.
If component SW is truly resolved, then it has a lower surface brightness than NE, which complicates the hypothesis that PMN J2004–1349 is a gravitational lens. Gravitational deflection conserves surface brightness. Lensed images are therefore expected to have the same surface brightness in the absence of complications, such as propagation effects that are different for each image path from source to observer.
The width of SW is not due to time-average or bandwidth smearing, which would in any case affect both components equally. Neither can the width be attributed solely to phase decorrelation, because the width does not vary significantly as the self-calibration solution interval is altered, and because phase decorrelation would also affect both components. We conclude that SW is indeed resolved. This conclusion is worth checking with further VLBI observations, because the width is comparable to the resolution of the present data, and the -coverage of this short observation was poor. This point is discussed further in § 4.1.
2.4 Total flux density
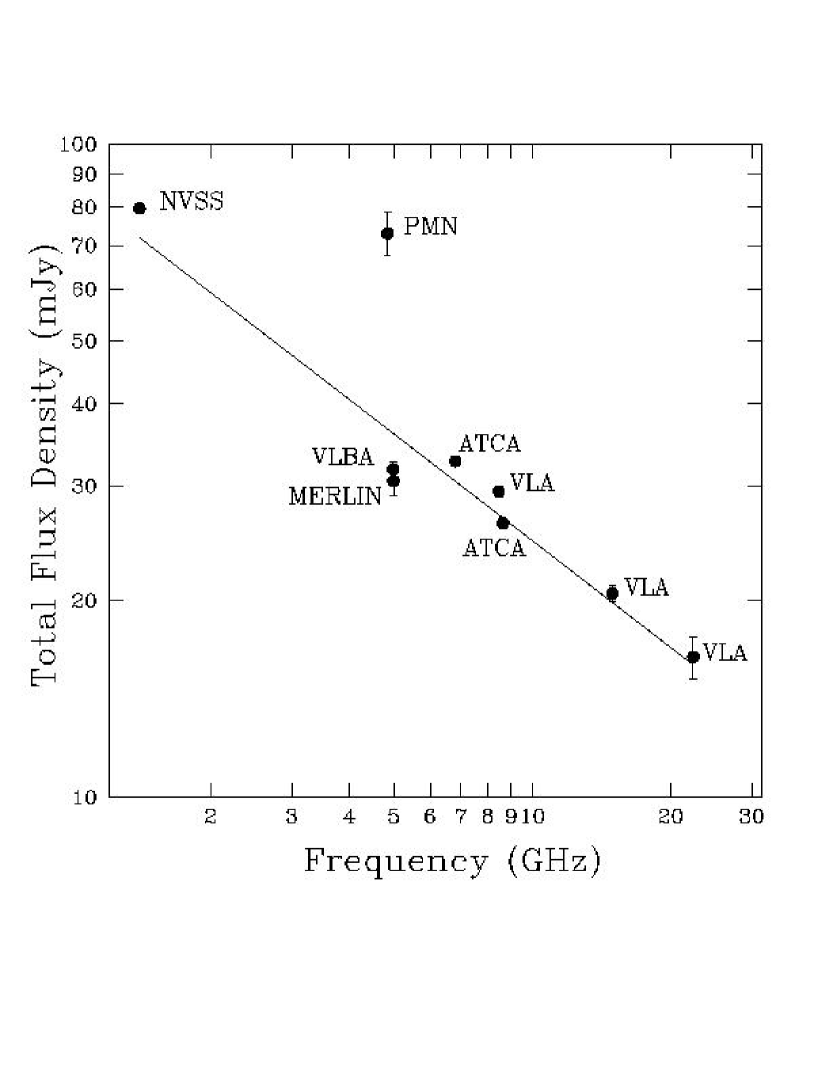
Assessing the variability of gravitational lenses is important because flux monitoring of variable systems offers potentially significant scientific rewards, including the Hubble constant (Refsdal, 1964; Myers, 1999; Schechter, 2000) and the characterization of compact masses in the lens galaxy (Koopmans & de Bruyn, 2000). Figure 2 is a logarithmic plot of the total flux density of PMN J2004–1349 as a function of radio frequency. It includes the entries from the PMN (Griffith et al., 1994) and NVSS (Condon et al., 1998) catalogs; the measurements with the VLA, VLBA and MERLIN described in this paper; and also two measurements with the Australia Telescope Compact Array (ATCA) that were taken on 2000 September 26 by J.E.J. Lovell (private communication).
With the exception of the PMN flux density, the spectrum is a power law with a best-fit spectral index of (where ). This is a typical value for radio-loud quasars. The large discrepancy between the PMN and the power law spectrum has two possible explanations. First, it could be the result of variability. The PMN flux is from 1990 whereas the others are from 2000. Second, the PMN flux is based on a single-dish measurement, whereas the others are interferometric. Emission that is smooth on scales larger than several arcseconds would be detected in the PMN survey but invisible to the interferometers.
Variability is the more likely explanation. There is independent evidence that PMN J2004–1349 is variable on a time scale of years, from the discrepancy between the VLA (1998) and ATCA (2000) flux densities at 8.5 GHz. There is no independent evidence for extended emission nor is such emission expected from typical radio quasars. The NVSS survey used a beam and might have been expected to detect this diffuse flux, but instead the NVSS flux lies along the same power-law line as the other interferometric measurements. There are no other sources in the NVSS catalog within of PMN J2004–1349.
3 Optical images
On 2000 July 25 we obtained optical images of PMN J2004–1349 with the Blanco 4m telescope at CTIO. We used the Mosaic II CCD, which has eight CCDs that are individually amplified and read out in pairs. We centered the target in chip #2. The night was photometric. Table § 2 reports the filter, exposure time, airmass, and seeing of each observation.
The images from chip #2 were extracted and corrected for cross-talk from the paired amplifier. These images were then bias-subtracted and flat-fielded with standard IRAF333 IRAF is distributed by the National Optical Astronomy Observatories, which are operated by the Association of Universities for Research in Astronomy, Inc., under cooperative agreement with the National Science Foundation. procedures. In addition, for each of the two -band images, sky fringes were removed by subtracting an appropriately-scaled fringe template for chip #2, which was kindly supplied by R.C. Dohm-Palmer. The two frames were then registered and added to create our final -band image. The next section describes the optical counterpart of PMN J2004–1349 and, in particular, evidence of a lens galaxy in the -band image. Section 3.2 provides photometry of PMN J2004–1349 and 5 nearby stars.
3.1 Evidence of a lens galaxy
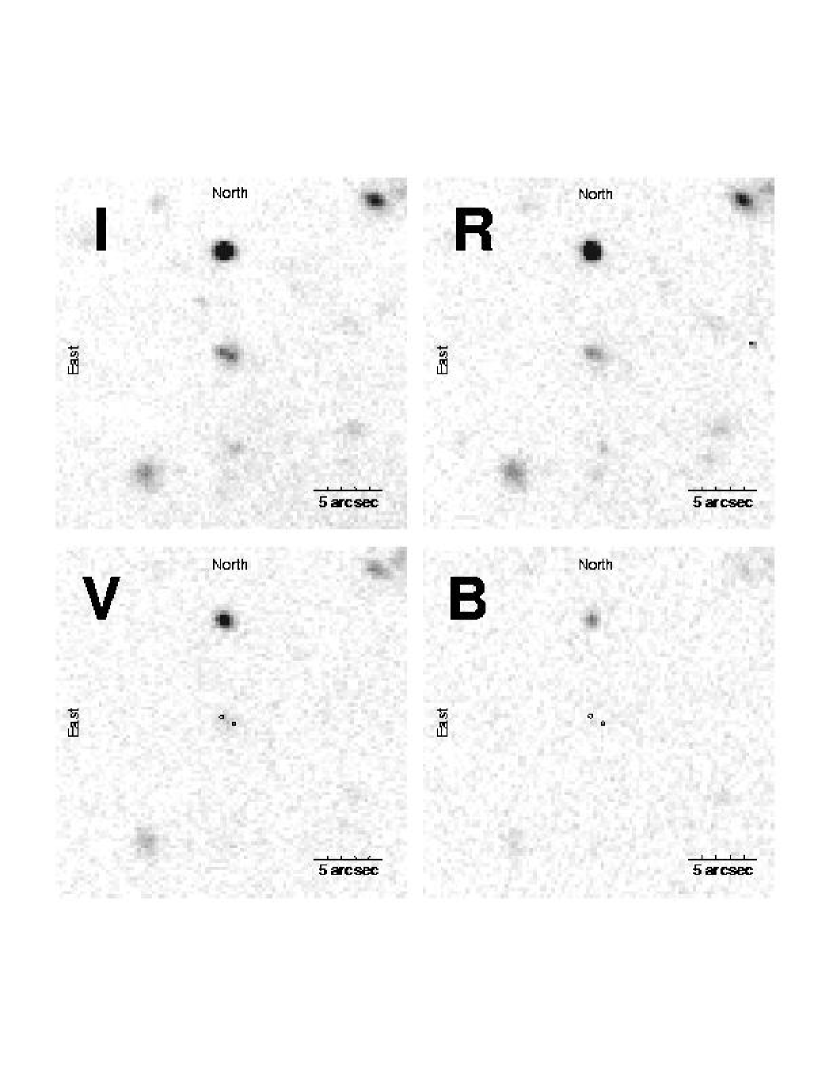
The four panels of Figure 3 display the optical counterpart as viewed through each of the four filters. In -band the quasars are easily distinguished, and it is apparent they have roughly the same separation, position angle and flux ratio as the radio double. In the object is not as obviously double, and is not as symmetrical. The -band counterpart is a single faint source lying between the expected quasar positions, which are marked with circles. In the counterpart is barely detected if at all.
Were PMN J2004–1349 a binary quasar, the optical counterpart would be double in all filters (with sufficient resolution and signal-to-noise ratio), and the separation would match the radio separation within the observational uncertainties. Our aim in this section is to demonstrate this is not the case. Rather, the actual morphology and its filter-dependence provides evidence of another light source between the quasars, which we believe is the lens galaxy.
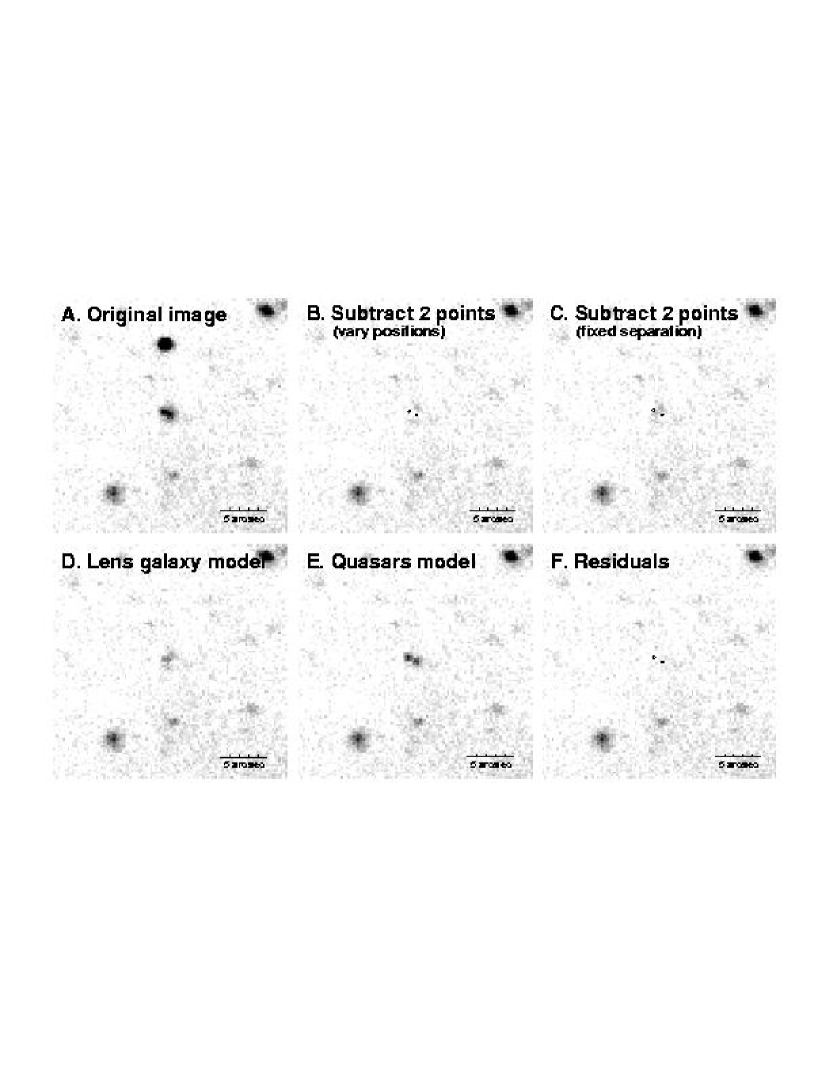
The most important evidence is in the -band image, which is reproduced at higher contrast in Panel A of Figure 4. With the DAOPHOT package in IRAF, we constructed an empirical PSF of radius , using the signal-weighted average of several bright and isolated field stars. We then fit a model consisting of two point sources to the optical counterpart of PMN J2004–1349. The best-fit separation was mas along a position angle of , and the NE/SW flux ratio was . Compared to the radio double ( mas, P.A. ) the optical double is along the same axis but is significantly smaller.
Panel B is the residual image after the 2-point model has been subtracted. The positions of the subtracted components are marked with small circles. There are significant (4) positive residuals just northwest and southeast of the axis of the double. A natural way to explain both the smaller optical separation and the pattern of residuals is that there is a diffuse source of unmodeled light centered between the quasars. The model components have been drawn together to account for this extra flux.
To ensure that the diffuse flux is not an artifact of imperfect PSF fitting, we created an artificial double with the same position angle and separation as the radio double, using the image of an isolated star in the -band image that is comparable in brightness to PMN J2004–1349. After applying the same PSF-fitting procedure as above, there was no trace of residual flux at the level seen in the actual data.
Next, convinced of the reality of the diffuse flux between the quasars, we fit a two-point model to the original image in which the relative separation between the points was fixed at the VLBA value. The NE/SW flux ratio converged to . Panel C of Figure 4 shows the residual image, in which the diffuse flux is seen to extend continuously across the axis joining the quasars. This diffuse flux is naturally interpreted as a lens galaxy.
Based on the and morphology, the galaxy appears to be bluer than the quasars. This explains why there is a light source between the expected quasar positions in the -band image, but the quasars themselves are not obvious. It may also explain why the -band components are not as clearly separate as in , despite a comparable resolution and signal-to-noise ratio. This point is discussed further in § 4.2.
3.2 Photometry of PMN J2004–1349 and field stars
To represent the galaxy, we added a third point (G1) to our model located exactly halfway between the quasars, and simultaneously solved for all three fluxes. There were still significant residuals to the north and south of G1, so we added two additional points (G2 and G3) located at the peak residuals. Our final photometric model therefore contained two points representing the quasars (NE and SW), and three points for the galaxy (G1–3). The relative separations were fixed at the values printed in Table 3, and the fluxes were allowed to vary simultaneously. Panel D of Figure 4 shows the -band image with the quasars subtracted, in order to display the lens galaxy model. In Panel E, the galaxy model has been subtracted, highlighting the quasars. Finally, Panel F shows the residual image after all five components have been subtracted. We applied the same 5-component model to the - and -band images.
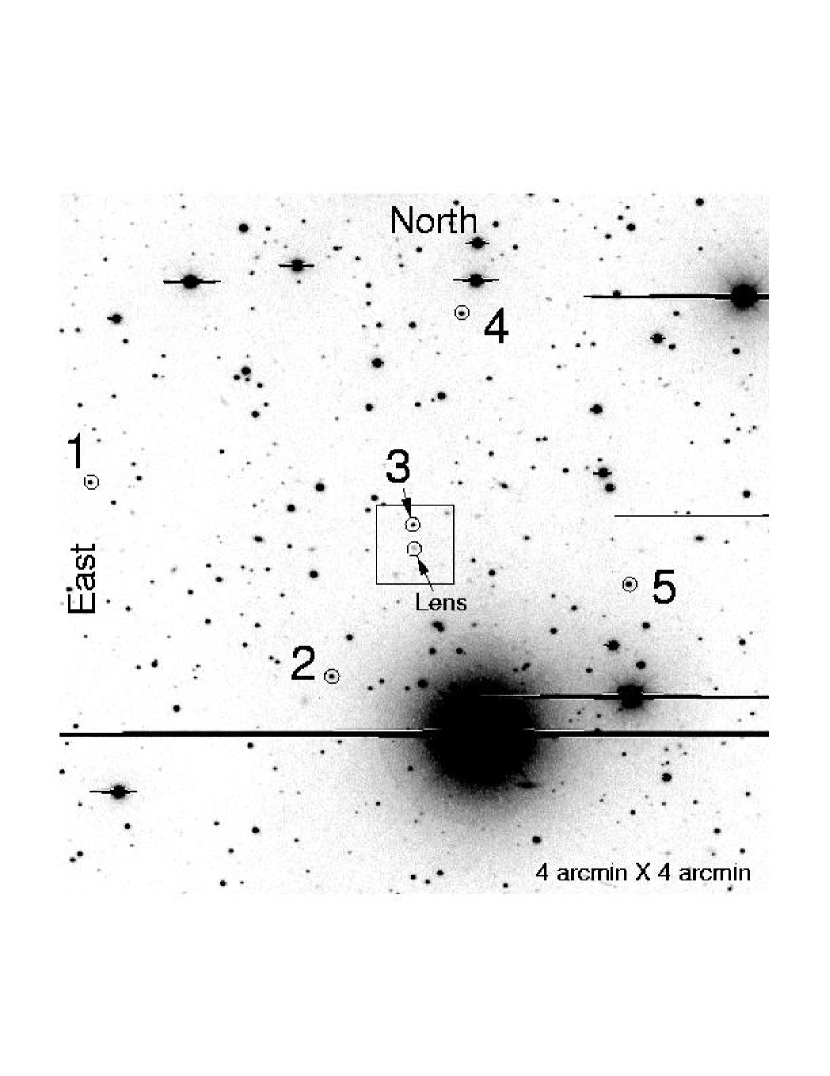
To establish a local photometric reference system for future observations, we used the same PSF template to find the instrumental magnitudes of 5 field stars. These stars are circled and labeled in Figure 5. For photometric calibration we observed the SA110 field described by Landolt (1992). Star #361 was used to determine the magnitude zero point, using an aperture diameter of . We adopted “typical” CTIO extinction coefficients of , , , and (Landolt, 1992).
The calibrated magnitudes of the reference stars and the components of PMN J2004–1349 are listed in Table 4. In , the flux of component SE converged to zero, so we report only a lower limit on the magnitude. The non-detection in implies for all components.
It is important to note that the quoted uncertainties are the statistical errors in the fitting procedure, and therefore apply only to magnitude differences. The calibration introduces an overall error of 0.05 magnitudes that affects all entries identically. Furthermore, the quoted uncertainties for the components of PMN J2004–1349 may be underestimated because they are internal to our choice of photometric model. Because all the components lie within two seeing discs, the magnitudes are covariant.
4 Discussion
4.1 Summary of evidence for lensing
We now summarize the argument that PMN J2004–1349 is a gravitational lens. It consists of two radio components, each of which is compact on milliarcsecond scales and has a pointlike optical counterpart. This implies PMN J2004–1349 is a pair of radio-loud quasars, and invites three possible interpretations: a chance alignment of unrelated quasars, a binary quasar, or a pair of lensed images of a single quasar.
The small separation () argues against the chance alignment and binary quasar hypotheses. Using the analysis of faint 5 GHz radio source counts by Langston et al. (1990), the probability of such a close alignment of two unrelated sources brighter than 15 mJy is less than . The chance of finding such a pair among our initial sample of radio sources is therefore less than . Furthermore, the small separation is more typical of lensed quasars () than binary quasars (; see e.g. Kochanek et al. (1999); Mortlock, Webster & Francis (1999)).
The observation that the quasars have nearly the same flux ratio ( 1:1) at 5 GHz, 8.5 GHz, 15 GHz and 22 GHz would require a coincidence under the chance alignment and binary quasar hypotheses, but is a natural consequence of the lensing hypothesis. The strongest evidence for lensing is the presence of a diffuse source of light in the -band image centered between the quasar positions, which is naturally interpreted as a lens galaxy.
We believe this argument is conclusive. However, the lensing hypothesis is complicated by the observation that the quasars have different angular sizes in our VLBA images (§ 2.3). Because gravitational lensing conserves surface brightness, a pair of lensed images with equal flux should have equal angular sizes. Our data suggest that the SW quasar is resolved along one direction and the NE quasar is unresolved. If this observation withstands further scrutiny, there must be a propagation phenomenon that causes the surface brightnesses of the lensed images to differ. One possibility is differential scatter-broadening of the components by plasma in the lens galaxy or our own Galaxy. This hypothesis can be tested by determining whether the angular size varies characteristically as the square of the observing wavelength. One might also determine whether the percentage polarization or amount of Faraday rotation of the components are different, which would be independent evidence of different electron column densities.
4.2 Nature of the lens galaxy
The photometry described in § 3.2 was used to estimate the magnitudes of the lens galaxy (see Table 4). As described in that section, the quoted uncertainties are probably underestimates, because the galaxy is a low-surface-brightness object located between two quasars that are separated by only one seeing disc. It is even possible that what we have called the “lens galaxy” is more than one galaxy. Despite these caveats, our estimates can be used to speculate on the nature of the lens galaxy, pending higher-resolution observations with adaptive optics or the Hubble Space Telescope. As a first step, we correct for Galactic extinction using the values of Schlegel et al. (1998), obtaining , and (within mag).
Are these magnitudes consistent with the magnitude of a galaxy sufficiently massive to produce the observed image separation? The image separation produced by a lens galaxy with velocity dispersion is roughly
| (1) |
The separation of observed in PMN J2004–1349 therefore indicates a galaxy that is not much less massive than a typical galaxy. The magnitudes and colors of typical spiral and elliptical galaxies, over a range of redshifts, have been computed by Lehár et al. (2000) using several standard models for galaxy evolution. According to these calculations, an -band magnitude of 21.5 implies a redshift between 0.5 and 1 (see Fig. 3 of Lehár et al. 2000). This is the range that is typical of lens galaxies, so the magnitude of the diffuse flux is certainly consistent with the lensing hypothesis.
Furthermore, Lehar et al. (2000) show that for a given -band magnitude, the color is sometimes a useful diagnostic of galaxy morphology. In particular, for the redshift range , early-type galaxies tend to be redder () than late-type galaxies (). In this sense our lens galaxy photometry () favors a late-type galaxy. This statement depends upon the chosen model for the timing of star formation, and might be false for an early-type galaxies with a very late starburst. In addition, the conclusion may be sensitive to our choice of photometric model for the lens galaxy. Nevertheless, our working hypothesis is that the lens galaxy is a spiral galaxy with a redshift between 0.5 and 1.
4.3 Magnification ratio and time delay
In order to use a lensed quasar to determine the Hubble constant, one must not only measure the time delay between the flux variations of the lensed images, but also construct a model of the gravitational potential of the lens galaxy that can be used to predict the quantity . The present observations do not allow for detailed mass modeling. Deeper and higher-resolution images, especially with adaptive optics or the Hubble Space Telescope, will be necessary for precise photometry and astrometry of the lens galaxy. Optical spectroscopy will also be essential, in order to obtain the redshifts of the background source and the lens. Despite the faintness of the quasars and the lens galaxy, low-resolution spectroscopy should not be a problem for an 8m-class telescope. In the meantime we can use the few observed properties of PMN J2004–1349 to predict the order of magnitude of the time delay.
The simplest plausible model for a lens galaxy is a singular isothermal sphere, for which the time delay is
| (2) |
where is the image separation; is the magnification ratio; is the lens redshift; and , and are the angular-diameter distances to the lens, to the source, and between the lens and source, respectively. This expression can be easily derived from more general expressions (e.g., Witt, Mao & Keeton 2000).
We further assume that the radio flux ratio, , is a good approximation of the magnification ratio , even though the flux ratio at any instant may depart from due to variability in the background source, microlensing or interstellar scattering. A distinguishing feature of PMN J2004–1349 is that , which means we may only place an upper limit on the time delay. Judging from the values in Table 1, it seems likely that is within 5% of unity. For and (the largest value consistent with the estimate in § 4.2), this implies days. Smaller values of produce smaller time delays.
Such a short time delay would be challenging to measure, because it would require frequent sampling, and because it is poorly matched to the typical variability time scale of quasars (months). In any case, it may still be valuable to monitor this system to investigate microlensing within the lens galaxy, as has been done at both optical wavelengths (e.g. QSO 2237+0305; Irwin et al. 1989) and radio wavelengths (B1600+434; Koopmans & de Bruyn 2000). Here a small time delay is an advantage, because there is no need to wait a long time to obtain a light curve of the lagging image to compare with that of the leading image.
As a final remark, we note that technically a singular isothermal sphere cannot produce a magnification ratio of unity. The symmetrical position, in which the lens is exactly aligned with the source, produces an Einstein ring. Small misalignments produce nearly equal doubles with high overall magnifications. If the magnification is indeed high, one might expect more sensitive radio images to reveal jets emerging from the quasar cores that form arcs or even an Einstein ring. These features would provide valuable constraints on lens models.
Real galaxies have elongated potentials, which can also produce nearly equal doubles. The highly elongated potential of an edge-on spiral, in particular, tends to produce magnification ratios that are close to unity (Maller, Flores & Primack, 1997). This would be consistent with our suspicion based on color (see § 4.2) that the lens galaxy is a spiral galaxy. In that case, lens modeling could provide interesting constraints on spiral galaxy structure, as it has for the edge-on spiral lens galaxy in B1600+434 (Koopmans, de Bruyn & Jackson, 1998).
References
- Condon et al. (1998) Condon, J.J., Cotton, W.D., Greisen, E.W., Yin, Q.F., Perley, R.A., Taylor, G.B. & Broderick, J.J. 1998, AJ, 115, 1693.
- Falco et al. (1998) Falco, E.E., Kochanek, C.S. & Muñoz, J.A. 1998, ApJ, 494, 47.
- Fukugita et al. (1992) Fukugita, M., Futamase, T., Kasai, M. & Turner, E.L. 1992, ApJ, 393, 3.
- Griffith et al. (1994) Griffith, M.R., Wright, A.E., Burke, B.F. & Ekers, R.D. 1994, ApJS, 90, 179.
- Griffith & Wright (1993) Griffith, M.R. & Wright, A.E. 1993, AJ, 105, 1666.
- Irwin et al. (1989) Irwin, M.J., Webster, R.L., Hewett, P.C., Corrigan, R.T. & Jedrzejewski, R.I. 1989, AJ, 98, 1989.
- Keeton, Kochanek & Falco (1998) Keeton, C.R., Kochanek, C.S. & Falco, E.E. 1998, ApJ, 509, 561.
- Keeton, Kochanek & Seljak (1997) Keeton, C.R., Kochanek, C.S. & Seljak, U. 1997, ApJ, 482, 604.
- Kochanek (1996) Kochanek, C.S. 1996, ApJ, 466, 638.
- Kochanek et al. (1999) Kochanek, C.S., Falco, E.E., Muñoz, J.A. 1999, ApJ, 510, 590.
- Koopmans, de Bruyn & Jackson (1998) Koopmans, L.V.E., de Bruyn, A.G. & Jackson, N. 1998, MNRAS, 295, 534.
- Koopmans & de Bruyn (2000) Koopmans, L.V.E. & de Bruyn, A.G. 2000, A&A, 358, 793.
- Landolt (1992) Landolt, A.U. 1992, AJ, 104, 340.
- Langston et al. (1990) Langston, G.I., Conner, S.R., Helfin, M.B., Lehár, J. & Burke, B.F. 1990, ApJ, 353, 34.
- Lehár et al. (2000) Lehár, J., Falco, E.E., Kochanek, C.S., McLeod, B.A., Muñoz, J.A., Impey, C.D., Rix, H.-W., Keeton, C.R. & Peng, C.Y. 2000, ApJ, 536, 584.
- Maller, Flores & Primack (1997) Maller, A.H., Flores, R.A. & Primack, J.R. 1997, ApJ, 486, 681.
- Mortlock, Webster & Francis (1999) Mortlock, D.J., Webster, R.L. & Francis, P.J. 1999, MNRAS, 309, 836.
- Myers et al. (1995) Myers, S.T., Fassnacht, C.D., Djorgovski, S.G., Blandford, R.D., Matthews, K., Neugebauer, G., Pearson, T.J., Readhead, A.C.S., Smith, J.D., Thompson, D.J., Womble, D.S., Browne, I.W.A., Wilkinson, P.N., Nair, S., Jackson, N., Snellen, I.A.G., Miley, G.K., de Bruyn, A.G., Schilizzi, R.T. 1995, ApJ, 447, L5.
- Myers (1999) Myers, S.T. 1999, Proc. Natl. Acad. Sci. USA, 96, 4236.
- Refsdal (1964) Refsdal, S. 1964, MNRAS, 128, 307.
- Rusin & Ma (2000) Rusin, D. & Ma, C.-P. 2000, submitted to ApJL, (astro-ph/0009079).
- Schechter (2000) Schechter, P.L. 2000, to appear in Lasenby, A., Wilkinson, A., eds., Proc. IAU Symp. 201, New Cosmological Data and the Values of the Fundamental Parameters, Astron. Soc. Pac., San Francisco (astro-ph/0009048).
- Schlegel et al. (1998) Schlegel, D.J., Finkbeiner, D.P. & Davis, M. 1998, ApJ, 500, 525.
- Shepherd et al. (1994) Shepherd, M.C., Pearson, T.J. and G.B. Taylor 1994, BAAS, 27, 903.
- Turner (1990) Turner, E.L. 1990, ApJ, 365, L43.
- Winn et al. (2000a) Winn, J.N., Hewitt, J.N., Schechter, P.L., Dressler, A.D., Falco, E.E., Impey, C.D., Kochanek, C.S., Lehar, J., Lovell, J.E.J., McLeod, B.A., Morgan, N.D., Munoz, J.A., Rix, H.-W. & Ruiz, M.T. 2000, AJ, to appear in December 2000 (astro-ph/0008036).
- Witt, Mao & Keeton (2000) Witt, H.J., Mao, S. & Keeton, C.R. 2000, submitted to ApJ (astro-ph/0004069).
| Date | Observatory | Frequency | Beam FWHM | Flux density | RMS noise | Abs. flux | Flux density | |
|---|---|---|---|---|---|---|---|---|
| (GHz) | (mas mas, P.A.) | N (mJy) | S (mJy) | (mJy/beam) | uncertainty | ratio | ||
| 1998 May 18 | VLA | 8.460 | () | 14.41 | 14.97 | 0.26 | 3% | |
| 2000 Apr 02 | MERLIN | 4.994 | () | 15.97 | 14.52 | 0.66 | 5% | |
| 2000 Apr 28 | VLBA | 4.975 | () | 16.37 | 15.39 | 0.22 | 5% | |
| 2000 Nov 01 | VLA | 14.94 | () | 10.47 | 10.06 | 0.44 | 5% | |
| 2000 Nov 01 | VLA | 24.46 | () | 8.34 | 8.07 | 0.39 | 10% | |
Note. — The most precise values for the separation between NE and SW come from the VLBA data: R.A. mas, Decl. mas. All of the other radio data are consistent with these values.
| Filter | Duration | Seeing | Airmass |
|---|---|---|---|
| (sec) | (arcsec) | ||
| 600 | 1.07 | 1.23 | |
| 600 | 1.15 | 1.20 | |
| 600 | 1.13 | 1.18 | |
| 600 | 1.00 | 1.17 | |
| 600 | 1.24 | 1.16 |
| Component | R.A. | Decl. |
|---|---|---|
| (mas) | (mas) | |
| NE | ||
| SW | ||
| G1 | ||
| G2 | ||
| G3 |
| Object | R.A. | Decl. | |||
|---|---|---|---|---|---|
| (arcsec) | (arcsec) | (mag) | (mag) | (mag) | |
| NE | 22.328( 92) | 23.639( 91) | 24.631(230) | ||
| SW | 22.339( 84) | 23.929(155) | |||
| Gal. | 21.891(125) | 23.113(175) | 23.830(197) | ||
| 1 | 19.289( 6) | 19.805( 6) | 20.432( 8) | ||
| 2 | 18.951( 5) | 19.738( 5) | 20.706( 7) | ||
| 3 | 19.912( 12) | 20.838( 9) | 21.901( 18) | ||
| 4 | 19.385( 7) | 20.994( 9) | 22.472( 25) | ||
| 5 | 18.179( 7) | 19.002( 4) | 19.985( 5) |
Note. — The parentheses contain the statistical error in millimagnitudes, which does not include the overall calibration error of 0.05 magnitudes. The galaxy magnitudes are based on the sum of the fluxes of G1, G2, and G3 in the model of Table 3. Based on radio data, the coordinates of NE are R.A. (J2000), Dec. (J2000) , within .