The effect of a cusped matter distribution on the formation of brightest cluster members
Abstract
We present N-body simulations of galaxy groups embedded in a common halo of matter. We study the influence of the different initial conditions upon the evolution of the group and show that denser configurations evolve faster, as expected. We then concentrate on the influence of the initial radial density profile of the common halo and of the galaxy distribution. We select two kinds of density distributions, a singular profile (modeled by a Hernquist distribution) and a profile with a flat core (modeled by a Plummer sphere). In all cases we witness the formation of a central massive object due to mergings of individual galaxies and to accretion of stripped material, but both its formation history and its properties depend heavily on the initial distribution. In Hernquist models the formation is due to a “burst” of mergings in the inner parts, due to the large initial concentration of galaxies in the center. The merging rate is much slower in the initial phases of the evolution of a Plummer distribution, where the contribution of accretion to the formation of the central object is much more important. The central objects formed within Plummer distributions have projected density profiles which are not in agreement with the radial profiles of observed brightest cluster members, unless the percentage of mass in the common halo is small. On the contrary the central object formed in initially cusped models has projected radial profiles in very good agreement with those of brightest cluster members, sometimes also showing luminosity excess over the law in the outer parts, as is observed in cD galaxies.
keywords:
galaxies: elliptical and lenticular, cD – dark matter – galaxies: interactions – galaxies: kinematics and dynamics – galaxies: structure1 Introduction
Brightest cluster members (BCMs) are giant ellipticals found in the central parts of clusters of galaxies. Some of these galaxies are further classified as cD galaxies because they show in their external parts a projected surface brightness excess over the standard law. Several models have been proposed for the origin of BCMs in general and of cDs in particular. A first class of models relies on the presence of cooling flows in clusters of galaxies. If the central cluster density is sufficiently high, intra-cluster gas can gradually condense and form stars at the bottom of the potential well (Cowie & Binney 1977; Fabian & Nulsen 1977). Such models, however, imply the formation of a lot of new stars, of which there is no good observational evidence. A second class of models relies on the dynamical mechanisms of merging, cannibalism and accretion (Ostriker and Tremaine 1975; Ostriker and Hausman 1977; Hausman and Ostriker 1978; McGlynn and Ostriker 1980 etc.). Schematically the central giant galaxy is formed by the merger of smaller galaxies and its growth continues by further mergings and cannibalism. It also accretes material stripped from the outer parts of the other galaxies, by interactions between galaxies, or between a galaxy and the common background. It has been proposed (Gallagher & Ostriker 1972; Richstone 1976) that such material could be responsible for the luminous envelope of cD galaxies. Merritt (1984) argued that most of the formation happens during cluster collapse.
Most of the mass of clusters or groups of galaxies is not bound to the galaxies that constitute them. Instead it is distributed in a common background encompassing the whole cluster and it includes the high temperature gas emitting X-rays and an unknown fraction of dark matter. This unknown mass distribution must have influenced the formation mechanism of BCMs. Nevertheless, considerable uncertainty still remains as to what fraction of the total cluster mass resides in the dark matter, and how it is distributed.
Observations of galaxy clusters can be used to constrain their mass distribution. The first attempts to obtain the profile of this mass distribution were based on galaxy counts and the projected velocity dispersion of the galaxy system. They rely on the assumption that the cluster has reached virial equilibrium and depend on what is assumed about the possible anisotropy of the system. They lead to mass distributions possessing central cores where the mass density is nearly constant (e.g. Kent & Gunn 1982). More recent studies, however, point to a mass distribution with a cusp in the central parts (Carlberg et al. 1997).
For some galaxy clusters which are very luminous in X-rays, many authors have studied the total mass distribution under the assumption that the hot gas is in hydrostatic equilibrium within the total potential. The correlation between the velocity dispersion of the galaxies and the X-ray temperature (e.g. Wu et al. 1998), as well as the observational evidence that the dynamical properties of clusters have evolved little since (Mushotzky & Scharf 1997; Bahcall, Fan & Chen 1997; Henry 1997; Rosati et al. 1998; Vikhlinin et al. 1998, etc.) indicate that clusters are globally relaxed structures. Further supportive evidence comes from the fact that Crimele et al. (1997) find a relation between the gas and galaxy densities consistent with the assumption of hydrodynamical equilibrium. Thus the Jeans equation together with the hypothesis of hydrostatic equilibrium can be used to describe clusters globally, except for clusters which are still in the process of formation, or of merging with another cluster. In most cases X-ray mass estimates have been obtained with models with flat cores. More recently, however, Tamura et al. (2000) have shown that models of the total mass distribution with cusps give better fits to the data of the cluster A1060 than models with flat cores.
Yet a third way to derive the mass in a cluster is to use the gravitational lensing effect which is produced when the images of background galaxies are distorted by the mass concentration of a galaxy cluster. In the case of strong lensing background galaxies are distorted as giant blue arcs. A massive foreground cluster can also change the shapes (shear effect) and the number density (magnification) of the faint background population. These effects are known as weak lensing. Arcs have been used intensively to map the matter distribution in the central parts of clusters (Fort & Mellier 1994; Mellier 1999 and references therein). In particular considerable progress was achieved from recent spectacular images of arc(let)s obtained with the HST. Many different mass distributions, including profiles with cores or cusps, have been used in the modelling. There seems to be agreement that, if cores exist, their radius should be less than Kpc (e.g. Mellier 1999 and references therein). Except for that, no clear consensus seem to have been reached on the form of the radial profile in the innermost parts.
Comparison of the results obtained with the various methods described so far lead to considerable controversy. In particular, results from strong lensing are a factor higher that results from X-rays. (e.g. Loeb & Mao 1994, Miralda-Escudé & Babul 1995, Tyson & Fischer 1995; Wu et al. 1998, Mellier 1999). This could be explained by the fact that, although the X-ray gas should be globally in gravitational equilibrium, locally in the center-most parts virial equilibrium may not be achieved. It should, however, be noted that models with smaller core radii, with cusps, or more generally with higher masses in the center-most parts, reduce the differences between the results obtained with the different methods (e.g. Wu et al. 1998, Makino & Asano 1999, Markevitch et al. 1999).
N-body numerical simulations of hierarchical gravitational collapse of an ensemble of cold collisionless particles lead to halo radial profiles with a cusp in the central parts. Navarro, Frenk and White (1996) argued that such profiles can be fitted by a “universal” profile of the form:
| (1) |
where and are the characteristic density and length respectively. This profile was first obtained in the context of the standard cold dark matter cosmology, but subsequent numerical studies have shown that this profile is independent of halo mass, of the initial density fluctuation and of cosmology (e.g. Cole & Lacey 1996; Navarro Frenk and White 1997; Eke, Navarro & Frenk 1998; Jing 1999). Simulations with higher numerical resolution result in profiles which are steeper in the central parts, i.e. of the form (Fukushige & Makino 1997, Moore et al. 1998), while cosmologies using collisional dark matter point to even steeper () profiles (Yoshida et al. 2000; Moore et al. 2000), at least in the limit of short mean free paths.
For these considerations it seems appropriate to compare the evolution of clusters of galaxies within backgrounds with different mass profiles, in hope that this may lead to clues about which kind of mass distribution is more realistic. Several N-body simulations of the dynamical evolution of large groups or clusters of galaxies with each galaxy being represented by many particles have been reported in the literature. Funato, Makino & Ebisuzaki (1993), Sensui, Funato & Makino (1999) and Garijo, Athanassoula & García-Gómez (1997, hereafter GAG) use model clusters where initially all the mass is in the galaxies. Funato, Makino & Ebisuzaki (1993) argue that the Faber-Jackson relation is a result of the evolution of galaxies driven by interaction with other galaxies and with the tidal field of the parent cluster. Sensui, Funato & Makino (1999) follow the evolution of a cluster of 128 galaxies initially in virial equilibrium with all mass being attached to the galaxies. They find that within a few cluster crossing times half of the total mass has escaped individual galaxies, and that the amount of stripped material is larger for galaxies in the central regions. The density profile of the common halo thus formed is cuspy, with a radial dependence roughly in the central region and in the outer regions. Bode et al. (1994), GAG and Dubinski (1998) witnessed in their simulations the formation of a massive central galaxy. Bode et al. (1994) modelled poor clusters with 50 galaxies and a varying percentage of the mass in a common background. They find multiple nuclei in the central object in between 10 and 40 per cent of the time. Increasing the percentage of mass in the common background slows the merging rate and this can be sufficient for stalling the formation of the central object if 90 per cent of the mass is in a common background. GAG studied in detail the properties of the central object and found good agreement with those of brightest cluster members. The object formed is roughly spherical, oblate or mildly triaxial. In the latter cases the orientation of the central object correlates well with that of the central group. The triaxiality is in general stronger in the outer parts of the central object. They also find three types of projected density distributions. Objects in the first category have profiles well fitted by an law. In the second category of objects the radial profile follows the law only in the main part of the galaxy and falls bellow it in the outer parts. In the third, most interesting, category the projected surface density of the objects follows the law in the main body of the galaxy, but is systematically above it in the outer parts, as is the case for cD galaxies. The projected velocity dispersion profiles of the central objects also agree with those of brightest cluster galaxies. Dubinski (1998) used an N-body simulation of a cluster of galaxies in a hierarchical cosmological model. He replaced 100 dark matter halos at = 2 with self-consistent disc+bulge+halo galaxy models, thus attaining high resolution. He witnessed formation of the central galaxy through the merging of several galaxies along a filament. The central object was flattened and triaxial, showing alignment with the primordial filament. Its projected surface density was well described by an law and showed no excess in the outer parts, as one would expect from a cD. The kinematics of the object also was in good agreement with the observations.
In this paper we will study the influence of the dark matter distribution on the evolution of the cluster and on the formation and properties of the central galaxy. Our aim is to show that the observable properties of this galaxy can be used to constrain the dark matter distribution in the central parts. The paper is organized as follows. In section 2 we present the simulations and the initial conditions. In section 3 we describe the different evolution of the various models and in section 4 we show how the different initial conditions influence the formation process and the properties of the central giant galaxy. Section 5 discusses the main assumptions and simplifications entering in our simulations. Our results are discussed and summarised in Section 6.
2 Simulations
We have performed a total of simulations following the time evolution of a group of galaxies in virial equilibrium within a common halo. In nearly all cases we used a total of particles with the same mass. A fraction of these particles was used to represent the galaxies and the rest were used for the common halo. In one simulation only one third of the total mass was in galaxies and for this case we used particles, while maintaining the total mass constant, in order to have galaxies represented by a reasonable number of particles.
The common halo was represented alternatively as a Plummer or as a Hernquist sphere (Hernquist 1990). The density distribution of a Plummer sphere follows the law:
| (2) |
This distribution is characterised by the parameters , which represents the total mass in the common halo, and which represents the scale-length of the distribution. The Hernquist distribution follows the law:
| (3) |
Two parameters are also necessary to determine this distribution: the total mass in the common halo and the scale-length . Note that while the Plummer distribution has a central density of , the Hernquist distribution is singular at the origin. Its projected surface density follows closely the law for a large fraction of the radius (Hernquist 1990). It gives a cusped density distribution in the central parts which falls as for small radii and as at large radii.
For a given mass of the common halo , the parameters and were selected as to give a common halo with the same total energy. This gives the following relation between the two parameters:
| (4) |
In this way we can compare simulations with the same global properties changing only the mass profile of the common halo.
| Plummer models | |||||
| Name | Common Halo | ||||
| P5f3/2r1 | 5 | 3/2 | 1 | 1000 | Live |
| P10f3/4r1 | 10 | 3/4 | 1 | 1000 | Live |
| P15f3/2r1 | 15 | 3/2 | 1 | 1000 | Live |
| P10f3/2r1 | 10 | 3/2 | 1 | 1000 | Live |
| P10f1r1 | 10 | 1 | 1 | 1000 | Live |
| P10f3/4r1 | 10 | 3/4 | 1 | 1000 | Rigid |
| P10f1r2 | 10 | 1 | 2 | 1333 | Live |
| P10f1r4 | 10 | 1 | 4 | 1600 | Live |
| P10f1r6 | 10 | 1 | 6 | 1714 | Live |
| P10f1r10 | 10 | 1 | 10 | 1818 | Live |
| P10f1r20 | 10 | 1 | 20 | 1904 | Live |
| P10r1 | 10 | 1 | 1000 | Live | |
| P10r20 | 10 | 20 | 1904 | Live | |
| Hernquist models | |||||
| Name | Common Halo | ||||
| H10f1r1/2 | 5.65 | 1 | 0.5 | 1333 | Live |
| H10f1r1 | 5.65 | 1 | 1 | 1000 | Live |
| H10f1r5 | 5.65 | 1 | 5 | 1666 | Live |
| H10f1r20 | 5.65 | 1 | 20 | 1904 | Live |
The positions and velocities of the particles in the common halo are drawn according to the chosen Plummer (cf. eg. Aarseth, Henon & Wielen 1974) or Hernquist model (Hernquist 1990). The positions and velocities of the center of masses of the galaxies are drawn from the same distribution as the common halo, except that we impose a cut-off radius which is a fraction of the half mass radius of the common halo. Thus the galaxies are distributed within a radius selected as
| (5) |
where is a parameter which is used to determine the initial concentration of the galaxy system. Finally, we also vary the ratio between the mass in galaxies and the mass in the common halo. This mass ratio is given by the parameter:
| (6) |
where represents the initial number of galaxies and the initial mass of each galaxy. We use in all cases identical galaxies, whose density profiles follow a Plummer law with a scale-length of . The mass of each galaxy, , will depend on the mass ratio selected for each particular initial condition, i.e. on the value of .
We repeated one of the simulations using a rigid halo which is not modified during the whole simulation, instead of a live halo composed of particles. We did this in order to study the effect of dynamical friction and the possible differences introduced by a halo capable of responding to the variation of the mass distribution as the central giant galaxy is formed.
In Table 1 we give more detailed information about our simulations. In Column 1 we list the simulation name, coded conveniently so as to describe the initial conditions of each simulation. The first letter P or H is used to note the type of mass distribution, P for Plummer models and H for Hernquist models. This letter is followed by one or two digits indicating the scale-length of the common halo in simulation units. For the case of Hernquist models we indicate the scale-length of the Plummer model with the same total energy. Thus from the name of the simulations we can readily see which of the different simulations are directly comparable. After these digits comes the letter followed by the value of this parameter and finally the letter followed by the value of the mass ratio. In this work we have considered values of between and , thus covering a range of more than one order of magnitude. The three values of the parameters determining the initial conditions are repeated for clarity in Columns 2, 3 and 4. In Column 2 for the case of the Hernquist simulations we list the value of the scale-length of the Hernquist distribution. In Column 5 we indicate the total number of particles used to represent each galaxy and finally in Column 6 we indicate if the common halo is rigid or a live one evolving freely. In two of the simulations, P10r1 and P10r20, the initial positions of the galaxies were selected anywhere within the common mass distribution without any cut-off. Finally in the Hernquist simulation with low galaxy-to-common-halo mass ratio, namely H10f1r1/2, the total number of particles was doubled, while the total mass was kept constant.
To evolve these systems we used the GRAPE-3AF system of the Marseille Observatory using a version of a treecode specially adapted for this system (Athanassoula et al. 1998). This version, since the tree is descended for a whole group of particles, rather than for every particle separately, is more precise than a standard treecode (Barnes & Hut 1986). For the opening angle we used , for the time step and for the softening parameter . With these values the total energy was conserved to within a few parts in a thousand. The simulations with a Plummer matter distribution were followed for a total of roughly computer units or, equivalently, roughly time steps. Each simulation required about hours of CPU time on the Marseille five board GRAPE-3AF system. The evolution of simulations with a Hernquist distribution was followed for twice as long, to follow best the evolution of the central object.
In this paper, we use the same units as in GAG, where the simulation units were selected as , the total mass and the typical scale-length of a galaxy . With the aim of comparing with the observations we set and = 6 Kpc. These values give a total of years for the time unit, Km/s for the velocity unit and a total simulation time of and 16.8 Gyr, for Plummer and Hernquist distributions respectively. Note that this selection of conversion factors, albeit reasonable, is not unique and neighbouring values could also be used. This should be taken into account when comparing our simulations with observational data, hence agreements to within a factor of two should be considered to be quite satisfactory.
3 Evolution of the simulations
3.1 A general impression from snapshots
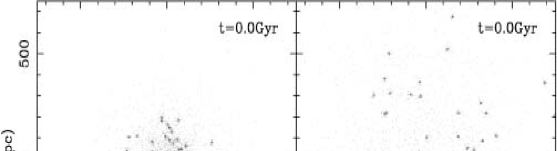
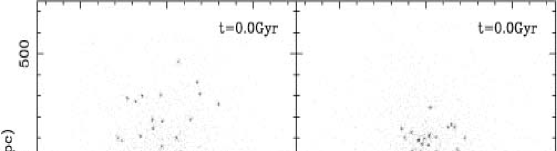
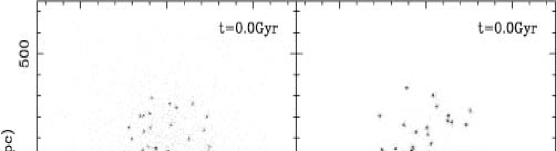

As in the simulations without common halo (GAG) the most noticeable result of the dynamical evolution is the formation of a giant central galaxy in the central parts of the group. The rate of formation of this galaxy, as well as its final extension, depend on the properties of the common halo and of the galaxy system. This can be seen qualitatively in Figs. 1 to 4, where we show respectively the influence of the scale-length, of the initial extension of the galaxy distribution, of the ratio of the mass in galaxies to the mass in the common halo and the influence of different mass profiles.
Amongst our simulations with Plummer background the one that starts more centrally concentrated is P5f3/2r1 and the one that starts off with the least central concentration is P15f3/2r1. Since the other parameters are the same in the two simulations, the comparison of the two evolutions, given in Fig. 1, shows the effect of the scale-length of the galaxy distribution and of the common halo, which changes by a factor of three between the two cases. The more concentrated systems, with shorter scale-length, have faster evolution rates. In this way in simulation P5f3/2r1 a central galaxy is rapidly formed which controls thereafter the dynamical evolution of the system, merging with the satellite galaxies in a shorter time than in the rest of the simulations. On the other hand, in the simulation P15f3/2r1 no central giant galaxy is formed and practically all the galaxies survive until the end of the simulation.
In Fig. 2 we compare the evolution of simulations P10f3/2r1 and P10f3/4r1 to understand the effect of changing the initial cut-off radius of the galaxy distribution. Since the number of galaxies is initially the same in both cases a decrease of the cut-off radius entails a higher density of the galaxy system. As we can see, if the galaxy distribution is initially denser, the system has a faster evolution rate. Since this is also the effect of a more concentrated distribution, as discussed earlier, we can conclude that it is the density in the central parts that controls the rate of evolution. Thus distributions with higher central densities, coming either from higher central concentrations or higher densities over a larger area, will have a faster evolution than distributions with lower densities in the central area.
Fig. 3 compares the evolution of simulations P10f1r1 and P10f1r20 and shows the effect of the ratio of the mass in individual galaxies to the mass in the common halo. Simulation P10f1r1 has 20 times more mass in the common halo than simulation P10f1r20. The comparison shows clearly that the simulation with the lower fraction of the mass in galaxies (P10f1r1), i.e. with the higher fraction of the mass in the common halo, evolves slower than the simulation with the higher fraction of the mass in galaxies. This in agreement with what was seen in the simulations of Bode et al. (1994) for poor clusters of galaxies, as well as those of Barnes (1985), Bode et al. (1993) and Athanassoula et al. (1997) for compact groups. This may be easily understood (Athanassoula et al. 1997) if we think of the galaxies as a perturbation of the global common halo potential. If the fraction of the mass in galaxies is higher, the perturbation is also stronger, the galaxies will attract each other more strongly and have more chances of colliding and therefore of merging. The opposite will be true if the fraction of the mass in galaxies is small. In the limiting case were the galaxies are considered as test particles in the common halo, they will collide only if their orbits accidentally cross.
Fig. 4 compares the evolution of two simulations, one, H10f1r1, in which the distribution of the common halo and the galaxies follows a Hernquist law, and the other, P10f1r1, in which it follows a Plummer law, the remaining parameters being the same. The difference is quite striking. We note that the evolution is much more rapid for the Hernquist model. Thus, at any given time, for the Plummer model there are more galaxies that have not fallen into the central one than for the Hernquist model.
3.2 Global parameters
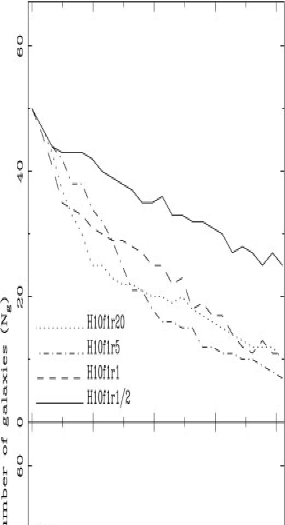
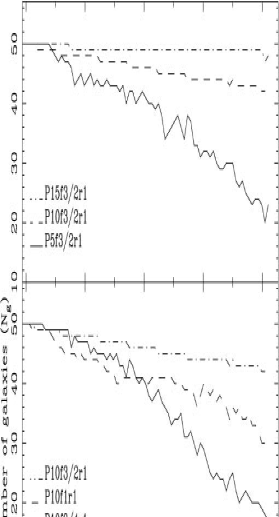
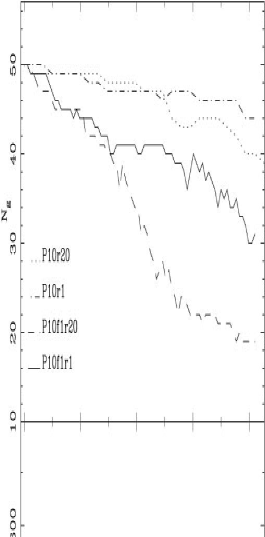
We will use in the analysis of the simulations the same definitions of the central galaxy and of the merging conditions as in GAG. They allow us to make a more quantitative study of the evolution of the system. The first factor that we can consider is the number of galaxies that survive at a given time. This is plotted as a function of time in Figures 5 and 6. In the upper panel of Fig. 5 we show the results for the simulations with a Hernquist distribution and in the lower panel for the simulations with a Plummer distribution. In this figure we concentrate on simulations with and and vary only the fraction of mass in the galaxies. The evolution shown in Fig. 5 is in good agreement with the qualitative results of Fig. 3. In general a larger percentage of the total mass in galaxies leads to a faster evolution, for the reasons explained in the previous section. For simulations with Plummer distributions the effect is only important in the second half of the evolution when the central galaxy is sufficiently massive. On the other hand for simulations with Hernquist distributions the effect is clear from the start, and is stronger. These differences are due to the different evolutionary histories of the two types of simulations, which will be discussed in section 4.1. Finally we should also note that the fastest of all evolutions is for simulations with Hernquist profiles and the biggest fraction of the mass in galaxies.
Fig. 6 also shows the number of galaxies that have not merged at a given time as a function of this time, but concentrates on Plummer profiles, to see the effect of the three free parameters of the Plummer distribution. The upper panel illustrates the effect of the scale-length of the distribution of the common halo and of the galaxies, the middle one the effect of the cut-off radius and the lower one the effect of the fraction of mass in the galaxies. The results agree well with what is seen qualitatively in Figures 1 to 3. The galaxy number decreases faster in the cases of more concentrated mass distribution, i.e. halos and galaxy distributions with a smaller scale-length. Also configurations with a smaller cut-off radius of the galaxy distribution evolve faster.
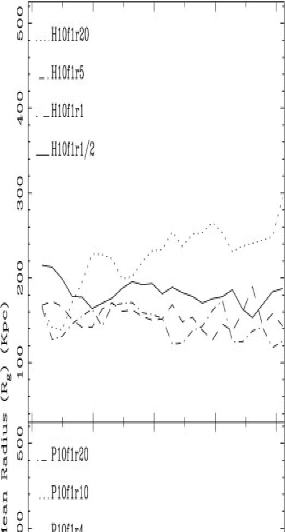
The next quantity that we can consider is the evolution of the mean radius of the system of surviving galaxies. It is calculated as the average distance of the centers of the surviving galaxies from the center of the group not taking into account the giant central galaxy. Its time evolution is shown in Fig. 7. As in Fig. 5 we show in this figure the simulations with for the Hernquist halo distributions (upper panel) and Plummer distributions (lower panel). In all but a couple of cases the mean radius of the system stays constant. This argues that the satellite galaxies that fall into the central one are not only those that have lower binding energies and orbits with a smaller mean radius. Rather all galaxies, independent of their binding energy, are concerned. The case of H10f1r20 is different, since the mean radius of the surviving galaxies increases with time. This is due to the fact that one galaxy is on an outwards going orbit, while the total number of galaxies is rapidly reduced (cf. Fig. 5) so that this one galaxy can influence the statistics.
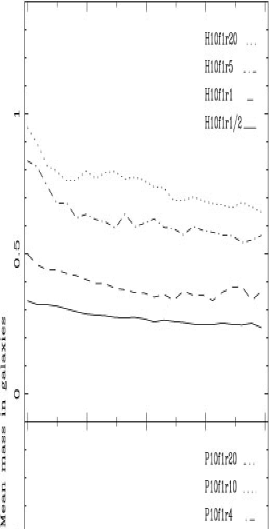
The mean mass in surviving galaxies, i.e. not taking into account the giant central galaxy, is indicative of whether the mass loss effects due to stripping are important in the dynamical evolution of the groups, or not. The time evolution of this parameter is shown in Fig. 8 for Hernquist systems (upper panel) and for Plummer systems (lower panel). In all the cases the mass in galaxies diminishes with time, which means that stripping is present and that the stripped mass is not all captured by other individual galaxies. Some of it is captured by the giant central galaxy, while another part stays in between the individual galaxies.
3.3 The rigid halo case
If we could, in general, use in simulations a rigid halo, rendered by an external forcing, constant in time, instead of a “live” halo formed by a large number of particles, we could save a considerable amount of CPU time. For this reason we will, in this section, compare the effects of a rigid and a live halo on the evolution of a simulation, to see whether the corresponding gain in CPU is possible without introducing a bias in the results. At the beginning of the simulation a live halo will give, on average, the same forces as a rigid halo. This will, however, not be necessarily the case as the simulation evolves, since the mass distribution of the halo may change with time, in response to the evolution of the distribution of the individual galaxies and to the formation of the giant central galaxy. Furthermore, even in cases where the mass distribution in the common halo hardly evolves, we are not assured of the adequacy of the rigid halo, since it will not reproduce the dynamical friction on the satellite galaxies that the live halo exerts naturally. This effect could in principle be estimated by the Chandrasekhar (1943) formula, except for the fact that the common halo does not necessarily have a homogeneous density distribution, while dynamical friction is much more important in strongly centrally concentrated backgrounds than in less concentrated ones (Athanassoula, Makino & Bosma 1997). It is thus necessary to compare a simulation with a live halo to one with a rigid one, to see how big a bias the rigidity of the halo introduces.
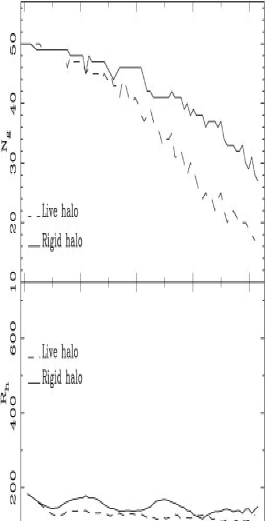
To check this effect we have repeated one simulation, namely P10f3/4r1, using a rigid halo instead of the live halo composed of 50000 particles. In Fig. 9 we compare the evolution of the global parameters of the two systems. We can see that the number of surviving galaxies is considerably lower in the case of a live halo (upper panel). The principal reason for this is the fact that the dynamical friction with the live halo brakes the galaxies and, as they move slower, they merge easier with the central galaxy. The radius which contains half the mass of the galaxy system stays in both cases roughly constant with time and the average value is roughly the same in the two simulations (middle panel). The velocity dispersion of the system of galaxies shows in both cases an increase with time, presumably due to the fact that the faster individual galaxies merge less than the slower one. The lower panel of Fig. 9 shows that this increase is stronger for the live halo than for the rigid one. This should be linked to the fact that there are more mergings in the live halo case.
3.4 The effect of the cutoff on the galaxy distribution.
In most of our simulations we have included an artificial cutoff in the initial distribution of the galaxies. This partly reflects the fact that the distribution of galaxies in a group or cluster also does not exceed to infinity. It has the added advantage of improving the statistics for a fixed number of particles per simulation. In this section we discuss its effect by comparing the evolution of runs with cut-off with that of runs without cut-off and otherwise the same properties. Fig. 10 compares two such sets of simulations, simulation P10r20 to P10f1r20, and simulation P10r1 to P10f1r1. In this figure we compare two global properties of the system of surviving galaxies: their number (upper panel) and their velocity dispersion (lower panel). The number of surviving galaxies decreases considerably faster with time if we include a cut-off. This is due to the fact that by constraining the volume, while keeping the number of galaxies fixed, we increase the density of the galaxies and this in turn, as discussed in the beginning of this section, leads to a faster evolution of the system.
The lower panel shows that the velocity dispersion is smaller for the cases without cut-off. There can be two possible explanations to this. The first one relies on the fact that it is the galaxies with the lower velocities that will merge, and therefore systems that involve more merging should also have a higher dispersion of velocities. If, however, this was the explanation then we would note differences in the velocity dispersions after the differences in the number of remaining galaxies occurred, which, as can be seen in Fig. 10 is not the case. We will thus explain the difference by the fact that the velocity dispersion of the group decreases with radius. Thus a more extended group has a lower mean dispersion of velocities than a more compact one.
4 The central object
The central object is defined as in GAG. The properties of this object are studied using the same methods described in that paper and we refer the reader to that paper for more details. Here we will discuss directly the physical properties of the objects formed in our simulations.
4.1 Stripping versus merging
The mass of the central galaxy grows with time by means of two mechanisms: by merging of satellite galaxies and by accreting material tidally stripped from galaxies. We are interested in how the relative importance of these two mechanisms depends on the initial conditions. In Fig. 11 we show for some selected simulations the time evolution of the total mass in the central regions not belonging to the individual galaxies. In the left panels we show the simulations where the initial density distribution follows a Hernquist profile, while in the right panels we show the cases of initial Plummer density distributions. Each horizontal couple of panels corresponds to two simulations with identical or comparable global properties. The solid line corresponds to the total mass as a function of time, while the dotted line corresponds to the part of this mass that comes from stripped material. The difference between the two lines at a given time gives the part of the total mass that comes from mergers with satellite galaxies.
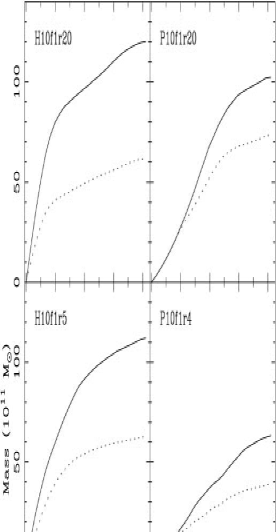
Let us first note that in general the total mass of the central object is larger in simulations starting with Hernquist profiles than in simulations starting with Plummer profiles. The total mass of the central object (at a given time) is also larger in simulations where the total mass that is initially in galaxies is larger, as expected.
As can readily be seen from Fig. 11 the initial distribution of the mass profile (background mass and distribution of galaxies) is determinant not only for the total mass of the central object, but also for the formation process leading to it. In Plummer simulations all the initial mass increase is due to the accretion of stripped material. This is true for a longer period of time in the case of simulation P10f1r1, where the mass in galaxies was initially the same as the mass in the common background. In this simulation also the final fraction of the total mass that comes from tidal stripping is more important than in the others. On the other hand in the Hernquist simulations the merging of satellite galaxies into the central galaxy is present from the start. This should be due to the differences in central concentration. Our results argue that the central concentration of the Hernquist profile is sufficiently high to compensate for the higher relative velocities of the galaxies and to cause a high initial burst of mergings.
Thus, as can be seen from Fig. 11 the relative importance of the stripping is more significant in the Plummer cases than in the Hernquist ones. Conversely the absolute amount of stripped material in the first part of the simulation is larger for the Hernquist cases. This difference is due to the fact that the total mass of the central object in the first part of the simulation is considerably bigger for Hernquist cases.
These differences between simulations with Plummer and with Hernquist profiles can be readily understood from the different evolutionary histories of the two groups of simulations. In the Plummer case the mass distribution in the central parts is nearly flat and as the initial position of the satellite galaxies is selected following this distribution, no initial concentration of galaxies is present. Thus, there is no strong merging of satellite galaxies into a central object during the first steps of the simulations. The satellite galaxies orbiting within the core radius occasionally merge with some of their companions. These mergings, which do not necessarily occur in the center-most parts increase the number of larger galaxies within the core radius, until two or more of these finally merge to give a giant central object.
On the other hand, the dynamical evolution of the simulations with a Hernquist profile is very different. The strong peak of this density profile towards the central parts gives a strong initial concentration of satellite galaxies which merge very fast to create the seed of a giant central object. We refer to this stage of the evolution as an initial burst of mergers. The central object will accrete some stripped material and merge with some other satellite galaxies entering the central parts. After the strong initial merger, the mass increase of the galaxy is milder than in the initial steps of the simulations. As we will see in subsection 4.3 these two different formation stories give galaxies with very different observational properties. Not all the central objects will have profiles that resemble real giant elliptical or cD galaxies.
4.2 Volume density profiles.
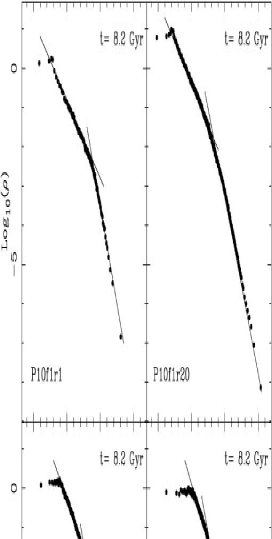
Figure 12 shows the volume density profile as a function of radius for simulations P10f1r1, P10f1r20, H10f1r1 and H10f1r20 at Gyrs. Plummer simulations show clearly two distinct regions, the outer one being much steeper than the inner one. Each of these can be relatively well fitted by a straight line in a log-log plane. The slopes of these two lines, as obtained by eyeball fits, are roughly -2 and -5. The outer part is clearly discernible all through the simulation and its slope, which is roughly equal to the slope of the outer part of the Plummer density profile, stays roughly constant all through the simulation. This is not the case for the inner part, which in some earlier times is more difficult to discern than at Gyrs. Since our simulations stop at Gyrs, we have no information on the evolution of the profile at later times.
The density profiles coming from Hernquist simulations do not show the clear existence of two distinct regions, although they do steepen at larger radii. For consistency we also made eyeball fits with two straight lines. The inner slopes thus found are steeper than the corresponding ones for the Plummer simulations, while the slopes of the parts further out are roughly the same. The profile of H10f1r20 has a shallower sloper in the outermost parts, which will be discussed at length in the next subsection.
We compared all these profiles to the Hernquist profile (Hernquist 1990) and found that, if we exclude the innermost and outermost parts, the Plummer simulations with little mass in the common halo, as well as all Hernquist simulations, are well fitted by this profile. This was, however, not the case for the Plummer simulations with a high fraction of the mass in the common halo. The physical implications of this result will be discussed further in the next subsection with the help of the projected density profiles.
4.3 Projected density profiles.
The most interesting property of the central galaxies formed in these simulations appears when we study their projected density distributions. Remnants of the merging of a pair of progenitor galaxies have a projected density profile which is well fitted, in all but the innermost parts, by the law (see for instance Barnes and Hernquist 1992, or Barnes 1998 and references therein). A similar result was found for multiple mergings in compact groups (Weil & Hernquist 1996, Athanassoula & Vozikis 1999). Furthermore the objects formed in GAG from multiple mergers in large groups or small clusters also showed this property, except for an excess projected density in the outermost parts in some cD-like cases. Our new simulations with a common halo present a larger variety of profiles.
The three-dimensional density profiles of the central object formed in the Plummer models with a considerable fraction of the mass in the background halo can not be well fitted by a Hernquist law, and therefore does not give an in projection. In fact the larger the fraction of mass in the common halo, the worst the agreement is. On the contrary, if the mass in the common halo is very much smaller than the mass in common galaxies (e.g. in simulation P10f1r20), then we recover initial conditions closer to those of the simulations in GAG, and the profiles are better fitted by a Hernquist law. This form of the profiles does not depend either on the initial scale-length of the mass distribution, or on the radius initially containing all galaxies, and depends only on the initial mass fraction in galaxies. These results are best illustrated in Figures 13 and 14.
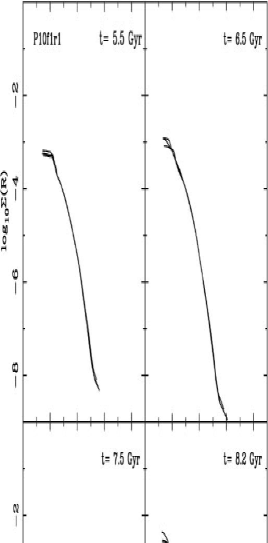
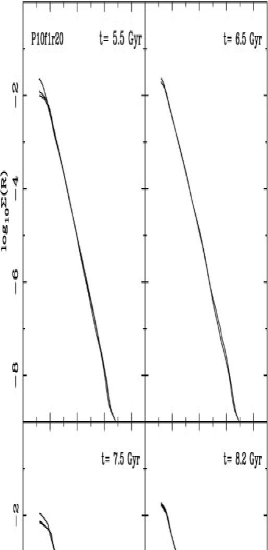
The mass distribution in the central parts of simulation P10f1r1, where matter is equally distributed between the galaxies and the background, is heavily influenced by the matter in the common halo, and the violent relaxation which would have otherwise led to an projected profile is hampered. This result can be seen in Fig. 13, where we show the projected density profile of the central object formed in simulation P10f1r1 at four different times. In each of the panels we show the result of 10 projections from random viewing angles, thus making clear that this result is projection independent. At no time does this profile follow an law and thus the central object cannot be associated to any giant elliptical or cD galaxy, as are observed in the central parts of galaxy clusters.
The central object formed in simulation P10f1r20 feels only a small influence from the common halo and develops a density distribution which is well fitted by an law. This can be seen in Fig. 14, where we show the projected density profile of the central object at four different steps of the simulation. This effect is again not due to a particular viewing angle. As was already mentioned, this result is very similar to what was found in GAG since in P10f1r20 there is very little influence from the background.
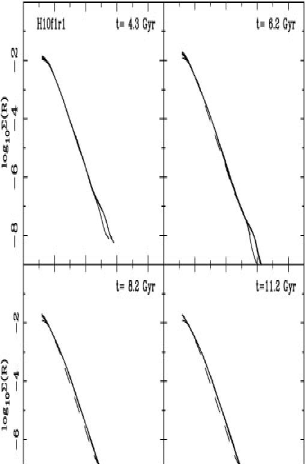
Simulations where the common background is described initially by a Hernquist distribution give very different results. The projected density profile for the central galaxy in simulation H10f1r1 is shown in Fig. 15. As in the case of simulations P10f1r1, only half the mass was initially in the galaxies. We note that the projected density profile of the central object follows an law in the main body of the object and can thus be associated to a real giant elliptical.
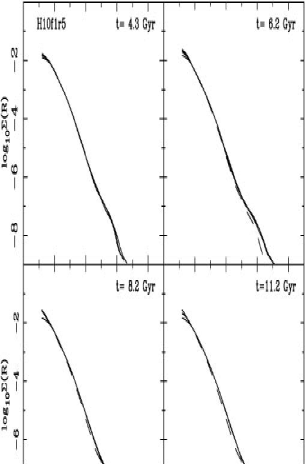
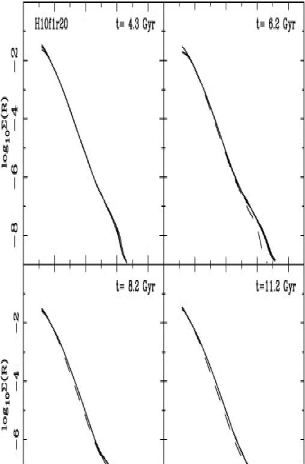
Simulations H10f1r5 and H10f1r20 have a much smaller fraction of their mass in the common halo; roughly 17 and 5 per cent respectively. Their projected radial density profiles are shown for six different time steps in Figures 16 and 17. They show clearly that the radial profiles follow well the law over the main body of the object. Here it can not be claimed that this profile is formed as a response to the massive common halo with a Hernquist radial profile, since the mass in the halo is rather small. These central objects were formed in a situation where there is a strong central concentration of galaxies at the start, thus favouring a strong and rapid merger. Thus giant galaxies formed from a rapid multiple merger in the central part of groups or clusters should have an projected density profile over their main body.
Now let us turn to the excess mass over the law in the outermost parts of the central object. This should be associated with the corresponding excess light in the outermost parts of some BCM’s and giant elliptical galaxies. This light excess has, unfortunately, been called “halo”, a term which could bring confusion with the dark halo. To avoid such a confusion, while being coherent with the nomenclature used so far, we will use the term “luminous halo”. Giant ellipticals with such a luminous halo are called cD galaxies. We will now examine which of our simulations present central objects with such a luminous halo and which can therefore be associated with cD galaxies.
Simulation P10f1r20, which is the only one of those with an initial Plummer mass distribution that shows an profile over the main body of the galaxy, has only a very small density excess over the profile in the outermost parts of the central object, which hardly grows with time. It can thus not be easily associated with a cD galaxy.
Central objects formed in simulations with a Hernquist background present such an excess of matter over the profile in the outermost parts. This is small in cases with a large fraction of the mass in the common background, as H10f1r1, and becomes more important for simulations where the fraction of mass in the galaxies is also more important. Thus the central object in simulation H10f1r5 has a clear outer mass excess and that in H10f1r20 an even bigger one (cf. Figures 16 and 17), independent of the projection selected. The existence of this extra mass is clear relatively early on in the simulations, and increases considerably with time. Thus such objects should be associated to cD galaxies, since they form in the central part of the group, follow an projected density law over the main part part of their body and have excess matter over that profile in the outermost parts.
This inverse correlation between the excess mass in the outermost parts and the amount of mass in the common background halo could be due to the fact that a deviation from the is more difficult to form in the strong background. Alternatively it could be due to the fact that the rate of evolution is slower in simulations with a massive common halo, i.e. that at a given time the three simulations are at different stages of their evolution. The total evolution time in these simulations was twice as long as that of Plummer simulations in order to study the possible influence of the dynamical evolution of the group in the distribution of the luminous halo material of the central object. In Figs. 15, 16 and 17 we show that indeed the luminous halo of the central object increases with time, specially in the cases where there is a considerable fraction of mass initially in the galaxies. As we have already pointed out in section 2, the conversion from computer units to physical units is not unique and thus the times given in figures 15, 16 and 17 could be modified if e.g. a different value was adopted for the masses or the scale-length of the initial galaxies. We nevertheless believe that all simulations were evolved sufficiently long for a clear picture to be obtained.
5 Limitations of our models
Simulations of the evolution of galaxy clusters, seen the complexity of the objects to be modelled, use a number of simplifications and assumptions, and the simulations presented here are no exception. We will here discuss the simplifications and assumptions specific to our simulations to get a better understanding of how they might have influenced our results.
The initial number of galaxies in all our simulations is 50. Thus they do not apply to rich clusters, but more to large groups, or poor clusters. They can also apply to sub-condensations in rich clusters – provided of course the remaining part of the cluster does not significantly influence the evolution – or subunits which will come together to form a large cluster.
Our initial conditions are not cosmological. They were constructed specifically so as to allow us to study best the physics of the formation of the central object and particularly the effect of different physical parameters on this formation. We have thus created series of initial conditions where one parameter only was varied, so as to best put forward the effect of this specific parameter. We considered in turn the effect of the scale-length of the mass distribution, of the cut-off radius of the galaxy distribution and of the mass fraction in the common halo. Most important, we have considered both matter distributions with a core and matter distributions with a cusp, and have studied the effects of these two very different distributions on the evolution of the group and on the properties of the central galaxy. In other words we have been able to create our initial conditions such as to put forward best the phenomena we wished to study. Of course cosmological simulations and in particular observations will be necessary to tell us whether all the spectrum of initial conditions considered here are possible or realistic. Our approach is similar to that used e.g. in studying the formation of bars in disc galaxies. It is possible to conclude that the growth rate of the bar is smaller in discs which are hot and/or have an important spheroidal component in their center or main parts, without having to worry about the exact form of the radial density profile of the disc or halo component. Once the essential physics of the bar formation is understood, then one can start worrying about whether this or that type of radial density profile is more realistic, follows best from cosmological initial conditions, or is in better agreement with the observations.
The fraction of mass in the common halo is, in all our simulations, considerably smaller than what is believed to be the case in real groups or clusters. Nevertheless, the range explored is sufficient for us to establish how the fraction of mass in the common halo influences the evolution. It also allowed us to establish that the form of the radial profile of the central object in Plummer simulations is incompatible with observed profiles in cases with a high fraction of mass in a common halo. Simulations with a higher fraction of mass in the common halo would necessitate considerably more CPU time for two reasons. First the total number of particles in the simulations would increase considerably if the number of particles per galaxy is kept constant. Also the time it would take for the central object to form would also increase, thus leading to longer CPU times, if the time-step is kept constant. Nevertheless, it would be interesting to pursue in the future simulation with higher percentage of mass in the common halo, particularly in order to test the formation of the luminous halo in the outer parts of the central objects.
Probably the most serious drawback of our simulations is the fact that our galaxy models are very simplistic. Thus we do not distinguish between luminous and dark matter, and have not considered any galaxies with a disc, with anisotropy or with rotation. Thus we can not distinguish between dark and luminous mass in the central object. Simulations with more realistic galaxy models would necessitate a considerably higher number of particles, particularly if disc galaxies are considered. Such simulations would nevertheless be very interesting, and should be envisaged now that increases in computing power make them possible.
We have also neglected the existence of gas, both cold and hot, both in the galaxies and in the common background halo. Thus effects like ram-pressure stripping of individual galaxies are totally neglected, but this should not influence the formation of the central object. It should of course be kept in mind that the fraction of common background halo in our simulations includes all mass encompassing the whole cluster and not linked to individual galaxies, i.e. it includes also the hot gaseous component.
The above summarise the main simplifications and assumptions underlying our simulations. It is obvious that there is room for improvement, but none of our assumptions should alter the main physical results found in this paper.
6 Summary and Discussion
We have performed N-body simulations of the dynamical evolution of groups of 50 galaxies embedded in a common background mass distribution. We considered two density distributions, the Plummer and the Hernquist one. The former has a core, while the latter has a cusp. The main goal of this paper was to compare the evolution of the group and the properties of the central giant galaxies formed in these two very different matter distributions.
As in the case of simulations of groups with no common background distribution of matter (GAG), the evolution of the systems within a common halo is driven mainly by the merging instability (Carnevali et al. 1981). In all cases a giant galaxy is formed in the central parts by merging of some secondary galaxies and by accreting material stripped from the rest of the galaxies by tidal forces. The evolution rate of the systems is very sensitive to the initial conditions and is controlled mainly by the density in the central parts. Distributions with higher densities resulting either from higher central concentrations or higher densities over a larger area, have a faster evolution than distributions with lower densities in the central parts. One should nevertheless remember that the dynamical time of denser configurations is shorter.
To study more quantitatively the evolution of the different simulations we have followed the time evolution of some global parameters, like the number of galaxies that have not yet merged, their mean distance from the center of the group, their mean mass and their velocity dispersion. The total number of galaxies decreases with time in all cases. This decrease is faster for configurations with a larger fraction of the total mass in galaxies. This temporal decrease is particularly important for the first Gyrs of the evolution of cusped initial distributions, where there is a strong initial merging. In the Plummer simulations, where the initial dominant effect is the tidal stripping of material, the temporal decrease of the number of galaxies is only important after the first Gyrs. The effect of the initial conditions on the mean distance of the galaxies from the center of the group, on their mean mass and on the velocity dispersion of the galaxy system is less spectacular.
We have also studied the effect of substituting the live common background halo of particles by a rigid halo with the same parameters by comparing two simulations with the same initial conditions, except that the one has a rigid and the other a live halo. The global evolution of the two simulations is quite different. In particular we find that the number of galaxies that have not yet merged decreases much faster in the simulation with the live halo. This can be easily understood since the evolution in a live halo includes the effects of dynamical friction which brakes the galaxy motion and favours the merging with the giant galaxy. Thus, although simulations with rigid common halos require considerably less CPU, they should be avoided, since their results are not reliable.
The different profiles of the mass distribution influence both the evolution of the group and the properties of the giant galaxy formed in the centre. In the case of a Plummer density distribution the individual galaxies undergo pairwise mergers giving rise to some larger galaxies in the core of the cluster. At some later step these galaxies merge and form the giant central galaxy. On the other hand, in the Hernquist case the high central concentration of galaxies in the center leads to a high “‘burst” of mergers in the central parts during the initial steps of the evolution and the giant central galaxy is quickly formed.
Not only the merging histories but also the quantity of stripped material from the satellite galaxies is different in the two cases. In the Plummer cases the fraction of the total mass in the central galaxy that comes from stripping is very important, especially early on in the simulation. In the Hernquist cases the fraction of the mass of the central galaxy that comes from stripped material is not so important, but amounts nevertheless to a considerable mass, since the total mass in the central object is important.
These different evolutionary histories give rise to central objects with very different observable properties. We have studied the projected density distributions of the giant galaxies at different time-steps and for different random projections. The shape of these profiles depends heavily on the initial distribution of the mass. In the cases of Plummer distributions with half the total mass in the common background, the projected density profile of the giant galaxy does not follow the law at any time during the simulation. The radial density profiles of these central objects are not observed in the real giant galaxies in the center of the clusters. Only for the case where most of the mass is initially in the galaxies does the giant galaxy formed within a Plummer distribution follow the law typical of elliptical galaxies.
On the contrary, the galaxies formed within Hernquist distributions do follow laws in the main parts of their bodies in all the cases. Moreover, in the external parts, they show the typical projected density excess of cD galaxies in the case where a considerable fraction of the mass is initially in the galaxies. This excess over the law is not a projection effect and thus reflects the real matter distribution of the central object. Furthermore, this excess gets larger as the dynamical evolution of the group proceeds.
Thus our simulations suggest that central galaxies with profiles can form either if the fraction of mass in the common halo is very small, or if the density distribution is cusped. Since the amount of matter observed in the common background is considerably larger than what would lead to profiles for all density distributions, our simulations argue strongly in favour of cusped matter distributions, at least for those groups and clusters where a BCM has formed.
Acknowledgments. We would like to thank the referee, Yoko Funato, for helpful comments, Albert Bosma for many useful discussions and Jean-Charles Lambert for his help with the administration of the runs. E.A. would also like to thank IGRAP, the INSU/CNRS and the University of Aix-Marseille I for funds to develop the computing facilities used for the calculations in this paper. A.G. and C.G.G. acknowledge financial support by the Dirección de Investigación Científica y Técnica under contract PB97-0411.
References.
Aarseth S.J., Henon M., Wielen R., 1974, A&A, 37, 183
Athanassoula E., Bosma A., Lambert J.C., Makino J., 1998, MNRAS, 293, 369
Athanassoula E., Makino J., Bosma A., 1997, MNRAS, 286, 825
Athanassoula E., Vozikis Ch. L., 1999, in “Galaxy interactions at low and high redshift.”, eds. J. Barnes & D. Sanders, Kluwer Academic Publishers, Dordrecht, p. 145
Bahcall N.A., Fan X., Chen R., 1997 ApJ, 485, L53
Barnes J., 1985, MNRAS, 215, 517
Barnes J., 1998 in “Galaxies: Interactions and induced star formation.” eds. D. Friedli, L. Martinet & D. Pfenniger, Springer-Verlag, Berlin, p. 275
Barnes J. Hernquist L., 1992, ARAA, 30, 705
Barnes J., Hut P., 1986, Nat, 324, 446
Bode P.W., Berrington R.C., Cohn H.N., Lugger Ph.M., 1994, ApJ, 433, 479
Bode P.W., Cohn H.N., Lugger Ph.M., 1993, ApJ, 416, 17
Carlberg R.E., Yee H.K., Ellingson E., Morris S.L., Abraham R., Gravel P., Pritchet C.J., Smecker-Hane T., Hartwick F.D.A., Hesser J.E., Hutchings J.B., Oke J.B., 1997, ApJ, 485, L13
Carnevali P., Cavaliere A., Santangelo P., 1981, ApJ, 249, 449
Chandrasekhar S., 1943, ApJ, 97, 255
Cirimelle G., Nesci R., Trevese D., 1997, ApJ, 475, 11
Cole S., Lacey C., 1996, MNRAS, 281, 716
Cowie L.L., Binney J., 1977, ApJ, 215, 723
Dubinski j., 1998, ApJ, 502, 141
Eke V.R., Navarro J.F., Frenk C.S., 1998, ApJ, 503, 569
Fabian A.C., Nulsen P.E.J., 1977, MNRAS, 180, 479
Fort B., Mellier Y., 1994, A&AR, 5, 239
Fukushige T., Makino J., 1997, ApJ, 477, L9
Funato Y., Makino J., Ebisuzaki T., 1993, PASJ, 45, 289
Gallagher J.S., Ostriker J.P., 1972, AJ, 77, 288
Garijo A., Athanassoula E., García-Gómez C., 1997, A&A, 327, 930 (GAG)
Hausman M.A., Ostriker J.P., 1978, ApJ, 224, 320
Henry J.P., 1997, ApJ, 489, L1
Hernquist L., 1990, ApJ, 356, 359
Jing Y.P., 1999, ApJ, L69
Kent S.M., Gunn J.E., 1982, AJ, 87, 945
Loeb A., Mao S., 1994, ApJ, 435, L109
Makino N., Asano K., 1999, ApJ, 512, 9
Markevitch M., Vikhilinin A., Forman W.R., Sarazin C.L., 1999, ApJ, 545, 553
McGlynn T.A., Ostriker J.P., 1980, ApJ, 241, 915
Mellier Y., 1999, ARAA, 37, 127
Merritt D., 1984, ApJ, 276, 26
Miraldá-Escudé J., Babul A., 1995, ApJ, 449, 18
Moore B., Gelato S., Jenkins A., Pearce F.R., Quilis V., 2000, ApJ, 535, L21
Moore B., Governato F., Quinn T., Stadel J., Lake G., 1998, ApJ, 499, L5
Mushotzky R.F., Scharf C.A., 1997, ApJ, 482, L13
Navarro J.F., Frenk C.S., White S.D.M., 1996, ApJ, 462, 563
Navarro J.F., Frenk C.S., White S.D.M., 1997, ApJ, 490, 493
Ostriker J.P., Hausman M.A., 1977, ApJ, 217, L125
Ostriker J.P., Tremaine S.D., 1975, ApJ, 202, L113
Richstone D.O., 1976, ApJ, 204, 642
Rosati P., Ceca R.D., Norman C., Giacconi R., 1998, ApJ, 492, L21
Sensui T., Funato Y., Makino J., 1999, PASJ, 51, 1
Tyson J.A., Fischer Ph., 1995, ApJ, 446, L55
Vikhlinin A., McNamara B.R., Forman W., Jones C., Quintana H., Hornstrup A., 1998, ApJ, 498, L21
Weil M.L., Hernquist L., 1996, ApJ, 460, 101
Wu X.P., Chiueh T., Fang L.Z., Xue Y.J., 1998, MNRAS, 301, 861
Yoshida N., Springel V., White S.D.M., Tormen G., 2000, ApJ, 535, L103