Lensing properties of 7 damped Ly absorbing galaxy-QSO pairs
Abstract
Le Brun et al. (1997) presented the first identifications of the galaxies giving rise to 7 intermediate redshift damped Ly (DLA) absorption systems. Here, we study the gravitational lensing properties of these foreground galaxies based on their observed optical appearance and on the absence of any secondary lensed quasar image. We consider the possibility that any secondary image be hidden due to extinction by dust, but find it unlikely. We derive upper limits on the amplification factor affecting the luminosity of the background quasars; in each case, this factor is found to be less than 0.3 mag. We also obtain upper limits on the total mass of the damped Ly- galaxies, within radii equal to the quasar impact parameters. Mass-to-light ratios are found to be consistent with existing estimates based on X-ray emission or on motion of dwarf satellites. Although we show that lensing is not important in this sample, we note that existing DLA surveys used to determine the cosmological density of gas at are based on samples of quasars brighter than the ones considered here and for which the amplification bias is likely to be stronger.
Key Words.:
Gravitational lensing – Galaxies: halos – Galaxies: ISM – Quasars: absorption lines1 Introduction
Redshifted damped hydrogen Ly (DLA) lines are sometimes detected in the spectra of background quasars. They present neutral hydrogen column densities cm-2 similar to the value found at the optical radius of present-day galactic disks (Wolfe et al. 1986), which suggests that they arise in progenitors of present-day spiral galaxies.
Because the impact parameters necessary to produce such absorption lines are likely to be small, the galaxy gravitational potential may lead to significant gravitational lensing effects, such as amplification of the apparent luminosity of the background quasar, or even formation of multiple images.
In turn, these effects can induce severe biases in the samples of quasars and absorbers. First, impact parameters are increased because of lensing (the by-pass effect; see Smette, Claeskens, Surdej 1997, hereafter, SCS) thus decreasing the cross-section for DLA absorption. Second, background quasars which present DLA absorptions in their spectra also have their apparent luminosity increased because of lensing: hence, intrinsically faint quasars can enter apparent magnitude limited samples. As a consequence, these samples may show an over-representation of quasars that present DLA absorption systems: this amplification bias apparently increases the cross-section for damped Ly- absorption. These aspects can be evaluated in a statistical sense for a well-defined magnitude limited sample (cf. SCS; Bartelmann & Loeb 1996). For bright quasar samples, the amplification bias was found to dominate the by-pass effect, which leads to predictions that the number density of DLA systems and the cosmological density of neutral hydrogen (since DLA absorbers contain most of the H i of the Universe) may be significantly overestimated. Note that extinction by dust introduces other biases competing with the ones just described (Fall & Pei 1993, Perna et al. 1997, Bartelmann & Loeb 1998).
It must be noted however, that existing theoretical estimates are based on a series of simplifying assumptions, one of which being that the DLA absorbers are very similar to present-day disk galaxies. As a matter of fact, Le Brun et al. (1997) presented the first identifications of damped Ly absorbing galaxies at intermediate redshifts: in a sample of 7 DLA absorbers, 3 turn out to be spiral galaxies of various sizes and luminosities, 2 are compact objects and 2 are amorphous, low-surface brightness galaxies (an additional compact object appears to be responsible for a higher-redshift DLA system). This study showed that the population of galaxies giving rise to DLA systems is more heterogeneous than previously thought.
Independently, SCS found that lensing effects may be present in the IUE (Lanzetta et al. 1995) and Rao et al. (1995) Mg ii surveys. In addition, in a follow-up of this latter survey, Rao & Turnshek (2000) find a surprisingly high value of at , as expected if lensing effects are important (SCS).
Here we consider the lensing properties of the absorbing galaxies detected by Le Brun et al. (1997). These observations were made using the WFPC2 camera onboard the Hubble Space Telescope, so that the absorbing galaxy candidates are clearly separated from the quasar images, and their characteristics (impact parameter, luminosity, morphology) are fairly well estimated.
The sample of quasars described here is not complete in any sense except that it contains all the DLA systems known at the time of writing the HST proposal (cycle 6). For illustration purpose only, we have evaluated the effects of lensing following SCS (exponential model plus Gaussian hole, or E+GH). These theoretical estimates are based on the observed magnitude and emission redshift of the quasar and on the DLA absorber redshift . Would the DLA sample be representative of a well-defined, complete magnitude limited sample, we find that the number density of DLA systems would have been overestimated by 18%. In other words, statistically speaking, one of the quasars in this sample would not have been observed if gravitational lensing was not taking place. In addition, the value of would have been over-estimated by 28%. We also find that the probability that one quasar in the sample presents multiple-imaging would be close to 50%. The values and are used throughout this paper.
2 Lensing properties of the DLA absorbing galaxy/quasar pairs
The observed characteristics of the seven quasar/galaxy pairs are presented in Table 1.
| Quasar name | Type | |||||||
| (″) | ( kpc) | |||||||
| EX 0302223 | 1.400 | 16.5 | 1.0095 | 20.39 | 1.14 | Compact Dwarf | ||
| PKS 0454+039 | 1.345 | 17.6 | 0.8596 | 20.69 | 0.80 | Compact Dwarf | ||
| 3C 196 | 0.871 | 18.7 | 0.4370 | 20.8 | 1.10 | Face-on Giant Spiral | ||
| Q 1209+107 | 2.191 | 18.6 | 0.6295 | 20.2 | 1.62 | Edge-on Spiral | ||
| PKS 1229021 | 1.038 | 17.6 | 0.3950 | 20.75 | 1.40 | Diffuse Dwarf | ||
| 3C 286 | 0.849 | 18.0 | 0.6920 | 21.19 | 0.90 | Irregular | ||
| MC 1331+170 | 2.084 | 16.6 | 0.7446 | 3.86 | Edge-on Bright Spiral |
We present three different methods to evaluate the lensing properties of these seven configurations: (i) a model-independent formalism; (ii) a formalism which assumes a Singular Isothermal Sphere (SIS) lens model, only based on the geometry of the systems (i.e. redshifts of the quasar and the galaxy in each association and their angular separation); (iii) a formalism which assumes a SIS model whose velocity dispersion is determined from the observed luminosity of the DLA galaxies and the Tully-Fisher relation.
The values of the angular impact parameter and absolute luminosity of the absorbing galaxy image were obtained by Le Brun et al. (1997) and Boissé et al. (1998).
No secondary lensed QSO image is detected in any of the systems presented here at more than 0.3″ from the quasar, down to a limiting magnitude of , i.e. 6.8 to 9 magnitudes fainter than the main observed QSO image. The absence of any secondary image either means that the lensing configuration is indeed not capable to produce multiple imaging, or that the apparent luminosity of the secondary image is too faint to be detected, possibly due to extinction by dust.
2.1 (Nearly) model-independent constraints
Subramanian & Cowling (1986) showed that, for a spherical mass distribution, with surface density decreasing from the center to the outer parts, as expected for individual galaxy halos, a sufficient and necessary condition to have multiple images is that the central value is larger than a critical value defined by :
| (1) |
and thus independently of the model chosen for the halo. In this relation, is the speed of light, the gravitational constant, , and the angular-diameter distances between the observer and the source (QSO), the observer and the lens, the lens and the source, respectively. Furthermore, they show that the absence of a secondary lensed QSO image ensures that still for a spherical mass distribution. They conjecture that this result is also valid for centrally peaked elliptical lenses. We therefore conclude that the absence of a secondary QSO image at a separation larger than in our sample ensures that over such an angular scale.
On the other hand, for a lens with circular symmetry, the mean surface density within the Einstein radius is equal to (cf. Schneider, Falco & Ehlers 1992); in addition, the location of the main image is always such that its angular separation from the lensing galaxy . In particular, this relation is true even in the case of multiple images with any secondary image being hidden due to extinction by dust. Consequently, we can derive an upper limit on the projected mass enclosed in a disk of radius centered on the galaxy, as
| (2) |
and thus also on the average M/L ratio within .
No constraint can be set on the amplification of the QSO image.
2.2 SIS lens model with only geometrical constraints
We here assume that the distribution of matter within each galaxy can be described as a singular isothermal sphere (SIS), whose volume mass density is given as a function of the distance to the galaxy center by:
| (3) |
where is the 1-dimensional velocity dispersion of the SIS. As a consequence, the total projected mass enclosed in a disk of radius is
| (4) |
We then compute the angular Einstein radius for each quasar/galaxy configuration, by
| (5) |
In the case of an SIS, the observed images are located at:
| (6) |
where is the true (unobserved) position of the source.
Multiple (double) imaging only occurs for , in which case the separation between the two images is , and their amplification is . If only one image is formed and its amplification is .
Inversely, even in the case of an isothermal sphere with a core-radius, Narayan & Schneider (1990) showed that the condition is sufficient to avoid the formation of multiple images. Using only the geometry of the system, we can set the following constraint on the mass of the DLA galaxy. We successively consider the cases of single and double image systems :
2.2.1 Single image system
2.2.2 Double image system
Suppose now that two images are actually produced by the lens. In order to explain the observations, we have to assume that only the brightest image is detected, while the faintest one is affected by dust extinction by an amount so that its apparent magnitude is fainter than the limiting magnitude of the corresponding WFPC2 observations.
The angular separation between the observed image and the center of the lensing galaxy is such that . Consequently, the total projected mass located within a disk of radius is constrained by :
| (8) |
Let’s define as the difference between the limiting magnitude of the corresponding WFPC2 frame and the magnitude of the main observed QSO image : . We then have the following relations between the amplifications of the two images I and B of the quasar :
| (9) |
where and are the extinction affecting the main and secondary images, respectively.
Since the secondary image can be very close to the center of the deflecting galaxy, it might be extremely extinguished, and thus undectable on our data.
2.2.3 Summary
Only using geometrical quantities with a SIS lens model does not greatly improve the limits based on a model-independent formalism: the value is within a factor of two the upper limit of the mass of a SIS lens only constrained by the angular separation between the lensing galaxy and the quasar, independently of the fact that multiple images exist or not.
2.3 SIS lens model constrained by the Tully-Fisher relation
In this section, we consider one additional piece of information brought by the HST observations: the luminosity of the galaxies considered to be responsible for the DLA absorption.
If we assume that the 1-dimensional velocity dispersion of the SIS is equal to the velocity dispersion of matter in the galaxy , which is related to the maximal value of the rotational velocity of a galaxy by , we can indeed use the Tully-Fisher relation (Tully & Fisher 1977) to derive its value from the galaxy luminosity:
| (10) |
where km s-1, ( is the Hubble constant in units of 100 km s-1 Mpc-1), and ; these values are in accordance with the work by Fukugita & Turner (1991) and SCS. This relation is derived from local galaxies, but most recent studies (see Bershady 1996 for a review) indicate that there is no evolution of the parameters in this relation at intermediate redshifts. Then, even if the value of is known to evolve with redshift (see e.g Lilly et al. 1995), this only indicates an evolution of the density of galaxies of a given luminosity, but not of the relation between the luminosity and the velocity dispersion of a given galaxy.
We can then set an upper limit to the projected mass enclosed in a disk of radius centered on the galaxy, as Eq. 4 becomes
| (11) |
We can also estimate the amplification factor of the quasar apparent luminosity due to gravitational lensing by the galaxy responsible for the DLA absorption, as is derived by inserting in Eq. 5:
| (12) |
The values of and derived for each of the QSO–galaxy association are presented in Table 2. As expected, the inferred mass-to-light ratios , also listed in Table 2, are close to the mass-to-light ratios for spiral and elliptical galaxies at the present epoch estimated by various, classical methods (see Bahcall et al 1997 for a review). This result, discussed further in Section 3.3, ensures us that the values obtained for the amplification factor are probably good estimates.
| ( km s-1) | (″) | (″) | (g cm-2) | ( | ( | () | () | ||
|---|---|---|---|---|---|---|---|---|---|
| EX 0302-223 | |||||||||
| 0.19 | 76 | 0.03 | 1.14 | 1.715 | 99 2 | 2.6 | 393.5 | 10.4 | 1.03 |
| PKS 0454+039 | |||||||||
| 0.27 | 88 | 0.05 | 0.80 | 1.340 | 34 1 | 2.3 | 93.5 | 6.3 | 1.07 |
| 3C 196 | |||||||||
| 1.09 | 149 | 0.26 | 1.10 | 1.128 | 29 1 | 6.6 | 19.5 | 4.6 | 1.30 |
| Q 1209+107 | |||||||||
| 0.83 | 134 | 0.26 | 1.62 | 0.741 | 59 1 | 9.5 | 54 | 8.7 | 1.19 |
| PKS 1229-021 | |||||||||
| 0.06 | 50 | 0.04 | 1.40 | 0.952 | 35 1 | 0.9 | 416 | 10.6 | 1.03 |
| 3C 286 | |||||||||
| 0.33 | 94 | 0.03 | 0.90 | 2.628 | 71 2 | 2.7 | 162 | 6.2 | 1.04 |
| MC 1331+170 | |||||||||
| 2.50 | 205 | 0.53 | 3.86 | 0.794 | 420 2 | 57.3 | 126 | 17.3 | 1.16 |
3 Discussion
3.1 Absence of a secondary image
As can be seen in Table 2, application of the Tully-Fisher relation to the absolute luminosity of the DLA galaxies implies that the impact parameter of the line-of-sight to the QSO never falls within twice the value of the galaxy Einstein radius. Hence, we do not a priori expect any secondary lensed QSO images, which is confirmed by the HST/WFPC2 observations.
However, the total luminosity of the galaxies might be underestimated, because of extinction due to the presence of diffuse dust in the galaxies themselves (self-extinction), especially in the rest-frame band in which our galaxies are observed. Since the Tully–Fisher relation given above in Eq. 10 was determined from a sample of local galaxies whose magnitudes were corrected for self-extinction, even for inclined systems, we are led to use a global extinction.
In particular, a significant self-extinction correction might be applied to a DLA galaxy absolute magnitude if it presents a large inclination. Thus, from the observed values, we can calculate the self-extinction which is necessary to give a real Einstein radius large enough to lead to and the formation of a double image. For four absorbing galaxies, this value of the self-extinction is larger than 3 magnitudes, which we consider to be implausible, given that such values have not been observed in samples dedicated to the study of self-extinction in galaxies (Xu et al. 1997).
For the three remaining galaxies (toward 3C 196, Q 1209+107 and MC 1331+170), the self-extinction necessary to lead to a value of compatible with multiple imaging is smaller, ranging from 1 magnitude for 3C 196 to 1.6 and 1.8 magnitude for the last two. The last two values are comparable to the highest ones detected in the sample of Xu et al. (1997). On the other hand, we consider unlikely that the galaxy responsible for the DLA in the spectrum of 3C 196 is affected by 1 magnitude of self-extinction: the galaxy is seen face-on and its redshift is , so that the F702W band is actually centered at 4900Å in the galaxy rest-frame. Furthermore, the galaxy extent as determined in the F450W image, which roughly corresponds to near UV in the galaxy rest frame, is nearly equal to the one seen in the F702W filter. The self-extinction correction is thus probably small in this object.
In summary, the self-extinction required to produce multiple imaging in these 3 systems are unlikely to be significant. However, they are not unrealistic. Let’s assume, therefore, that multiple imaging is taking place. Consequently, the absence of detected secondary images allows us to provide some constraints on the extinction in these galaxies along the particular lines-of-sight to the QSO images.
Indeed, if multiple imaging is taking place for 3C 196, Q1209+107 and MC1331+170 and if the SIS model is an adequate representation of the matter distribution within the lens, then the observations could reveal two images with a magnitude difference smaller than , where represents each of the three quasars. From Eq. 9, such a situation occurs if
| (13) |
where
| (14) |
The probability of not detecting a secondary image in the system is thus given by
| (15) |
This last relation assumes that the sources are uniformly distributed behind the lenses: we neglect the amplification bias, which tends to select systems with small and, consequently, to strengthen the following conclusion.
The probability of not detecting a secondary image in any of the 3 systems is therefore
| (16) |
which is represented as a solid line in Fig. 1.
We can see that the non-detection hypothesis, i.e. the observations, is ruled out with a confidence level larger than 3 sigma if the differential extinction is smaller than 3.9 magnitudes on each sightline. But an extinction larger than 3.9 mag is only expected in very dense clouds, whose covering factor is very small.

Furthermore, Table 2 shows that the limits on the mass-to-light ratios inferred from lensing and geometrical constraints alone are usually an order of magnitude larger than the ones derived from an application of the Tully-Fisher relation. If a secondary image was hidden due to extinction, it would imply that the mean ratio of galaxies is much higher than previously thought.
For all these reasons, we maintain our conclusion that the observed configurations of DLA absorbers are not likely to give rise to multiple images.
3.2 Biases due to gravitational lensing
A quasar located at an impact parameter slightly larger than the Einstein radius can still have its apparent luminosity increased by a factor A, due to gravitational lensing amplification. Column 10 of Table 2 presents this factor estimated for each of our systems: as one can see, it is always smaller than 0.3 mag., with an average value of 0.12 mag. The values for a Universe are only slightly larger (by 3 to 6%).
As we now have an estimated value for the amplification, instead of estimating statistical lensing effects, we can actually compute lensing effects for each QSO individually. We used the approach of Narayan (1989) to evaluate the excess of quasars close to foreground galaxies. This method takes into account both the amplification bias and the by-pass effect. We point out, however, that it aims at estimating the excess number of quasars in the vicinity of galaxies, not the excess of quasars in the vicinity of galaxies giving rise to DLA systems in quasar absorption spectra. However, we prefer this method due to uncertainties in the determination of the inclination of the galaxies and other observational variables, and because it is good enough for our purpose.
The mean excess of quasars close to the DLA galaxies is found to be equal to a factor for a Universe. Therefore, if these quasars were drawn out of a magnitude limited sample, 14% of the quasars that present a DLA line in their spectrum would have been observed because of gravitational lensing (this calculation should be considered as a mere exercise, as the sample is not complete). This value is close to the 18% obtained by the method described in SCS (cf. Sect. 1).
On the other hand, if these quasars were drawn out of a volume limited sample, the magnification bias would be irrelevant: only the by-pass effect would be acting. In this case, the fact that the observed impact parameters are larger than leads to an underestimate of by about 6%, based on the E+GH model of SCS.
3.3 Comparison of the ratio constraints with other methods
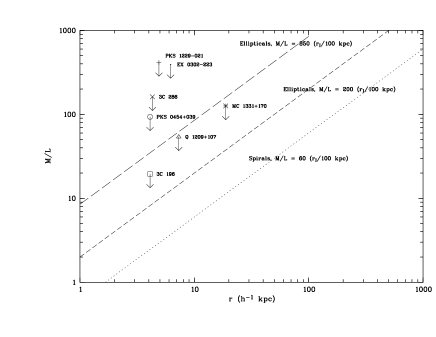
We have plotted in Fig. 2 the upper limits to the model-independant mass-to-light ratios we derive for the seven galaxies. The dotted and dashed lines show the power laws representing the overall mass-to-light ratio in spiral and elliptical galaxies, respectively, as estimated from Bahcall et al. (1995): this review presents recent results obtained on the mass-to-light ratio using the classical methods (H i emission, X-ray emission, motion of dwarf satellites …).
As can be seen, the strongest limits set by gravitational lensing, which are obtained for the three spirals of the sample, are an order of magnitude above the values obtained from other methods. Thus, although they are compatible with other estimations, these observations do not allow to efficiently constrain the value of the hidden mass in the galaxies responsible for the DLAs.
3.4 Future work
We note that the published surveys to determine the cosmological density of neutral hydrogen at have been carried on using samples of quasars that are generally brighter than all the quasars on which the present study is based: only 15% of the quasars in the IUE survey (Lanzetta et al. 1995) have a magnitude fainter than the quasars presented here; half of the Rao et al. (1995) quasars (followed up by Rao & Turnshek (2000)) are brighter than the brightest quasar in our sample, and none are fainter than the faintest quasar in this same sample (some quasars are actually used both in this paper and in Rao et al.’s). These surveys may thus be more strongly affected by the magnification bias than the sample presented here; consequently, the results of this paper should not be interpreted as meaning that lensing effects have negligible effects on surveys of DLAs at .
In order to have a better constraint on the lensing effects in DLA surveys, we have carried a HST-NICMOS survey of 13 bright quasars whose spectra present a DLA system at low redshift, including the sample presented in this paper.
Acknowledgements.
Our research was supported in part by PRODEX (Gravitational lens studies with HST), by contract P4/05 ”P=F4le d’Attraction Interuniversitaire” (OSTC, Belgium), by contract 1994-99 of ”Action de Recherches Concert=E9es” (Communaut=E9 Fran=E7aise, Belgium) and by the ”Fonds National de la Recherc= he Scientifique” (Belgium).References
- (1) Bahcall N.A., Lubin M.L., Dorman V., 1995, ApJ 447, L81
- (2) Bartelmann M., Loeb A., 1996, ApJ 457, 529
- (3) Bartelmann M., Loeb A., 1998, ApJ 503, 48
- (4) Berlind A.A., Quillen A.C., Pogge R.W., Sellgren K., 1997, AJ 114, 107
- (5) Bershady M.A., 1996, The Tully-Fisher Relation at Intermediate redshifts. In Hippelein H., Meisenheimer K., (eds.) Galaxies in the Young Universe, Springer
- (6) Boissé P., Le Brun V., Bergeron J., Deharveng J.-M., 1998, A&A 333, 841
- (7) Fall S.M., Pei Y.C., 1993, ApJ, 402, 479
- (8) Fukugita M, Turner E.L., 1991, MNRAS, 253, 99
- (9) Lanzetta K. M., Wolfe A.M., Turnshek D. A. 1995, ApJ 440, 435
- (10) Le Brun V., Bergeron J., Boissé P., Deharveng J.-M., 1997, A&A 321, 733
- (11) Lilly S. J., Tresse L., Hammer F., Crampton D, Le Fèvre O., 1995, ApJ 455, 108
- (12) Narayan R., Schneider P., 1990, MNRAS 243, 192
- (13) Narayan R., 1989, ApJ 339, L53
- (14) Perna R., Loeb A., Bartelmann M., 1997, ApJ 488, 550
- (15) Rao S.M., Briggs F.H., 1993, ApJ 419, 515
- (16) Rao S. M., Turnshek D. A., Briggs F. H. 1995, ApJ 449, 488
- (17) Rao S. M., Turnshek D. A. 2000, ApJS in press, astro-ph/9909164
- (18) Schneider P., Ehlers J., Falco E.E. 1992, in ‘Gravitational lenses’, Berlin, New York, Springer-Verlag, p493
- (19) Smette A., Claeskens J.-F., Surdej J., 1997, New Astronomy, 2, 53
- (20) Subramanian K.; Cowling S. A., 1986, MNRAS 219, 333
- (21) Tully R.B., Fisher J.R., 1977, A&A 54, 661
- (22) Tully R. B. ,Pierce M.J., et al., 1998, AJ, 115, 2264
- (23) Wolfe A.M., Turnshek D.A., Smith H.E., Cohen R.D, 1986, ApJS 61, 249
- (24) Xu C., Buat V., Boselli A., Gavazzi G., 1997, A&A, 324, 32