Global VLBI Observations of HI Absorption toward NGC 3894
Abstract
One of the most important problems in the study of AGN is understanding the detailed geometry, physics, and evolution of the central engines and their environments. The leading models involve an accretion disk and torus around a central black hole. Much of this torus should be comprised of atomic gas, detectable in absorption toward the bright inner radio jets. In the last few years, a number of compact symmetric radio sources have been found to exhibit Hi absorption, at or near the systemic velocity, toward the central parsecs. Understanding the kinematics of the Hi detected toward the central parsecs of these sources will provide an important test of this model and of unified schemes for AGN.
We present results of Global VLBI Network observations at 1.4 GHz toward the active nucleus of the nearby elliptical galaxy NGC 3894 (a.k.a. 1146+596, =0.01068). The center of activity in this source and the orientation of the jets with respect to our line of sight have been determined using VLBI studies of the proper motions of jet components. The 21 cm atomic hydrogen line is seen in absorption slightly redshifted with respect to the systemic velocity toward the core, jet, and counterjet of this source. The structure of the Hi in this source is complicated. We find several distinct components present along the lines of sight to the approaching and receding jets, making interpretation challenging.
1 Introduction
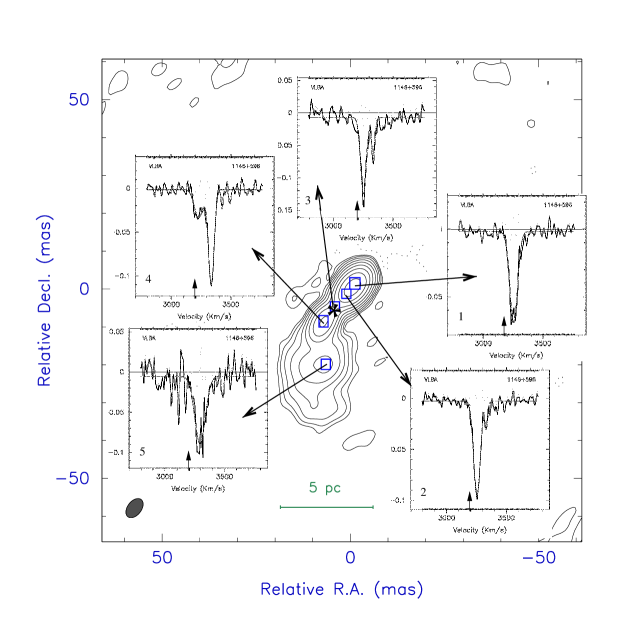
NGC 3894 is an elliptical galaxy at a redshift of =0.01068 (Karachentsev 1980). VLBI studies of the proper motions in the jet components at 8 GHz by Taylor, Wrobel & Vermeulen (1998) indicate that the jets are probably oriented at about 50∘ to the line of sight, with the northwest side being the approaching jet. The core is indicated with an asterisk in Figure 1. The Hi absorption in this source was originally detected by van Gorkom et al (1989), and followup observations were made with the VLBA and phased VLA in 1994. The 1994 observations had an angular resolution of 9 mas and an rms noise of 1.5 mJy/beam/channel (Peck & Taylor 1998). Here we present the preliminary results of more recent Global VLBI observations made in Nov. 1998. In these observations, the angular resolution is 64 mas, corresponding to 1.5 pc (assuming H0=75 km s-1 Mpc-1). The rms noise is 0.3 mJy/beam/channel.
| Profile | Component | Amplitude | Central Vel. | FWHM | NHI | |
|---|---|---|---|---|---|---|
| (mJy) | (km s-1) | (km s-1) | (1020 cm-2) | |||
| 1 | a | 8.80.2 | 3255.01.0 | 78.42.4 | 0.0680.003 | 9.7 |
| 2 | a | 9.90.2 | 3253.50.7 | 64.01.7 | 0.0940.002 | 11.0 |
| b | 2.70.3 | 3332.11.7 | 29.64.1 | 0.0250.003 | 1.3 | |
| 3 | a | 4.20.2 | 3253.01.2 | 57.82.9 | 0.1180.005 | 12.4 |
| b | 2.20.2 | 3334.91.6 | 32.03.8 | 0.0660.006 | 3.9 | |
| 4 | a | 1.60.1 | 3230.83.6 | 87.69.5 | 0.0320.002 | 5.1 |
| b | 5.30.2 | 3335.70.9 | 55.52.1 | 0.1090.003 | 11.0 | |
| 5 | a | 0.80.2 | 3294.43.5 | 104.68.7 | 0.0840.006 | 16.0 |
2 Discussion
Figure 1 shows the integrated Hi absorption profiles toward NGC 3894. Each profile is integrated over 9 pixels in the data, encompassing an area slightly smaller than the beam. The systemic velocity is indicated by the arrows in each panel. The velocity centroid of the absorption in each panel is within 150 km s-1 of the systemic velocity. There are two distinct velocity components toward the central regions of the source, shown in Profiles 2, 3 and 4. In Profiles 1 and 5, the lines are blended and only one Gaussian component could be fit. The parameters determined from Gaussian fits to these components are shown in Table 1. The column density, NHI, was estimated assuming a spin temperature of 100 K and a covering factor of 1. If the gas is associated with a circumnuclear torus, Tspin will probably be much higher. For each panel, the lower velocity, broader component is referred to as Component a in the table.
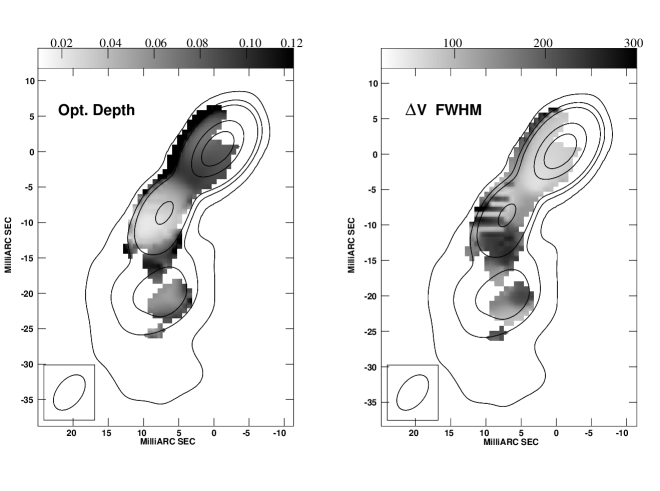
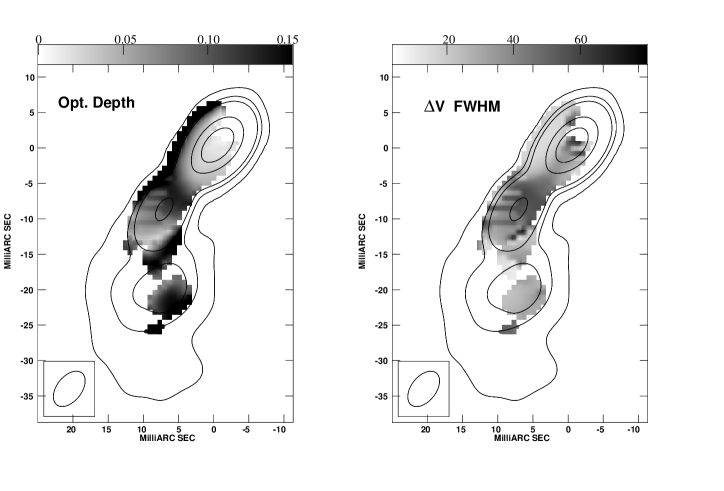
In addition to the integrated profiles shown in Figure 1, two Gaussian components have been fit to the data at each pixel across the source. Pixels in which the signal to noise ratio was less than 2 have been blanked. The results of these fits are shown in Figures 2 and 3. The horizontal lines seen in these images immediately to the east of the secondary continuum peak are due to the algorithm used in the Gaussian fitting program. An initial guess is made for each fit based on the last recorded good fit, resulting in different fits in the presence of blended lines which depend on the direction of rastering in each row. This problem will soon be overcome by making the fit interactively at each pixel. In the meantime, the general trends can still be seen over the rest of the continuum source.
Figure 2 shows the optical depth and FWHM linewidth distributions of the broad Hi line. Although the optical depth is significantly higher toward the approaching jet than the receding jet, the sharp gradient in the region of the core demonstrates that optical depth is sensitive to the location of the nucleus, which would not be the case with a distant foreground cloud. The linewidth peaks south of the core (FWHM275 km s-1), and this peak corresponds to a region of rising optical depth which would be consistent with a line of sight through a long pathlength in a thick torus. Further analysis is required to determine whether the FWHM of the line is as high to the NNE of this region, where the rastering problem has yet to be eliminated. If the FWHM is high in this region, this could be evidence of the central few parsecs of a torus which, in projection, appears to be centered about 1 pc from the core. The lower optical depth in this region then might be attributable to a higher spin temperature in close proximity to the powerful central x-ray source.
Figure 3 shows the optical depth and FWHM linewidth distributions of the narrow line. The FWHM indicates a region of higher velocity dispersion (FWHM60 km s-1) toward the inner receding jet. The optical depth seems to rise toward the core as well. The variations in optical depth further along the receding jet, however, are not consistent with a simple torus model. The absorption features centered on this velocity appear substantially narrower than what we have come to expect from a torus, based on sources like 1946+708 (Peck, Taylor & Conway 1999) and PKS 2322-123 (Taylor et al 1999). The higher velocity with respect to the systemic of this narrow line indicate that the absorption might be due to the presence of disorganized inward streaming gas or multiple infalling clouds along the line of sight.
References
- [van Gorkom et al 1989] van Gorkom, J. H., Knapp, G. R., Ekers, R. D., Ekers, D. D., Laing, R. A. & Polk, K. S. 1989, AJ, 97, 708
- [Karachentsev 1980] Karachentsev, I. D. 1980, ApJS, 44, 137
- [Peck & Taylor 2000] Peck, A. B. & Taylor, G. B. 2000, ApJ, 534, 90.
- [Peck & Taylor 1998] Peck, A. B. & Taylor, G. B. 1998, ApJL, 502, 23.
- [Peck et al 1999] Peck, A. B., Taylor, G. B. & Conway, J. E. 1999, ApJ, 521, 103.
- [Taylor et al 1999] Taylor, G. B., O’Dea, C. P., Peck, A. B. and Koekemoer, A. M 1999, ApJL, 512, 27
- [Taylor et al 1998] Taylor, G. B., Wrobel, J. M., & Vermeulen, R. C. 1998, ApJ, 498, 619