The Normal Cluster Weak Lensing Survey: Mass Profiles and M/L Ratios of Eight Clusters at z=0.2
We present a survey of mass profiles and mass-to-light ratios of eight typical galaxy clusters at a common redshift (). We use weak gravitational lensing as a probe because it is unique in avoiding any assumptions about the dynamical state of the clusters. To avoid bias toward the rare and spectacular clusters that are easy targets for lensing work, we selected an ensemble of much more common clusters with moderate X-ray luminosity. Although the survey is still in progress, two conclusions are emerging: (1) within a cluster, mass follows light very closely on the angular scales that we can measure, Mpc, and (2) there is a significant cluster-to-cluster scatter in mass-to-light (M/L) ratios despite uniformity of observing, reduction, and analysis procedures. We also derive an estimate of based on extrapolation from the mass properties of these typical clusters. Finally, we discuss the discovery of other clusters in our fields through their lensing signal.
1 Motivation and sample selection
Everyone at this conference agrees that cluster masses are important as cosmological probes and as clues to the formation process of clusters and larger structures. Yet most of the work on cluster masses presented here has been based on the assumption that clusters are in hydrostatic or virial equilibrium, while at the same time we have seen many clusters that are clearly not in equilibrium.[1] Gravitational lensing can play an important role here because it is one of the few methods that does not make dynamical assumptions.[2] However, most of the clusters examined with lensing to date have been rare, spectacular clusters, and thus are not representative of clusters in general.
Therefore we are conducting a weak lensing survey of “typical” clusters, which we define here in terms of X-ray luminosity: (0.3—3.0 keV) ergs s-1, or . We imposed three selection criteria based on observing considerations: (i.e., visible from Cerro Tololo Inter-American Observatory [CTIO]), , and no star brighter than lying within a 45′ diameter field centered on the cluster (to minimize the area lost to bright star haloes). Finally, we imposed a redshift cut motivated by the desire for as uniform a sample as possible, at , while retaining clusters. This resulted in the criterion . We applied these criteria to three catalogs: the Extended Medium Sensitivity Survey[3] (EMSS), the Einstein pointed archive[4], and an early version of the Serendipitous High-redshift Archival ROSAT Cluster (SHARC) survey[5] (the two SHARC clusters were not included in their final statistical cluster sample, but were found in the course of the SHARC survey using the methods cited). The resulting eight clusters are listed in Table 1.
| Name | Ref. | (J2000) | z | LX | l | b | |
|---|---|---|---|---|---|---|---|
| MS 0419.0-3848 | 1 | 04:20:45 | -38:42 | 0.23 | 0.3 | 242 | -45 |
| Abell 3364 | 2 | 05:47:34 | -31:53 | 0.16 | 6.5 | 237 | -27 |
| MS 0849.7-0521 | 1 | 08:52:17 | -05:33 | 0.19 | 1.3 | 233 | 24 |
| RX J100150.1-193550 | 3 | 10:01:50 | -19:36 | 0.23∗ | 1.3 | 258 | 28 |
| RX J111512-3807 | 3 | 11:15:12 | -38:07 | 0.19∗ | 0.5 | 283 | 21 |
| MS 1205.7-2921 | 1 | 12:08:20 | -29:38 | 0.17 | 1.0 | 292 | 32 |
| MS 1317.0-2111 | 1 | 13:19:44 | -21:27 | 0.16 | 1.5 | 312 | 41 |
| MS 2307.9-4328 | 1 | 23:10:46 | -43:12 | 0.29 | 1.0 | 348 | -64 |
2 Observations and data reduction
We took deep multicolor images of each cluster at the CTIO’s 4-m Blanco telescope, with the Big Throughput Camera[6] mounted at prime focus. The BTC was designed to eliminate concerns about mass sheet degeneracy with its large field. The camera has a 2 2 array of back-illuminated 20482048-pixel CCDs. With pixels subtending 0.43′′ each and large gaps between the CCDs, the total field of view comes to 35′. We covered the gaps and increased the total field to 45′ with large dithers between exposures. We observed in the photometric system,[7] with at least and coverage on each cluster.
This paper is based on preliminary results from the eight clusters listed. We imaged two additional clusters, Abell 2744 and MS0508.8-4523 (Abell 3322), which fit our criteria, but no results are available for them yet. These two clusters were also re-observed with the Mosaic camera at the same telescope, and will be used to ensure that no instrumental artifacts survive the data processing. We also observed most clusters in and some in Johnson-Cousins for the sake of studying other cluster properties, but the current work considers the and information only. A forthcoming paper[8] presents the observations, lensing results, and comparison with X-ray data and with simulations in great detail; future papers will study the cluster luminosity functions and alignment of cluster members.
The data reduction steps, especially those aspects related to optical distortions and object shape measurement, are essentially the same as that described elsewhere[9] in some detail for “blank” fields observed with the BTC. The main difference is that here, we do not attempt to combine shape measurements from different filters. Since the images are deeper than the other filters, we simply use the shapes from the images. Because these fields are centered on clusters, the analysis diverges from Ref. 9 beginning with the background galaxy selection.
3 Background galaxy selection and lensing analysis
With clusters in the foreground, we make some effort to select background galaxies based on color. The color locus of cluster ellipticals is easily identifiable in the color-magnitude diagram, so we used only galaxies which were significantly bluer in an attempt to eliminate cluster members from the lensing analysis. A uniform criterion was used for all cluster fields. We also imposed a magnitude cut to eliminate foreground objects and objects too faint to measure accurately. We are currently working on estimates of the residual contamination by cluster members.
Given this background galaxy sample, we use the model-independent aperture densitometry method[10] to estimate the mass. In discrete form, the crucial equation relating the galaxy shapes to the mean surface mass density inside a given radius, minus the mean surface density in a control annulus outside that radius is[11]:
| (1) |
Here is the lensing critical density, is the tangential ellipticity of the th background galaxy corrected for seeing effects,[12] is the projected distance from that galaxy to the center of the mass distribution, g() is a weighting function, and N is the number of background galaxies in the annulus . We found the center of the mass distribution from two-dimensional maps built up by repeatedly applying a similar equation over a grid in x and y. In most cases this coincided with the brightest cluster galaxy and the center of the X-ray emission, but in a few cases it was displaced by up to 1′ from the X-ray center. depends on the source redshift distribution and was calibrated for Abell 3364 by simulations with full 3-dimensional ray tracing from model galaxies with a redshift and morphology distribution consistent with the Hubble Deep Field and recent Keck spectroscopy. These simulations were in turn checked against mass densitometry of clusters with known mass.
To obtain a comparable estimate of luminosity surface density, we also measured the total light overdensity in band (with no color selection of objects) in the same successive apertures, with respect to the same control annulus. band in the observed frame is very nearly band in the rest frame, so we will quote M/L in rest-frame .
4 Mass and M/L ratios
Cluster masses and M/L ratios within 1 Mpc are summarized in Table 2. The 1 Mpc radius was chosen to give reasonable signal-to-noise even for the least massive clusters in the sample. The separation between low M/L and high M/L clusters is roughly three times the measurement error. While a cluster-to-cluster scatter in M/L has been seen in the literature,[2] it is not clear whether the differences in the literature are entirely real or may be due in part to the widely varied approaches to selection and analysis. Here an ensemble of clusters of similar X-ray luminosity, observed and analyzed in a uniform way, shows similar scatter, strengthening the case for real differences in M/L from cluster to cluster.
| Name | Mass () | M/L () |
|---|---|---|
| MS 0419.0-3848 | 1.1 0.4 | 160 60 |
| Abell 3364 | 3.4 0.4 | 230 30 |
| MS 0849.7-0521 | 2.9 0.5 | 350 60 |
| RX J100150.1-193550 | 2.5 0.4 | 340 55 |
| RX J111512-3807 | 1.5 0.5 | 180 60 |
| MS 1205.7-2921 | 2.0 0.6 | 300 90 |
| MS 1317.0-2111 | 1.2 0.4 | 380 130 |
| MS 2307.9-4328 | 2.3 0.6 | 420 110 |
What might cause real differences in M/L? It has been argued[13] that because the highest overdensities collapsed first, they now have the oldest populations and therefore the highest M/L. The highest initial overdensities should now be the most massive clusters, so that the clusters with higher M/L should also tend to be more massive. We face two problems in testing for this effect. First, our clusters were selected to lie in a narrow range of X-ray luminosity and therefore presumably in a narrow mass range. Second, the effect of passive luminosity evolution is fairly small, while our errors in the masses are about 20%. There is a hint that the more massive clusters in Table 2 have higher M/L, but no conclusion can be reached given the large error bars. A sample including both massive and low-mass clusters should be able to answer this question definitively. We note that our clusters do fall nicely on a curve of enclosed M/L versus radius for all types of systems.[13]
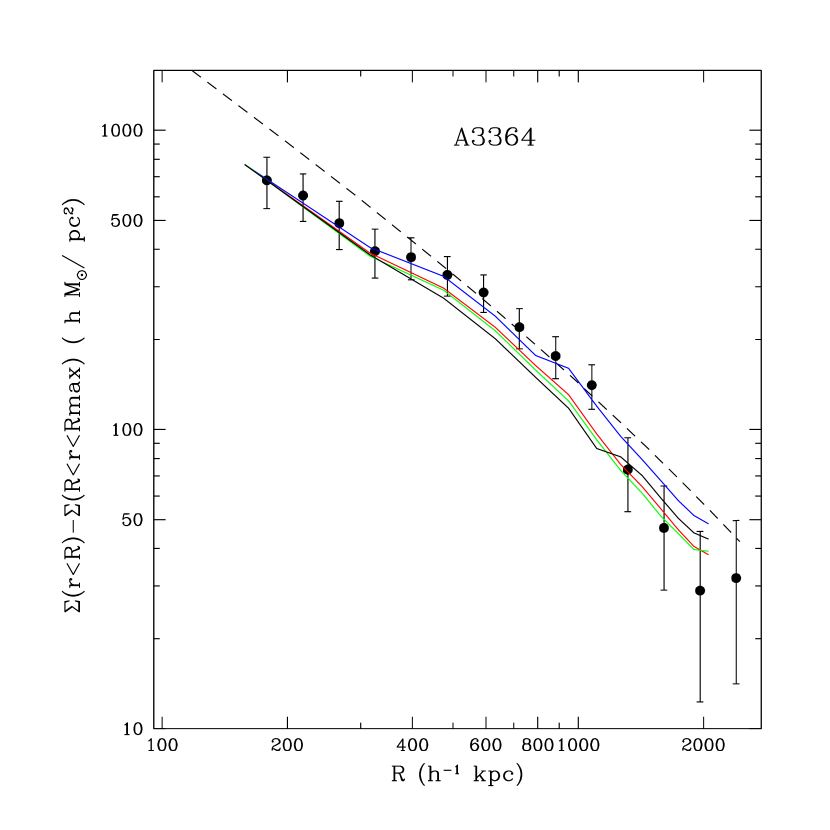
Figure 1 shows the mean mass and light profiles of Abell 3364. The other clusters have similar profiles but generally have lower signal-to-noise. Mass drops more steeply than isothermal at Mpc (the apparent rise in the outermost point may be due to systematic errors from the point-spread function at this very low level of shear). In these normal clusters, mass follows light surprisingly well on all scales to which this technique is sensitive, out to at least 2 Mpc; there is no evidence for an increase in M/L in cluster outskirts. This lends some legitimacy to extrapolating to lower density environments since the mass and light for these normal clusters are followed out to unprecedented small values: M⊙ pc-2 mass density, and L⊙ pc-2, factors of 1000 and 10,000 smaller than customarily encountered in the rich clusters studied in the past.
5 Estimate of
There are two ways to extrapolate from cluster mass information to , the mean mass density of the universe as a fraction of the critical density. Both methods assume that clusters are a fair sample of the universe, so we must use some caution in interpreting the results. However, such an assumption is more plausible with this sample of typical clusters than with previous samples which have been based on a few very rich clusters.
One method can be applied immediately: if the cluster M/L holds for the universe in general, we can simply scale the cluster M/L by the local luminosity density, which is well known, and obtain the local mass density. In practice we scale the local luminosity density back to z=0.2 using the recent luminosity evolution of galaxies.[14] Our result is , but we caution that the true uncertainty lies in the M/L fair sample hypothesis rather than in the statistical error given. The previous section has shown that mass is indeed well-correlated with light in the typical cluster environment, but extremely low-density environments presumably emit less than their share of light, so this might be considered a lower limit on .
The second method will be applied in the near future: if the cluster baryon fraction holds for the universe in general, we can simply divide by this fraction to obtain . , the mean density of baryons in the universe, is well constrained by Big Bang nucleosynthesis and so does not introduce great uncertainty into the result. However, this is generally considered an upper limit to because any census of baryons in a cluster is likely to miss baryons (in currently undetectable forms such as black holes, planets, etc.) rather than overestimate them. We don’t have any cluster baryon fraction measurements as yet, but soon the combination of Sunyaev-Zel’dovich effect measurements and lensing[15] will provide these. For now we simply note that values in the literature yield , which as an upper limit is a nice complement to our value derived from luminosity scaling.
6 Shear-selected clusters
In the two-dimensional mass maps of the cluster fields, we found significant additional mass clumps apart from the target clusters. The density of these objects is roughly 4-7 deg-2. In many cases, moderately bright galaxies can be seen clumped in these areas, indicating the possible presence of a cluster or group. In other cases, there is no obvious optical counterpart. We followed up several of the cluster candidates with CTIO 4-m spectroscopy, and confirmed that each is a cluster with a well-defined redshift, not a chance projection. In no case are they associated with the target cluster, but they have the same general range in redshift, which is not surprising considering that the background galaxy selection did not vary. These discoveries are an important step toward a shear-selected sample of clusters and will be described in a forthcoming paper.
7 Summary
Our weak gravitational lensing survey of ten clusters is still in progress, but several conclusions are emerging. We find a significant cluster-to-cluster scatter in M/L, despite uniform observing, reduction, and analysis procedures. Mass follows light very closely on scales from kpc (our resolution limit) to at least 2 Mpc (the limit of our field size), and to unprecedentedly low projected mass and light surface densities. This gives us some confidence in extrapolating to even larger scales. If the M/L of these clusters is representative of the universe, we can scale by the local luminosity density to get 0.2. In the near future, cluster baryon fractions will be available from lensing plus Sunyaev-Zel’dovich effect measurements[15], providing an estimate of from baryon scaling arguments. The two scaling arguments really provide lower and upper limits respectively; together they will bracket if these “normal” clusters are a fair sample with respect to M/L and baryon fraction.
The 45′ fields are large enough to include several several serendipitous clusters, but more importantly we discovered them on the basis of shear alone. This demonstrates the feasibility of a shear-selected sample of clusters, which would be immensely valuable in determining the cluster mass function and avoiding the biases toward emitted light which have always accompanied the study of clusters. Several surveys with this goal are already underway.
Acknowledgments
We thank Alistair Walker, John Filhaber, David Rojas, Steve Heathcote, and the staff at CTIO for their help in making the and 4-m Blanco telescope system work in an optimal way and for their continued support. Thanks also to Bob Lee, Morley Blouke, and Pat Waddell for their engineering help on the BTC project. Initial development of the BTC was partially funded by NSF SBIR grant AST86-17058 to Lassen Research.
References
- [1] Sarazin, C., these proceedings (astro-ph/0009094) (2000)
- [2] Mellier, Y., ARAA 37, 127 (1999)
- [3] Gioia, I. M., Maccacaro, T., Schild, R. E., Wolter, A., Stocke, J. T., Morris, S. L. and Henry, J. P., ApJS 72, 567 (1990)
- [4] Harris, D. E. et al., The Einstein Observatory catalog of IPC X ray sources (1993)
- [5] Romer, A. K. et al., ApJS 126, 209 (2000)
- [6] Wittman, D., Tyson, J. A., Bernstein, G. M., Lee, R. W., Dell’Antonio, I. P., Fischer, P., Smith, D. R., and Blouke, M. M., Proc. SPIE 3355, 626 (1998)
- [7] Gullixson, C. A., Boeshaar, P. C., Tyson, J. A., and Seitzer, P., ApJS 99, 281 (1995)
- [8] Dell’Antonio, I. et al., in preparation (2001)
- [9] Wittman, D., Tyson, J. A., Kirkman, D., Dell’Antonio, I., and Bernstein, G., Nature 405, 143 (2000)
- [10] Fahlman, G., Kaiser, N., Squires, G., and Woods, D., ApJ 437, 56 (1994)
- [11] Fischer, P. and Tyson, J. A., AJ 114, 14 (1997)
- [12] Miralda-Escudé, J., in Proc. IAU 173, Astrophysical Applications of Gravitational Lenses, C. Kochanek and J. Hewitt, eds. (Kluwer: 1996)
- [13] Bahcall, N., Cen, R., Davé, R., Ostriker, J. P., and Yu, Q., ApJ 541, in press (astro-ph/0002310) (2000)
- [14] Madau, P. Physica Scripta, T 85, 156 (astro-ph/9902228) (2000)
- [15] Holder, G. et al., these proceedings (2000)