Secular Evolution of the Galactic Disk
Abstract
In the solar-neighbourhood, older stars have larger random velocities than younger ones. It is argued that the increase in velocity dispersion with time is predominantly a gradual process rather than one induced by discrete events such as minor mergers. Ephemeral spiral arms seem to be the fundamental drivers of disk heating, although scattering by giant molecular clouds plays an important moderating role. In addition to heating the disk, spiral arms cause stars’ guiding centres to diffuse radially. The speed of this diffusion is currently controversial.
Data from the Hipparcos satellite has made it clear that the Galaxy is by no means in a steady state. This development enormously increases the complexity of the models required to account for the data. There are preliminary indications that we see in the local phase-space distribution the dynamical footprints of long-dissolved spiral waves.
Oxford University, Theoretical Physics, Keble Road, Oxford, OX1 3NP, U.K.
1. Introduction
It is now half a century since Roman (1950) and Parenago (1950) discovered that the kinematic properties of stars near the Sun are strongly correlated with spectral type. The theory of stellar evolution soon showed that the sense of this correlation was that older stellar groups have larger velocity dispersions and asymmetric drifts than younger groups. There are two generic explanations for this phenomenon. In one picture the turbulent velocities in the gas from which stars form has declined steadily since the Galaxy started to form, and the current random velocities of stars are fossil records of the turbulent velocities at the moment of their formation. This picture, which inspired the classic paper of Eggen Lynden-Bell & Sandage (1962), is now not widely favoured, although it still has proponents (e.g., Burkert, Truran & Hensler, 1992). In the other picture the random velocities of stars are small () at birth and increase with time. Whether this increase is continuous or episodic in nature is currently being debated.

2. The Age Velocity-Dispersion Relation
Fig. 1 is a plot of the random velocity on the sky, , of a kinematically unbiased sample of stars in the Hipparcos Catalogue that have good parallaxes. As one proceeds from blue to red stars, rises steadily until one reaches , where it abruptly levels off. For , gently declines. The abrupt change in slope at is called Parenago’s discontinuity, and the natural interpretation of this phenomenon is this. Bluewards of the discontinuity stars have main-sequence lifetimes shorter than the age of the solar neighbourhood, , while redwards of it lifetimes exceed . Consequently, any tendency of the velocity dispersion of a stellar group to increase over time will cause to increase with at because in this range the age of the oldest stars contributing to increases with . Conversely, should be independent of redward of the discontinuity.
Binney, Dehnen & Bertelli (2000; BDB) show that the structure of Fig. 1 can be accurately reproduced if the velocity dispersion of a stellar group increases with age as . Interestingly, their models reproduce the decline in at the reddest colours, which is not predicted by the simple considerations of the last paragraph. The origin of this decline is a change in the age distribution with colour that arises because near the oldest stars are turning off the ZAMS, with the result that a magnitude-limited sample of stars is biased towards these stars. At significantly redder , even the oldest stars are still close to the ZAMS, and the sample contains a fair sample of all the stars ever formed.
The BDB fits to Fig. 1 formally require the age of the solar neighbourhood to be , which is older than current cosmological fashions lead one to expect. In fact, BDB show that the structure of Fig. 1 can be even better reproduced if one adopts an age . What makes such young ages unacceptable is the distribution of stars within the sample over colour: models with are deficient in red stars. Since the selection function of the sample is not precisely defined, this objection may not be serious. A more serious objection may be that young ages require rather flat slopes of the IMF: whereas requires a slope that is indistinguishable from Salpeter’s slope (2.35), requires .
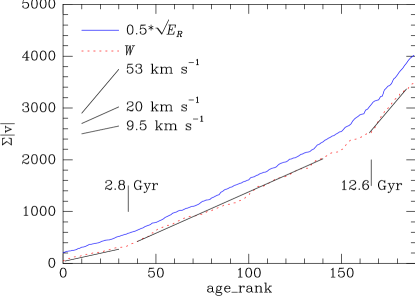
Fig. 1 is based on over stars but its interpretation requires considerable modelling. We can obtain less model-dependent information about the age-velocity dispersion relation by examining much smaller samples of stars for which individual age estimates are available. Fig. 2 is for the data set that is currently the best available, namely the 189 F stars which Edvardsson et al. (1993) observed in great detail. The stars have been ordered by age and the vertical axis shows the sum of the speeds of the stars that are younger than the star of a given rank, which is plotted horizontally. If the speeds of stars were drawn from a single Gaussian of dispersion , regardless of rank, would on average increase with rank as . Freeman (1991) pointed out that the curve in Fig. 2 appears to have three linear sections, with slopes that correspond to , and .111Actually, Freeman gave the highest velocity dispersion as , but this appears to be an error. Thus, the suggestion is that the vertical velocity dispersion of stars increases from to on a timescale , and is then constant at . The oldest stars () form the thick disk and have significantly larger velocity dispersions. The abrupt increase in velocity dispersion from to could well have occurred when a low-mass satellite swept through the disk in the manner described by Quinn & Goodman (1986). Quillen & Garnett (2000) have reaffirmed these conclusions after reanalyzing the Edvardsson et al. sample using Hipparcos parallaxes and up to date stellar-evolution models. The up-to-date stellar ages bring down to the age at which the velocity dispersion rises to .
This picture is an intriguing one that merits careful consideration, but one does have to be cautious because the sample is small and not unbiased. Moreover, when one attempts to model the data of Fig. 1 under the assumption that the velocity dispersion increases smoothly up to an age of or and then jumps to a constant final value, one finds that the best fitting model has a negligible discontinuity in velocity dispersion. For example, if the jump is assumed to occur at , drops from to at that time. The large Hipparcos sample simply does not support the implication of the Edvardsson sample that the velocity dispersion changes abruptly. I shall henceforth assume that velocity dispersion increases continuously over time.
3. Heating mechanisms
Stellar disks are fragile objects because their distribution functions crowd all stars into a low-dimensional structure in phase space. Any perturbation is liable to increase the disk’s entropy by scattering stars out into the body of phase space. It is worth noting that the perturber does not need to supply energy; all it has to do is to scatter stars onto more eccentric orbits and/or orbits that are inclined to the disk’s equatorial plane.
Spitzer & Schwarzschild (1953) suggested that stars were scattered by gas clouds. This was a visionary proposal because clouds of sufficient mass and compactness would not be discovered for 20 years. When the Galaxy was studied in the mm line of CO, the existence of giant molecular clouds (GMCs) with the predicted masses was established, and it was widely assumed that GMCs were responsible for heating the disk. Lacey (1984) cast doubt on this conclusion for two reasons. First, he showed that GMCs rapidly established a characteristic ratio between the vertical and radial velocity dispersions, whereas the observed ratio is significantly smaller: (Dehnen & Binney, 1998). Second, Lacey showed that the efficiency of heating by GMCs declines in time more rapidly than had been thought, with the result that GMCs cannot accelerate stars to the largest observed dispersions.
The slowing of acceleration by GMCs with increasing velocity dispersion is easy to understand. There are two aspects. First the cross-section to Coulomb scattering through a given angle of stars by Clouds falls off with encounter speed as . Second, the GMCs are confined to a thin sheet, in which stars spend less and less time as their random velocities increase. In the idealized two-dimensional scattering problem considered by Spitzer & Schwarzschild (1953), clouds increase the stellar velocity dispersion as , with . When motions perpendicular to the plane are included, one finds in the case that the vertical oscillations of stars are harmonic. In the more realistic case of anharmonic vertical oscillations, a still smaller value of is appropriate (Jenkins, 1992).
Sellwood & Carlberg (1984) revived the proposal of Barbanis & Woltjer (1967) that spiral arms heat the disk. Lynden-Bell & Kalnajs (1972) had shown that a wave heats only those stars that resonate with it. Hence to heat the entire disk one needs either a wave whose frequency sweeps over a wide range, or many transient waves. Numerical simulations by Sellwood and others (Sellwood & Carlberg 1984; Sellwood & Kahn, 1991) show that stellar disks are indeed rife with such features.
Spiral arms excite random motions parallel to the plane, but not vertical oscillations. Hence, one is led to a composite picture in which spiral arms increase the in-plane dispersions, and GMCs divert the in-plane motion into vertical oscillations. Binney & Lacey (1988) established a formalism within which the two mechanisms could be combined. They focused on the distribution of stars in the integral space whose coordinates are epicycle energy, , and energy of vertical oscillation, . These quantities are intimately connected with the radial and vertical actions and – in the epicycle approximation we have and , where is the usual epicycle frequency and is the angular frequency of vertical oscillations. If we assume that the drift of stars through integral space is driven by large numbers of small and statistically independent disturbances, the evolution of the phase-space density of stars, , can be found by solving the Fokker-Planck equation
| (1) |
where the diffusion tensor, , is the expectation of the product of the changes in and per unit time and can be evaluated if one knows the statistical characteristics of the disk’s gravitational potential.
As Lacey (1984) showed, clouds have a strong tendency to establish an equilibrium between oscillations parallel to the plane and vertical oscillations, while waves only excite oscillations parallel to the plane. Consequently, the relative effectiveness of clouds and waves can be gauged from the degree to which the observed ratio deviates from the clouds’ equilibrium value. Jenkins & Binney (1990) used this idea to estimate the relative magnitudes of the contributions of clouds and waves to the diffusion tensor. They found that waves are strongly dominant:
| (2) |
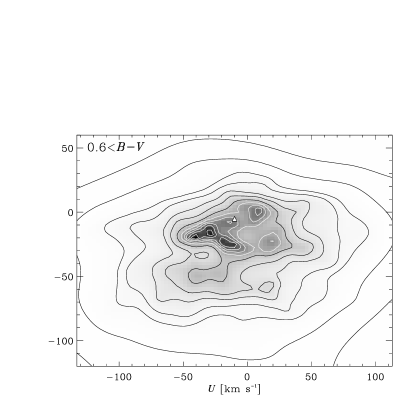
While the jury is still out on this question, the preliminary indications are that this conclusion is confirmed in that the dynamical footprints of spiral arms may be visible in the velocity-space distribution of stars near the Sun that has been deduced from Hipparcos data. Fig. 3 shows, from the work of Dehnen (1998), the projection onto the plane of the velocity-space density of stars that are redder than Parenago’s discontinuity. Even though the stars in question are mostly more than old, many local density maxima are apparent and the outer contours are far from elliptical. Dehnen demonstrates that these features are real rather than reflections of statistical uncertainty.
If were a function of actions only, as the distribution function of a steady-state galaxy should be (Jeans’ theorem), the density of stars in Fig. 3 would be constant on the ellipses of constant .222The stars upon which Fig. 3 is based lie up to from the Sun, and in the formula for we ought strictly to use not but the velocity of the star relative to its own LSR, which differs from that of the Sun by , where is Oort’s constant. This correction typically amounts to less than , however. From the fact that the stellar density in Fig. 3 varies markedly around these ellipses, it is clear that depends on angle variables as well as actions, and that the Galaxy is not in a steady state.
In the bottom left-hand corner of Fig. 3 there is a long peninsula of high density that reaches out to . Raboud et al. (1998) and Dehnen (2000) argue that this feature is generated by the Galactic bar, which places stars on highly eccentric orbits that pass the Sun as they move outwards in their approach to apocentre. Some of the fine-scale structure closer to the LSR (marked by a small triangle) is associated with star clusters such as the Hyades, but it seems unlikely that all structure can be explained in this way. De Simone & Tremaine (2000) suggest that much of this structure is generated by spiral arms. They calculated the final star density in the plane when a series of externally imposed and uncorrelated spiral waves acted on an initially cool stellar disk. Their densities show local density maxima just as Fig. 3 does, but they have more maxima than the observational plot does. It is unclear whether this excess reflects inadequate resolution in the observational data, or weaknesses in the simulations’ spiral arms.
4. Radial migration
When a star is scattered, whether by spiral arms or by molecular clouds, it is liable to change its angular momentum, , about the Galaxy’s vertical axis, as well as its radial and vertical actions. The guiding centre of a star’s orbit is just , so changes in are directly associated with radial migration. Radial migration can in principle be detected because there is a metallicity gradient within the disk (Wielen, Fuchs & Dettbarn 1996; WFD). In fact, it is widely believed that all interstellar material at a given time and radius has a common metallicity (Edmunds, 1998). By contrast, we know from the work of Edvardsson et al. (1993) that there is considerable scatter in the metallicities of stars that have a common guiding centre and age. Does this scatter arise because these stars were born at different radii, where interstellar gas had different metallicities at their common time of formation?
In this context the Sun, which is currently near pericentre, so its guiding centre lies outside , provides an interesting case study. It is more metal-rich than the local average for stars of its age by dex, and more metal-rich than gas in the local Orion star-forming region by dex. These observations are remarkable, given that the mean metallicity of both the stellar and gaseous disks decrease outwards and one usually imagines that the metallicity of the ISM tends to increase over time,333In the presence of accretion, there is no guarantee that will increase with time at a given radius. so the local ISM should have been even more metal-poor than Orion ago, when the Sun formed. WFD ask, at what radius did the ISM have metallicity when the Sun formed, and could the Sun’s guiding centre have migrated from that radius to its present location as a result of a series of uncorrelated scattering events? They conclude that the Sun formed at and its guiding centre has since migrated outwards to .
De Simone & Tremaine (2000) have calculated the extent of radial migration in their simulations of star-wave scattering and obtain an answer, , that is smaller than that derived by WFD. Unfortunately, there is no guarantee that the spiral features simulated by De Simone & Tremaine were sufficiently realistic.
5. Conclusions
Jeans’ theorem simplifies galactic dynamics greatly because it requires the distribution function of a steady-state galaxy to be a function of only three rather than six variables. This simplicity is so alluring that one tries to imagine the Galaxy as slowly moving from one steady state to another. An orbit-averaged Fokker-Planck equation describes this evolution, and has proved reasonably successful in accounting for the dependence upon age of measures of the kinematics of stars such as velocity dispersions and asymmetric drifts. Moreover, an orbit-averaged Fokker-Planck equation provides a unified framework in which to discuss the effects of ephemeral spiral arms and GMCs, which act together to drive the observed evolution of the solar neighbourhood.
Ephemeral spiral arms steadily drive upwards the radial and tangential components of the velocity-dispersion tensor, while GMCs deflect stars out of the plane, so that increases roughly in step with , although not so fast that equilibrium is established between these two dispersions. The guiding centres of stars gradually diffuse in radius, although the distance typically travelled is currently controversial: estimates range from up to .
When the phase-space distribution of stars is examined in detail one finds that there is a great deal more structure than can be described within the context of Jeans’ theorem and an orbit-averaged Fokker-Planck equation. Evidently, the Galaxy is significantly displaced from a steady state.
At one level this discovery is a disappointment, since it enormously increases the complexity of the models required to account for the data. At another level it is a tremendous opportunity to learn more about the structure and the history of the Galaxy. We should seize this opportunity with both hands because we will probably never have comparably rich data for any other Galaxy. As yet there is no complete interpretation of the fine-scale structure seen in the local phase-space density, but there is a strong case that some of it reflects the existence of the Galactic bar, and a weaker case that other structure is generated by the spiral waves that dominate the heating of the disk.
Acknowledgments
I thank S.D. Tremaine for communicating work prior to publication and the University of Washington for its hospitality during the writing of this article. This work was supported in part by NSF grant AST-9979891.
References
Barbanis, B., & Woltjer, L., 1967, ApJ, 150, 461
Binney, J., Dehnen, W. & Bertelli, G., 2000, MNRAS, 318, 658 (BDB)
Binney, J., & Lacey, C., 1988, MNRAS, 230, 597
Burkert, A., Truran, J.W., & Hensler, G., 1992, ApJ, 391, 651
Carlberg, R.G., & Sellwood, J.A., 1987, ApJ, 322, 59
Dehnen, W., 1998, AJ, 115, 2384
Dehnen, W., 2000, AJ, 119, 800
Dehnen, W., & Binney, J.J., 1998, MNRAS, 298, 387
De Simone, R., & Tremaine, S.D., 2000, in preparation
Edmunds, M.G., 1998, in ‘Abundance Profiles: Diagnostic Tools for Galaxy History’, ASP Conf. Ser. Vol. 147, eds D. Friedli, M. Edmunds, C. Robert & L. Drissen, p. 147
Edvardsson B., Andersen B., Gustafsson B., Lambert D.L., Nissen P.E., & Tomkin J., 1993, A&A, 275, 101
Eggen, O.J., Lynden-Bell, D., & Sandage, A.R., 1962, ApJ, 136, 748
Freeman, K.C., 1991, in ‘Dynamics of Disc Galaxies’, ed. B. Sundelius (Göteborg: Chalmers University) p. 15
Jenkins, A., 1992, MNRAS, 257, 620
Jenkins, A., & Binney, J., 1990, MNRAS, 245, 305
Lacey, C.G., 1984, MNRAS, 208, 687
Lynden-Bell, D., & Kalnajs, A., 1972, MNRAS, 157, 1
Parenago P.P., 1950, Astron.Z., USSR, 27, 150
Quillen, A.C., & Garnett, D.R., 2000, astro-ph/0004210
Quinn, P.J., & Goodman, J., 1986, ApJ, 309, 472
Raboud, D., Grenon, M., Martinet, L., Fux, R., & Udry, S., 1998, A&A, 335, L61
Roman N.G., 1950, ApJ, 112, 554
Sellwood, J.A., & Carlberg, R.G., 1984, ApJ, 282, 61
Sellwood, J.A., & Kahn, F.D., 1991, MNRAS, 250, 278
Spitzer, L., & Schwarzschild, M., 1953, ApJ, 118, 106
Wielen R., Fuchs B., & Dettbarn C., 1996, A&A, 314, 438 (WFD)