Doppler Tomography of Dwarf Nova IY UMa during Quiescence
11institutetext: Department of Physics and Astronomy, The Open University, Walton Hall,
Milton Keynes, MK7 6AA, UK
22institutetext: Nordic Optical Telescope, Roque de Los Muchachos & Santa Cruz de La Palma,
Canary Islands, Spain
Doppler Tomography of Dwarf Nova IY UMa during Quiescence
Abstract
Quiescent Doppler tomography of the newly discovered deeply-eclipsing SU UMa system IY UMa reveals properties of the region where the accretion stream from the donor impacts the edge of the disc. A very strong bright spot is produced and the Keplerian disc emission in the impact region is disrupted or obscured. The differing properties of H, H and He I emission will allow physical parameters of the converging flow region to be studied.
1 Introduction

IY UMa was observed for the first time with a superoutburst in January 2000 identifying it as a SU UMa type dwarf nova cataclysmic variable uemura with orbital period 1.77 hours. It exhibits deep eclipses, with the eclipse of the white dwarf and the stream-disc impact region being clearly identifiable in quiescence (Fig. 1); this behaviour is similar to that of the other eclipsing SU UMa systems OY Car schoembs and Z Cha wood1 .
The orbital parameters have been estimated patt as , and inclination .
2 Spectroscopy
2.1 Observations
We obtained 3 orbits of coverage on 19th March 2000 using ALFOSC on the Nordic Optical Telescope in La Palma. There are 80 spectra with resolution 4Å covering wavelength range 3900Å to 6850Å.

2.2 Average Spectra
Figure 2 shows average spectra covering different sections of the orbit. The top spectrum (a) is out of eclipse data; the middle spectrum includes phases where the disc is eclipsed but the white dwarf is not; (c) is the average during white dwarf eclipse. The spectra show double-peaked Balmer, He I and Fe II emission, the double-peaked structure signalling that this emission comes from the accretion disc. There are also strong broad Balmer absorption wings in H, H and H in spectra (a) and (b) which only disappear during white dwarf eclipse (c), telling us that these features come from close to the white dwarf, if not from the white dwarf itself. There is also deep core absorption clearly seen in H, He I and Fe II. These features are almost identical to those seen in OY Car hessman . Z Cha also shows very similar features in quiescence mhs .
2.3 Systemic Velocity
The radial velocity of the H line was measured for each spectrum by fitting a double gaussian profile and using the velocity of the midpoint. A sinusoid of the form was fitted to those velocities outside eclipse. We obtain systemic velocity km s-1, velocity amplitude km s-1 and . The large phase shift, relative to white dwarf mid-eclipse, tells us that the emission does not follow the motion of the white dwarf and so cannot be treated as the white dwarf velocity. This phase shift is the same as that seen in the unusual dwarf nova WZ Sge skid2 and also similar to those in SU UMa systems OY Car (measurements summarized in hessman ) and Z Cha mhs . Similar phase shifts are seen in quiescent low mass X-ray transients e.g. V616 Mon haswell .
2.4 Trailed Spectra
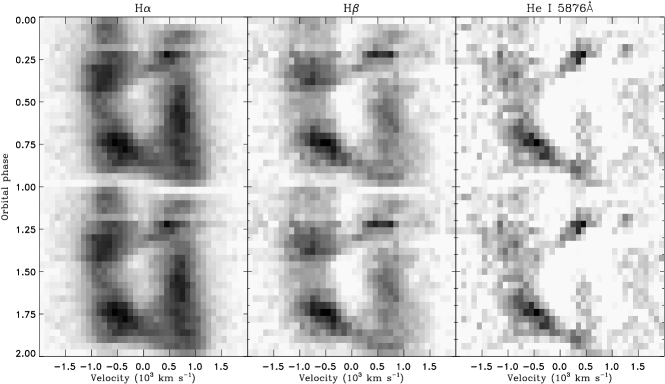
In Fig. 3 we show trailed spectra of H, H and He I 5876Å. In all three lines we see the eclipse beginning in the blue and ending in the red as first the side of the disc coming towards us and then the side of the disc moving away is occulted by the donor star. In H we clearly see the double-peaked emission component from the disc, with average peak-peak separation in the phase range 0.4–0.6 (where the bright spot is on the far side of the disc and so will have minimal effect on the measurement) of 1440 km s-1 corresponding to a radius of assuming a Keplerian velocity field ( is the orbital separation). There is also a strong S-wave component corresponding to a localized region of emission. The S-wave is weakest around orbital phase 0.5. The structure in H is very similar, except that the disc emission is fainter compared to the S-wave. He I shows very little evidence of disc emission, but again exhibits a strong S-wave which is weakest around phase 0.5. Without the complication of the disc component, we see that the brightness of the S-wave closely follows the orbital hump in the continuum lightcurve. The He I emission reveals that the eclipse of the S-wave is late, placing it in the correct region of the disc to be the stream-disc impact region. The strong low velocity absorption is present.
2.5 Doppler Maps
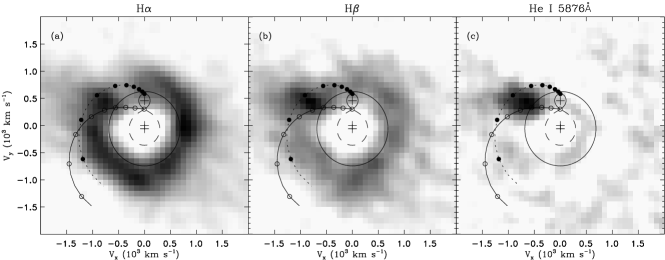
We used the Fourier-filtered back-projection method marshhorne to obtain maps of the velocity-space distribution of emission in each line, shown in Fig. 4. Only out-of-eclipse spectra were used to generate the Doppler maps, since occultation by the donor star violates a core assumption of the Doppler tomography method, which assumes that all regions have the same visibility at all orbital phases.
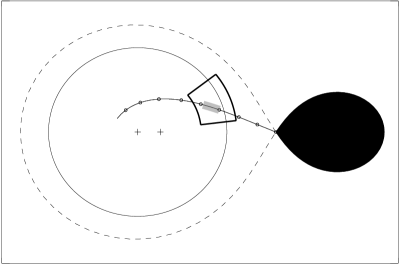
The H map (Fig. 4a) shows a ring of disc emission with Keplerian velocities corresponding to locations within the tidal radius. The stream-disc impact should be seen between the two arcs corresponding to the stream trajectory and its Keplerian velocity in the top left of the map, but there is no significantly brighter region here in the H map. The disc emission just to the left of the donor star is very much weaker than elsewhere. Assuming a Keplerian velocity field, this corresponds to weaker emission from the region of the disc marked with a thick black outline in Fig. 5, and is coincident with the stream-disc impact. We do not expect a Keplerian velocity field where the stream and disc merge, and any underlying Keplerian emission could be obscured by an optically thick region around the impact. It is therefore no surprise that we see weaker disc emission in this velocity region. At low velocities (less than 500 km s-1) we see strong absorption. This absorption is of similar strength to the disc emission.
The H map (Fig. 4b) again shows the Keplerian emission from the disc and the strong low-velocity absorption. Most notable, however, is the bright spot located exactly where we expect to see the stream-disc impact. Combined with spatial information provided by the late eclipse of the S-wave which corresponds to this hot spot, and the fact that the variation in brightness of the S-wave also closely follows the orbital hump, we conclude that this emission is coming from stream-disc impact. The position along the stream trajectory at which the H bright spot is brightest corresponds to the grey region in Fig. 5, just within the disc radius deduced from the peak-peak separation of the H disc emission.
The He I 5876Å map (Fig. 4c) shows no disc emission at all. It has the strong low-velocity absorption and also the bright spot due to the stream-disc impact.
The behaviour of the H and H maps is the same as that seen in WZ Sge skid1 and also very similar to that in HE 1047 skid3 . The strong disc component in both lines, and the increase in the relative strength of the stream-disc impact to the disc in H is seen in both of the systems, while the weaker region of disc emission in H between the hot spot and donor is seen in WZ Sge but not in HE 1047.
2.6 Conclusions
The deeply-eclipsing dwarf nova IY UMa has average optical spectra during quiescence similar to those of the two similarly high inclination dwarf novae OY Car and Z Cha. Time-resolved spectroscopy and the method of Doppler tomography reveals ‘classic’ accretion flow behaviour in this system. The stream from the donor star impacts the edge of the Keplerian accretion disc, dissipating its energy in a fairly concentrated region (the bright spot seen in Figs. 4b and 4c). This stream-disc impact disrupts and/or obscures the Keplerian emission leading to the weak disc emission in the top left of Fig. 4a.
2.7 Acknowledgements
The data presented here have been taken using ALFOSC, which is owned by the Instituto de Astrofisica de Andalucia (IAA) and operated at the Nordic Optical Telescope under agreement between IAA and the NBIfA of the Astronomical Observatory of Copenhagen. The Nordic Optical Telescope is operated on the island of La Palma jointly by Denmark, Finland, Iceland, Norway, and Sweden, in the Spanish Observatorio del Roque de los Muchachos of the Instituto de Astrofisica de Canarias. The authors thank Joe Patterson and Jonathan Kemp for the data used to produce Fig. 1. The Doppler maps were produced using the software package MOLLY by Tom Marsh. We acknowledge the data analysis facilities at the Open University provided by the OU research committee and the OU computer support provided by Chris Wigglesworth. DJR is supported by a PPARC studentship. CAH acknowledges support from the Leverhulme Trust F/00-180/A.
References
- (1) Haswell C.A., Shafter A.W., 1990, ApJ, 359L, 47
- (2) Hessman F.V., Koester D., Schoembs R., Barwig H., 1989, A&A, 213, 167
- (3) Marsh T.R., Horne K., 1988, MNRAS, 235, 269
- (4) Marsh T.R., Horne K., Shipman H.L., 1987, MNRAS, 225, 551
- (5) Mason E., Skidmore W., Howell S., Ciardi D., Littlefair S., Dhillon V.S., in preparation
- (6) Patterson J., Kemp J., Jensen L., Vanmunster T., Skillman D., Martin B., Fried R., 2000, PASP, submitted
- (7) Rolfe D.J., Haswell C.A, Patterson J., 2000, MNRAS, accepted
- (8) Schoembs R., 1986, A&A, 158, 233
- (9) Skidmore W., Mason E., Howell S.B., Ciardi D., Littlefair S., Dhillon V.S., 200, MNRAS, in press
- (10) Skidmore W., Mason E., Still M., Horne K., 2000, presented at ‘Astro-Tomography’, Brussels, Belgium
- (11) Uemura M., Kato T., Matsumoto K., Takamizawa K., Schmeer P., Jensen L.T., Vanmunster T., Novák R., Martin B., Pietz J., Buczynski D., Kinnunen T., Moilanen M., Oksanen A., Cook L.M., Watanabe T., Maehara H., Itoh H., 2000, PASJ, 52, 9
- (12) Wood J.H., Horne K., Berriman G., Wade R., O‘Donoghue D., Warner B., 1986, MNRAS, 219, 629