Relation between blue/UV continuum shape and the ratio of radio to optical emission for B3-VLA quasars
Abstract
The low frequency radio luminosity is believed to be an indicator of jet power, while the optical/UV emission is probably from accretion discs in the nuclei of steep-spectrum radio quasars. We present a correlation between the ratio of radio to optical luminosities and the continuum spectral index in blue/UV bands, which might indicate that the continuum shape in blue/UV bands is related to the ratio of jet to accretion power. The results may imply that the spectra and structure of accretion discs are probably affected by the interactions between jets and discs.
keywords:
galaxies: active–galaxies: jets–quasars: accretion–quasars: blue/UV continuum1 Introduction
The optical/ultraviolet continuum in quasars is characteristic of big blue bump (Elvis et al. 1994; Sanders et al. 1989) and is conventionally parameterized by a power-law of the type of . Thermal emission from accretion discs has long been the standard paradigm for the optical/ultraviolet continuum in quasars. Many different calculations on disc spectrum have been performed to fit observed optical/UV continuum, which includes the simplest, bare, geometrically thin and optically thick non-relativistic accretion disc models (Shields 1978; Malkan 1983), the relativistic spectrum calculations of a disc surrounding a Kerr black hole (Laor & Netzer 1989; Laor et al. 1990; Natali et al. 1998), and even the calculations that both the vertical structure and radiation transfer of the disc are considered on the assumption of the non-local thermodynamic equilibrium (NLTE) (Hubeny & Hubeny 1997; 1998). The observed quasar continuum can usually be fitted by theoretical model calculations.
Radio-loud quasars are characteristic of jets, and the power of the jet is believed to be extracted from the accretion disc/black hole rotation energy (Blandford & Znajek 1977; Blandford & Payne 1982). Recently, numerical smulations show that the jet can be accelerated from the disk region very close to the black hole (Koide et al. 1999). Donea & Biermann (1996) have performed theoretical disc spectrum calculations in the presence of the jet, though no significant difference is found in the optical/UV continuum between radio-loud and radio-quiet quasars (Miller et al. 1993). The optical/UV continuum of flat-spectrum quasars may be enhanced by relativistic beaming of the jet, which prevents us from probing the accretion discs directly through their optical/UV continuum. An alternative approach is applying optical line emission instead of the continuum emission as an indicator of accretion disc for flat-spectrum quasars (Rawlings et al. 1989; 1991). The extended low frequency radio emission can be taken as an indicator of jet power (Baum et al. 1989; Rawlings et al. 1989). The SED of the accretion discs can be studied directly from their observed optical/UV continuum for steep-spectrum quasars (Serjeant et al. 1998) because their optical/UV continuum is believed to be from accretion disc without being contaminated by the synchrotron emission from the jet.
Resently, Carballo et al. (1999) present a study on the shape of the blue/UV continuum of quasars from the B3-VLA Quasar Sample (Vigotti et al. 1997) selected in radio at 408 MHz. Their work is based on photometry of 73 quasars from the B3-VLA Quasar Sample. In this paper, we study the relation between the shape of the blue/UV continuum and the ratio of radio to optical emission at 2400 Å for Carballo’s sample. In Section 2, we briefly describe the sample. The results obtained are included in Section 3. The last Section is the discussion of the results. The cosmological parameters km s-1 Mpc-1 and 0.5 have been adopted in this work.
2 The sample
The sample of quasar candidates and the final B3-VLA Quasar Sample are well described in Vigotti et al. (1997). Carballo et al. (1999) performed the photometric observations on a representative group of 73 quasars from the B3-VLA Quasar Sample. Their sample is equivalent to the B3-VLA quasar sample (except for the RA constraint) for radio flux density 0.4 Jy and includes only a few quasars with fainter radio fluxes than the limit, but generally close to the limit. The optical completeness of their sample is therefore about 80 per cent (see details in Carballo et al. 1999). Empirically, the shape of the optical/UV continuum of quasars is generally parameterized by a power-law, though the overall shape would be more complicated than a power-law. Carballo et al. (1999) use the available photometry at the four bands, , to fit the continuum of the sources by minimization, and the spectral indices of 61 quasars are given in their Table 4. Those spectral indices are all fitted with photometric error weighted power-law model. Among all 61 spectral index derived sources, 41 have acceptable power-law fits and the remainder have some large minimum with power-law fits (private communication with Carballo). In this work, we use their spectral index to indicate the Blue/UV continuum shape.
For different redshifts, observations represent fluxes in different wavelength ranges in the rest-frame of sources. The flux at some fixed wavelengths was used to construct composite spectrum by Carballo et al. (1999). The composite spectrum is normalized by the flux at 2400Å to include the largest number of quasars. Carballo et al. (1999) then use to study the relations between blue/UV luminosity and other quantities. In this work, we use almost the same approach to derive the luminosity at 2400Å in rest frame, the flux density at 2400Å are obtained by linear interpolation or extrapolation between the two nearest data points (slightly different from Carballo et al. 1999), then the luminosity at 2400Å with K-correction log is available. The radio luminosity at 408MHz is given by K-correction log, where is the two-point radio spectral index () between 408 and 1060MHz given by Vigotti et al. (1989).
The B3-VLA Quasar Sample is selected at low frequency 408MHz, where the steep-spectrum quasars dominates. We estimate the two-point spectral index () between 4.85GHz and 10.6GHz with available data (Vigotti et al. 1999) and find 42 quasars with and 17 quasars with in 61 spectral index-available quasars.
3 Results
The present sample of 61 quasars includes two strange sources with very red spectral energy distribution (SED). We rule out them in our statistic analysis as Carballo et al. (1999). We check the relations between radio and optical luminosities and fluxes, respectively and find that the correlations are still hold both in luminosities and fluxes for the sources with , which is similar to that of the whole sample (Carballo et al. 1999).
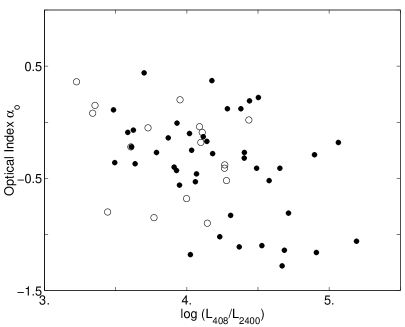
We investigate the relation between the optical spectral index and the ratio of the radio emission at 408MHz to the optical emission at 2400Å in Figure 1. A significant anti-correlation is found at 99.4 per cent confidence using spearman’s correlation coefficient and a slightly lower anti-correlation at 98.65 per cent for the sources with .
A similar correlation is found between the optical spectral index and the ratio of radio luminosity at 4.85GHz to optical luminosity both for the whole sample and the subsample with .
We also analyze the relation between the optical index and the luminosity at 2400Å in the rest-frame and find that there is only a weak correlation (at 91.4 per cent confidence) for the whole sample, while no correlation (at 80 per cent confidence) is present for the sources with .
4 Discussion
The relation between the jets and the accretion processes in the central ’engine’ is a crucial ingredient in our understanding of the physics of active galactic nuclei. Jets in quasars may be powered by rotating black hole in the nuclei (Blandford & Znajek 1977; Moderski et al. 1998), or be accelerated by the magnetic field of accretion disc (Blandford & Payne 1982). More recently, Ghosh & Abramowicz (1997), Livio et al. (1999) have shown that the electromagnetic output from the inner disc is generally expected to dominate over that from the black hole. If this is the case for present sample, the jet power is mainly determined by the properties of the disc, say, the magnetic field strength or/and the disc structure. Meanwhile, the shape of the disc spectrum is also determined by the physical quantities of the disc. It is shown that the wind from the disc would change the temperature distribution in the inner region of the disc significantly (Knigge 1999), which will surely affect the shape of disc spectra.
The low frequency radio emission of quasars can be a good indicator of the jet power , especially for steep-spectrum quasars. The radio emission of steep-spectrum quasars is believed to be mainly from the unbeamed lobes and may well reflect the (Rawlings & Sanders 1991). For steep-spectrum quasars, the optical continuum is believed to be mainly from accretion disc and the continuum shape of these sources is mainly determined by the properties of the disc, such as, the temperature distribution and radiation transfer, etc.
The ratio of radio to optical continuum at 2400Å may reflect the ratio of to accretion power to some extent for steep-spectrum quasars. The correlations found here between the optical spectral index and the ratio of radio to optical luminosity may imply that the shape of the disc spectrum is related to the ratio of . The sources with softer continuum (lower ) have the higher ratio of . Knigge (1999) calculates the disc temperature distribution with the different mass-loss winds and finds that the temperature of the inner regions of the disc would drop dramatically for strong winds. It may be the case for massive black holes, though his calculations is performed for stellar black holes. The correlation we obtain can therefore be tentatively explained by these theoretical results. The higher ratio of radio to optical continuum may correspond to the case of higher mass-loss rate (Knigge 1999) which means the lower temperature in the inner regions of the disc and then leads to the softer emitted spectrum. The further calculations on the emitted spectrum of the disc with winds surrounding a massive black hole is strongly desired, which would be helpful in understanding the correlation presented here.
There are several other effects that may lead to present anti-correlation between the optical spectral index and the ratio of the radio emission to the optical emission at 2400Å . Firstly, it is notable that the more optical luminous quasars have harder spectra (O’Brien et al. 1988; Francis et al. 1991; Carballo et al. 1999). If the radio emissions are independent of the optical emissions, a luminous quasar in the optical bands tends to have a small ratio of radio to optical emission. The lack of a significant correlation between the optical spectral index and luminosity seems to rule out this possibility at least for this sample. Secondly, the dust in the sources may play some roles on the observed fluxes in the optical bands even after the Galactic extinction correction. More dust in the line of sight may cause more absorption and reddening of the spectrum in the optical bands. If the intrinsic luminosities of the sources at 2400Å in the rest-frame have no significant difference and the radio emission is independent of the optical spectral index, the dust reddening will lead to this anti-correlation. It is difficult to estimate the dust effects quantitatively, since we are not clear on the intrinsic luminosity and the dust extinction. However, no correlation between optical spectral index and luminosity implies that the present anti-correlation may not be caused by dust reddening, though it may play some roles in it. A further study basing on larger sample of steep-spectrum quasars with photometry in multi-wavebands from the infrared to the UV (even soft X-ray) is necessary to check whether such an anti-correlation is still hold.
Acknowledgments
We would like to thank the referee’s comments. Ruth Carballo is thanked for helpful discussion on the derivation of the optical spectral index. This work is supported by the NSFC and Pandeng Project.
References
- [1] Antonucci R.R.J., 1993, ARAA, 31, 473
- [2] Barthel P.D., 1989, ApJ, 336, 606
- [3] Baum S.A., Heckman T.M., 1989, ApJ, 336, 702
- [4] Blandford R.D., Znajek R.L., 1977, MNRAS, 179, 433
- [5] Blandford R.D., Payne D.G., 1982, MNRAS, 199, 883
- [6] Carballo R., Gonzlez-Serrano J.I., Benn C.R., Snchez S.F., Vigotti M., 1999, MNRAS, 306, 137
- [7] Donea A.C., Biermann P.L., 1996, A&A, 316, 43
- [8] Elvis M., Wilkes B.J., McDowell J.C., Green R.F., Bechtold J., Willner S.P., Oey M.S., Polomski E. et al. 1994, ApJS, 95, 1
- [9] Francis P.J., Hewett P.C., Foltz C.B., Chaffee F.H., Weymann R.J., Morris S.L., 1991, ApJ, 373, 465
- [10] Ghosh P., Abramowicz M.A., 1997, MNRAS, 292, 887
- [11] Hubeny I., Hubeny V., 1997, ApJ, 484, L37
- [12] Hubeny I., Hubeny V., 1998, in AIP conf. Proc. 431. Accretion Processes in Astrophysical Systems: Some Like It Hot, ed. S.S. Holt & T.R. Kallman (Woodbury, NY, AIP) 171
- [13] Knigge C., 1999, MNRAS, 309, 409
- [14] Koide S., Shibata K., Kudoh T., 1999, ApJ, 522, 727
- [15] Laor A., Netzer H., 1989, MNRAS, 238, 897
- [16] Laor A., Netzer H., Piran T., 1990, MNRAS, 242, 560
- [17] Livio M., Ogilvie G.I., Pringle J.E., 1999, ApJ, 512, 100
- [18] Malkan M.A., 1983, ApJ, 268, 582
- [19] Miller P., Rawlings S., Saunders R., 1993, MNRAS, 263, 425
- [20] Moderski R., Sikora M., Lasota J.P., 1998, MNRAS, 301, 142
- [21] Natali F., Giallongo E., Cristiani S., La Franca F., 1998, AJ, 115, 397
- [22] O’Brien P.T., Gondhalekar P.M., Wilson R., 1988, MNRAS, 233, 801
- [23] Rawlings S., Saunders R., Eales S.A., Mackay C.D., 1989, MNRAS, 240, 701
- [24] Rawlings S.G., Saunders R.D.E., 1991, Nature, 349, 138
- [25] Sanders D.B., Phinney E.S., Neugebauer G., Soifer B.T., Mathews K., 1989, ApJ, 347, 29
- [26] Scheuer P.A.G., 1987, in Superluminal Radio Sources, edited by J.A. Zensus and T.J. Pearson, p.331, Cambridge University Press
- [27] Serjeant S., Rawlings S., Maddox S.J., Baker J.C., Clements D., Lacy M., Lilje P.B., 1998, MNRAS, 294, 494
- [28] Shields G., 1978, Nature, 272, 706
- [29] Vigotti M., Grueff G., Perley R., Clark B.G., Bridle A.H., 1989, AJ, 98, 419
- [30] Vigotti M., Vettolani G., Merighi R., Lahulla J.F., Pedani M., 1997, A&AS, 123, 219
- [31] Vigotti M., Gregorini L., Klein U., Mack K.H., 1999, A&AS, 139, 359