Wide Field Imaging at 250 GHz
Abstract
We summarize results from sensitive, wide-field imaging using the Max-Planck Bolometer Array at the IRAM 30m telescope, including source counts, clustering, and redshift distribution.
The Max-Planck mm Bolometer Array (MAMBO) is a 37 element, 250 GHz bolometer array operating at 300 mK. We have observed extensively with MAMBO at the IRAM 30m telescope over the last two winters, including pointed observations of selected samples of high redshift objects to typical rms sensitivities of 0.3 mJy, and wide field raster imaging to sensitivities of about 0.5 mJy over areas arcmin2. The pointed observations will be presented elsewhere. In this short contribution we summarize preliminary results from the wide field imaging programs.
The three fields observed thus far are the NTT Deep field, the Lockman Hole, and the cluster Abell 2125. In parallel with the wide field imaging at 250 GHz, we have observed, or will be observing, these fields with the VLA at 1.4 GHz to rms Jy, and we are obtaining sensitive optical and near-IR wide field images with various optical telescopes.
Figure 1 shows the MAMBO image of the Abell 2125 field. The rms in the center of the field is about 0.5 mJy. We detect 36 sources with flux densities, S mJy in regions with rms noise mJy. The brightest source is 13 mJy. This source is also detected at 1.4 GHz with S mJy, and has a point source optical counterpart. We feel it likely that this is a radio-loud QSO, and that the 250 GHz emission is the high frequency extrapolation of the AGN synchrotron spectrum. We have examined in detail the optical and near-IR properties of a few of the MAMBO sources in the Abell 2125 field[2]. These appear to be the same population as the SCUBA sources, in the sense that they are typically very faint in the optical and near-IR, with .
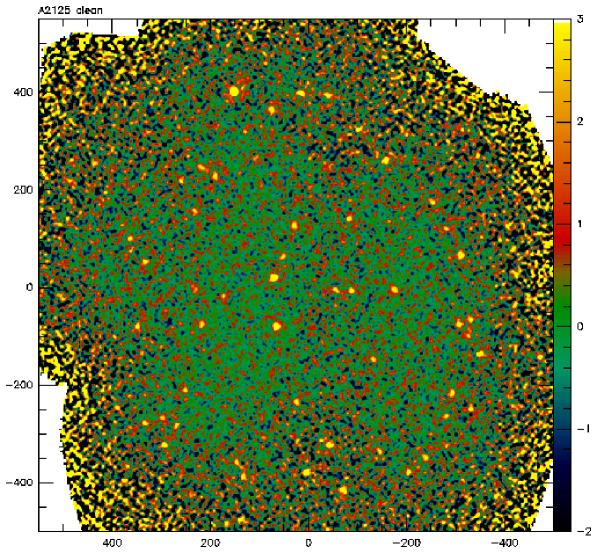
Figure 2a shows the cumulative source counts based on two of the three MAMBO fields, along with source counts determined from various SCUBA surveys. We relate 250 GHz flux densities to 350 GHz flux densities using a scaling factor of 2.25. This factor is applicable to a typical starburst galaxy at . We have included faint source counts in the regions within a 1′ radius of the cluster center assuming a mean gravitational magnification factor of 2.5. The MAMBO and SCUBA counts agree well at intermediate flux densities (S to 8 mJy). The very wide fields imaged by MAMBO allow us to set the best constraints to date at high flux densities, and we find that there is steepening in the distribution at S mJy, consistent with an exponential cut-off in the starburst galaxy population at about L⊙. All of the data can be reasonably fit by a Schechter-type luminosity function, with a powerlaw index of –2 and an exponential cut-off at 10 mJy.
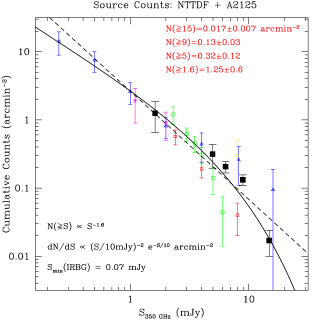
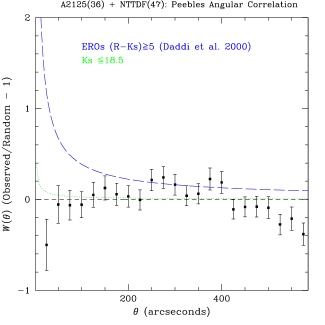
Figure 3a shows the redshift distribution for the Abell 2125 field sources that are detected at both 250 GHz and 1.4 GHz. We selected this field for a redshift analysis since it has the deepest radio image of the three MAMBO fields, with an rms = 7 Jy. The redshifts were determined using the 1.4 GHz-to-250 GHz flux density ratio applicable to star forming galaxies[1]. We find that 18 of the 36 sources with S mJy are detected at SJy. The median redshift is 2.5, with most of the sources between . The high radio detection rate gives us confidence in the reliability of the MAMBO selected sources. We expect only about 1 source to have been detected at random at 1.4 GHz within 3′′ of any of the 36 MAMBO source positions. The high detection rate also implies that the sensitivities of the mm and cm surveys are well-matched, and that there is not a dominant ‘hidden’ population of sources, either at very high redshift, or at low redshift but with radio flux densities below those expected for starburst galaxies based on the radio-to-far IR correlation. Given these results, it is likely that the upcoming radio imaging programs with the VLA pushing down to an rms mJy at 1.4 GHz will result in a close-to-complete radio detection rate for fields such as this.
Figure 3a also shows the redshift distribution for SCUBA sources at 350 GHz with radio detections. This shows a lower median redshift of 1.9. A systematic offset in redshift between sources selected at 250 GHz relative to 350 GHz is expected qualitatively, since the spectral energy distributions go ‘over-the-top’ of the IR peak at lower at 350 GHz. Quantitatively however, one would expect this segregation to occur at higher redshift, , hence we feel that the segregation in redshift in Figure 3a is more likely due to the deeper radio survey for Abell 2125.


Figure 3b shows the total redshift distribution for sources selected at either 250 or 350 GHz, including sources with spectroscopic redshifts, radio detections, and radio lower limits. The distribution is broad, but most of the sources appear to be in the range , with a median of 2.3 for sources with radio detections and/or spectroscopic redshifts, and 2.9 if radio lower limits are included. The lower limits leave open the possibility of a substantial, although not majority, population of high- sources, with .
Figure 2b shows the clustering properties of the sources in the Abell 2125 plus the NTT deep field. Plotted is the Peebles two-point correlation function, determined using a random distribution of a large number of sources with the same spatial sampling as the MAMBO fields. We also plot the clustering properties of Extremely Red Objects (EROs)[3]. The results are noisy, due to the small number of sources, but the mm-selected sources appear to be less clustered than the EROs. This is not surprising, since the EROs are mostly intermediate-redshift elliptical galaxies with very strong clustering properties. Also, given the very flat ‘redshift selection function’ for mm sources from (i.e. the strong negative correction), any clustering will be highly diluted by the large volume sampled.
References
- [1] Carilli, C.L. and Yun, M.S. 2000, ApJ, 530, 618
- [2] Bertoldi, F. et al. 2000, A&A, 360, 92
- [3] Daddi, E. et al. 2000, A&A, in press