Starburst or Seyfert? Adding a radio and far-infrared perspective to the investigation of activity in composite galaxies
Abstract
It was once common to regard Seyfert and starburst galaxies as completely different types of object, but there is growing recognition that these classifications refer to the extremes of a continuous spectrum of galaxy types. In a previous study we investigated a sample of galaxies with ambiguous optical emission-line ratios and concluded from near-infrared spectroscopic observations that the sample consisted of composite galaxies, containing both a starburst and an active galactic nucleus (AGN). We now extend our study using radio synthesis and long-baseline interferometer observations made with the Australia Telescope, together with far-infrared IRAS observations, to discuss the relative contribution of starburst and AGN components to the overall luminosity of the composite galaxies. We find that only a small fraction of the radio emission ( 10%) can be attributed to an AGN, and that the majority of the far-infrared emission ( 90%) is probably due to the starburst component. We also show that an AGN contribution to the optical emission of as little as 10% is sufficient to account for the ambiguous line-ratio diagnostics.
1 Introduction
The possible existence of a relationship between massive star formation and an active galactic nucleus (AGN) is a long standing, controversial issue. An increasing number of galaxies have been shown to contain both intense star formation, typical of a starburst galaxy, as well as a non-thermal ionising source, attributed to an AGN. Well known examples of such composite galaxies are NGC 1068 (Thatte et al. 1997), NGC 7469 (Genzel et al. 1995), Mrk 477 (Heckman et al. 1997) and Circinus (Oliva et al. 1995), all of which contain, in addition to a Seyfert nucleus, circumnuclear star formation that contributes significantly to the total luminosity. In many such cases, the composite nature of the galaxies is based on optical and NIR observations. However, radio observations can also be a powerful tool for distinguishing starburst and AGN activity.
In general, galaxies dominated by starbursts exhibit diffuse radio emission as the result of synchrotron radiation associated with supernova remnants and cosmic rays (Sramek & Weedman 1986). Seyfert galaxies, on the other hand, generally exhibit more compact emission or, in the more radio-energetic cases, linear structures, identifiable as jets and radio lobes (Wilson et al. 1991). The use of radio morphology to distinguish the dominant activity within galaxies is well established (Norris et al. 1988a; Wilson 1988; Crawford et al. 1996). As one example, NGC 1068, a known composite galaxy, has been observed in the radio to contain both diffuse emission, presumably as a result of star formation, and linear structure, attributed to a jet (Wilson & Ulvestad 1982; Wynn-Williams et al. 1985; Gallimore et al. 1997).
As a step towards exploring the possible relationship between starburst and Seyfert activity within a homogeneous data set, we have formed a sample of galaxies that are composite in nature. The galaxies were chosen on the basis of optical spectroscopy and investigated further using near-infrared (NIR) spectroscopy (Hill et al. 1999: Paper 1). In this previous study, we found only one galaxy, from a sample of 12, to be dominated in the optical/NIR by star formation, with minimal, if any, contribution from an AGN. However, the remaining 11 galaxies show evidence that they are composed of a starburst population and dust heated to temperatures of up to 1000 K by an AGN. In this paper, we present a radio study of the sample in an attempt to place tighter limits on the AGN contribution.
The Australia Telescope Compact Array (ATCA) was used to image our sample at 3 and 6 cm. These data are combined with additional information such as radio spectral indices and far-infrared (FIR) colours to investigate further the nature of the powering source. We also present long-baseline interferometry observations using the Parkes-Tidbinbilla Interferometer (PTI; Norris et al. 1988b). PTI is sensitive to structures with sizes (corresponding to 40 pc at the mean distance of the sample) at 13 cm and brightness temperatures 105 K. PTI will therefore respond to the non-thermal emission from compact cores of Seyferts with brightness temperatures 108 K, yet is essentially blind to extended H II regions or supernovae associated with starbursts, which have typical brightness temperatures of 104 K. However, recent studies suggest that extremely luminous radio supernovae (RSNe) associated with starbursts may also account for some of the emission detected with PTI (Kewley et al. 2000a; Smith et al. 1998a).
The sample selection criteria are presented in Section 2. Details of the observations and data reduction for the ATCA and PTI are given in Section 3. Our results are presented and discussed in Section 4, with our conclusions in Section 5. Throughout this paper, we adopt H0 = 75 km s-1 Mpc-1 and q0 = 0.5.
2 Sample Selection
Our sample consists of galaxies, identified in Paper 1, that have characteristics intermediate between starbursts and AGNs based on optical spectroscopy. We used the optical emission-line diagnostic diagrams of Veilleux & Osterbrock (1987), where the emission-line ratios of [O III]/H, [N II]/H, [S II]/H and [O I]/H are compared, to find galaxies that are not clearly identified as either a starburst or AGN. The emission-line ratios used by Veilleux & Osterbrock are generally good discriminators of starbursts and AGNs, because each ratio consists of a forbidden line, which is relatively strong in the partially ionised regions of AGNs, compared with a hydrogen recombination line, which is excited by hot stars formed in starbursts. The galaxies in our sample lie in an intermediate region between the starburst and AGN groupings, either by falling within 0.15 dex of the boundary line separating starbursts and Seyferts, or by falling within the domain of starburst galaxies in one diagnostic diagram and within the domain of AGNs in another. The sample was also constrained by a redshift upper limit of and declinations south of +24∘. Full details of the sample selection are given in Paper 1.
NIR spectroscopy, undertaken in Paper 1, showed that the ambiguous nature of the galaxies was not limited to optical emission but that NIR emission-line ratios also failed to distinguish the galaxies as starburst or AGN. From this, and from further results in Paper 1, we concluded that the galaxies are composites, containing both a starburst and AGN component.
3 Observations and Reductions
3.1 ATCA
Radio continuum observations were made in 1996 April 8–11, using the Australia Telescope Compact Array in the 6A configuration, which utilises all six antennas and covers east-west baselines from 337 m to 6 km. Observations were made simultaneously at 6 and 3 cm, centred on frequencies of 4.800 and 8.640 GHz respectively, each spanning a bandwidth of 128 MHz. The galaxies were observed in the time-efficient snapshot mode, whereby a number of short observations, or cuts, of each galaxy are made over a wide range of hour angles (Burgess & Hunstead 1995). Between 10–20 cuts, each approximately 10 minutes, were made for every galaxy. Unresolved phase calibrators were observed before and after every galaxy observation; the primary flux density calibrator was PKS B1934638.
Standard calibration and data reduction were performed using MIRIAD (Sault et al. 1995). Natural weighting was applied to both frequencies to maximise sensitivity. The data were CLEANed and since all fields contained at least one compact object, self-calibration was used to provide additional corrections. Despite limited uv coverage using the snapshot method, the noise level in each image was close to theoretical, measuring 70–90 Jy beam-1 rms. The resolution of the images ranged from 2′′ to 4′′ FWHM at 3 cm and 4′′ to 8′′ FWHM at 6 cm.
3.2 PTI
Radio interferometry observations were made at 13 cm using the Parkes-Tidbinbilla Interferometer during two sessions in 1996, June 1–2 and October 19–20. Two bandpasses, centred on 2.290 GHz and 2.298 GHz, were observed simultaneously, each with bandwidths of 8 MHz. The data were recorded in real-time using a microwave link between the 64 m Parkes radio telescope and the 70 m telescope at Tidbinbilla (part of the Canberra Deep Space Communication Complex), providing a fringe spacing of 0.1′′ at 2.3 GHz. Nineteen sample galaxies were observed with PTI as well as three starburst galaxies and three AGNs for comparison purposes. Unfortunately, it was not possible to observe galaxies with RAs between 16h–20h as the Tidbinbilla telescope was being used to track the Galileo spacecraft. Each galaxy was observed at a single hour angle for approximately 20 minutes; unresolved flat-spectrum calibrators were observed about every 2 hours.
The AIPS task FRING was used to search for detections in both delay and fringe rate, by applying a Fourier transform fringe-search technique. In this way, we have been able to detect sources that are offset from the phase and delay centre by plotting the correlated intensity as a function of fringe frequency; fringe rate and delay were then used to calculate source positions. Sources were detected up to 3′ away from the pointing centre. Furthermore, to ensure that we did not miss any detections of galaxies within the sample due to strong off-centre sources, FRING was run repeatedly, while decreasing the area searched in delay and rate (see Section 4.3).
4 Results
4.1 Radio Imaging
Sixteen galaxies with declinations (see Table 1) were observed with the ATCA, including four close galaxy pairs (ESO 550-IG025, ESO 440-IG058, ESO 527-IG07 and ESO 343-IG013) and two merging galaxies (MCG-02-33-098 and MCG-02-33-099). Optical spectra of these galaxies, given in the literature, identify them as intermediate between starbursts and AGNs (see Section 2 and Paper 1) with two exceptions: the western nucleus of ESO 527-IG07 has no published optical spectrum, and the merging galaxy MCG-02-33-099 has an optical spectrum typical of a starburst.
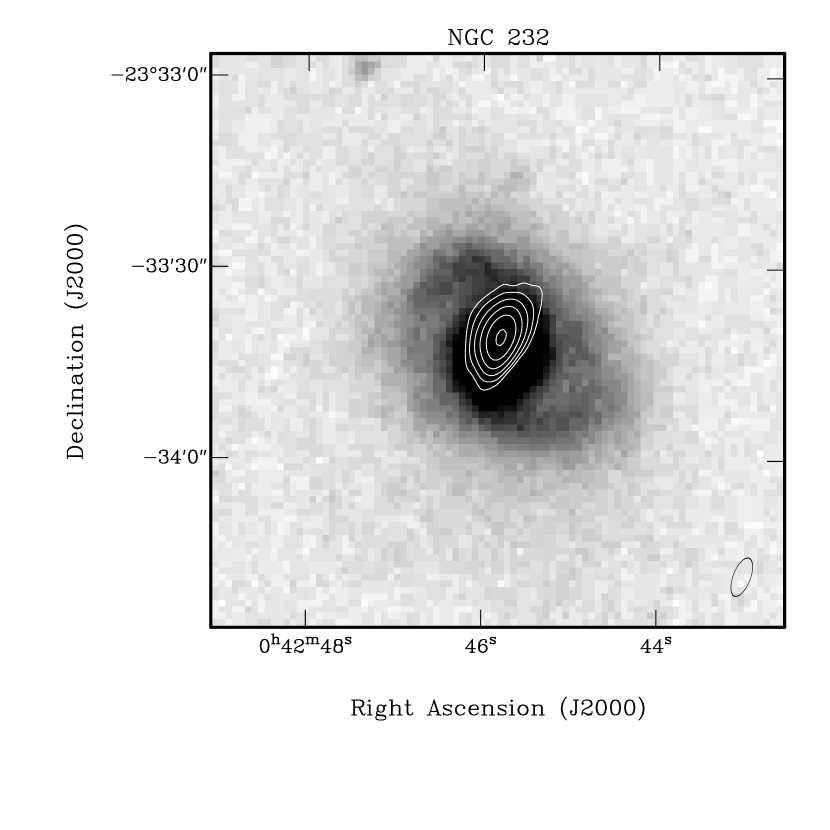
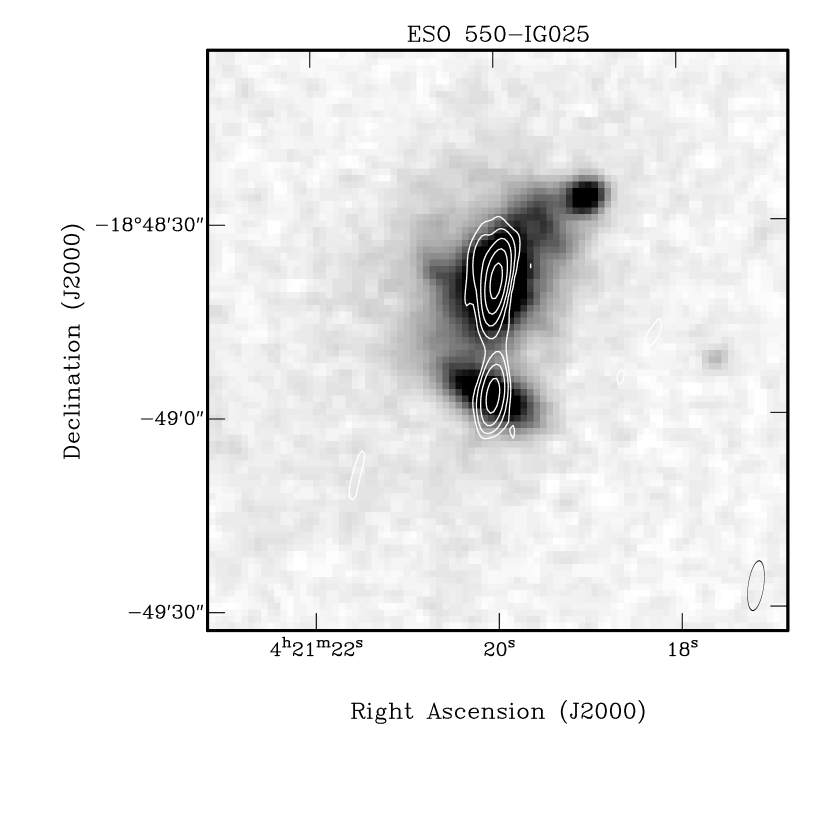
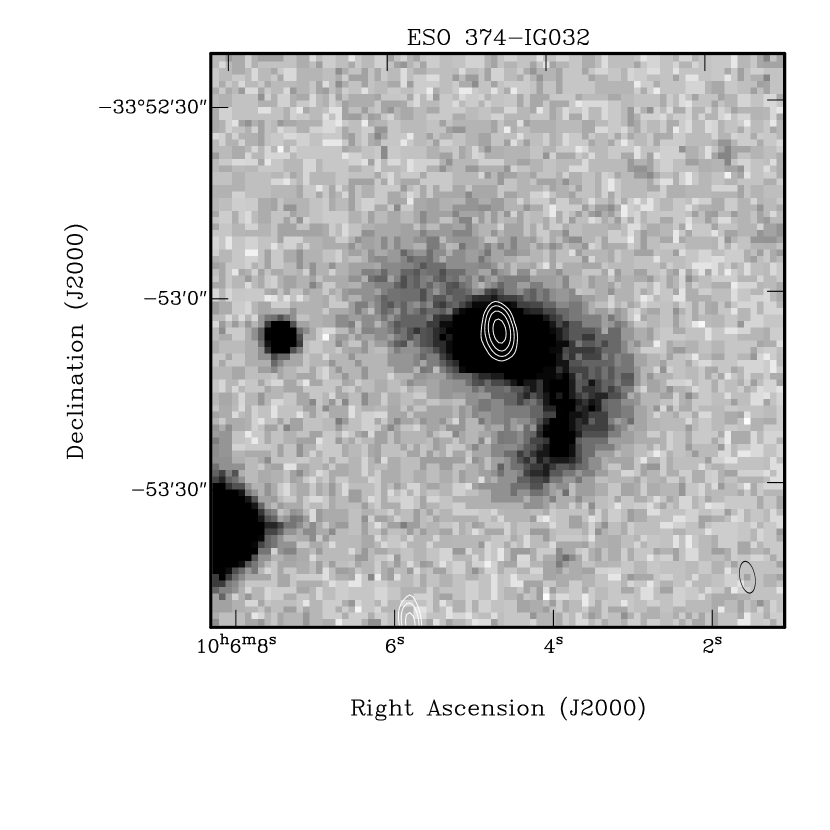
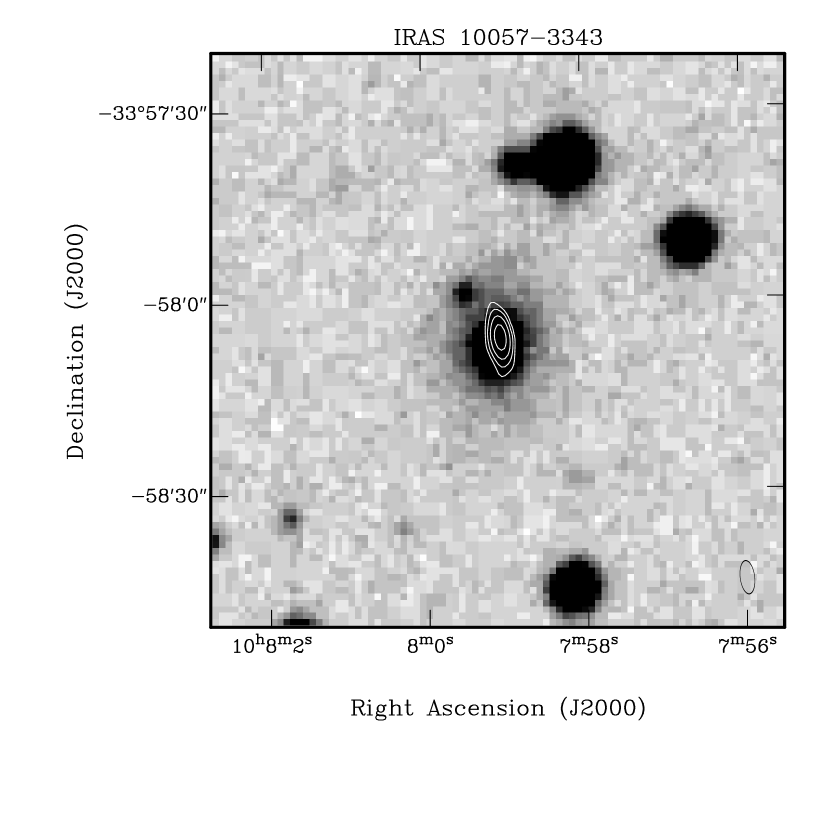
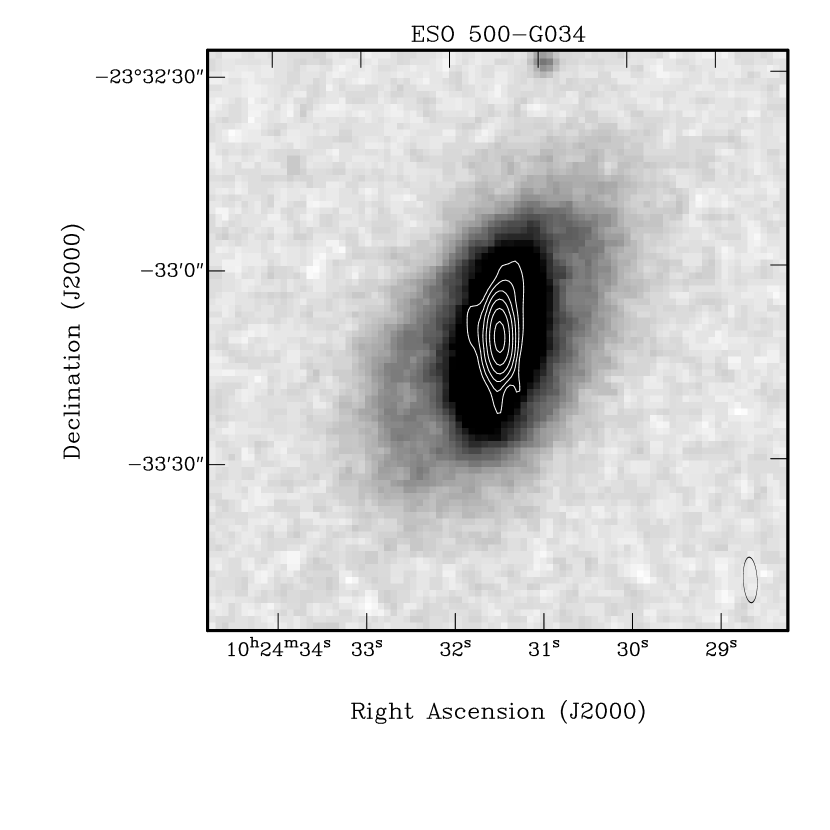
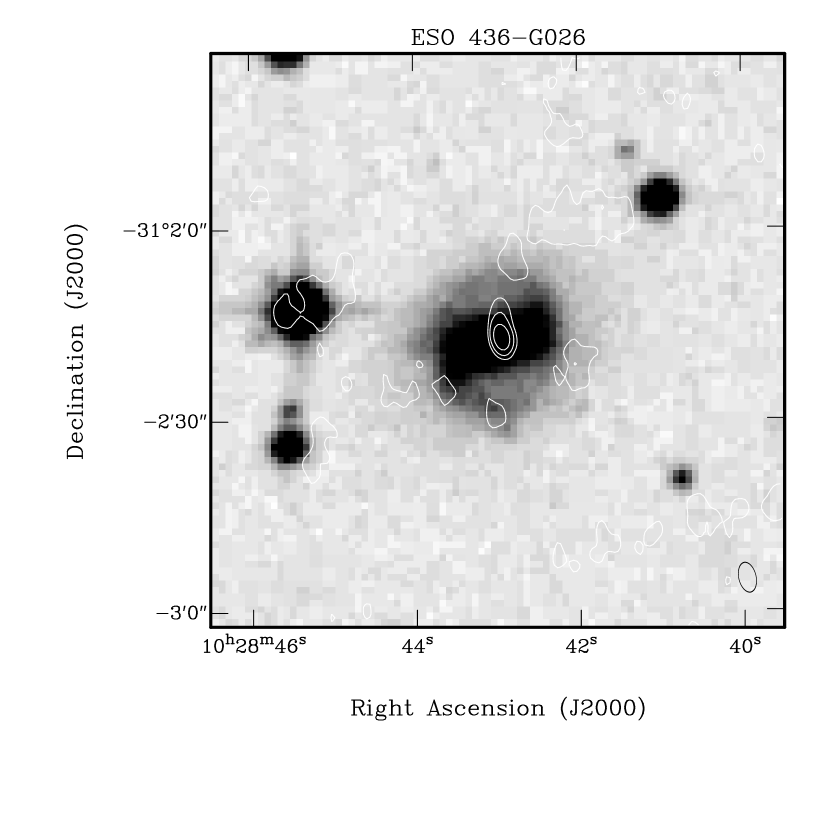
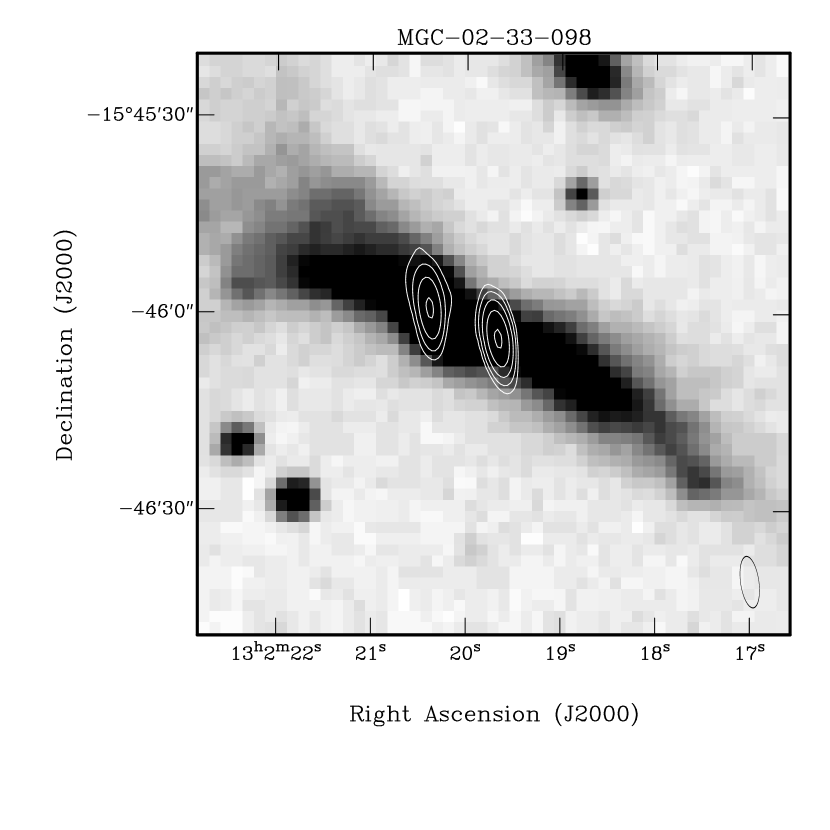
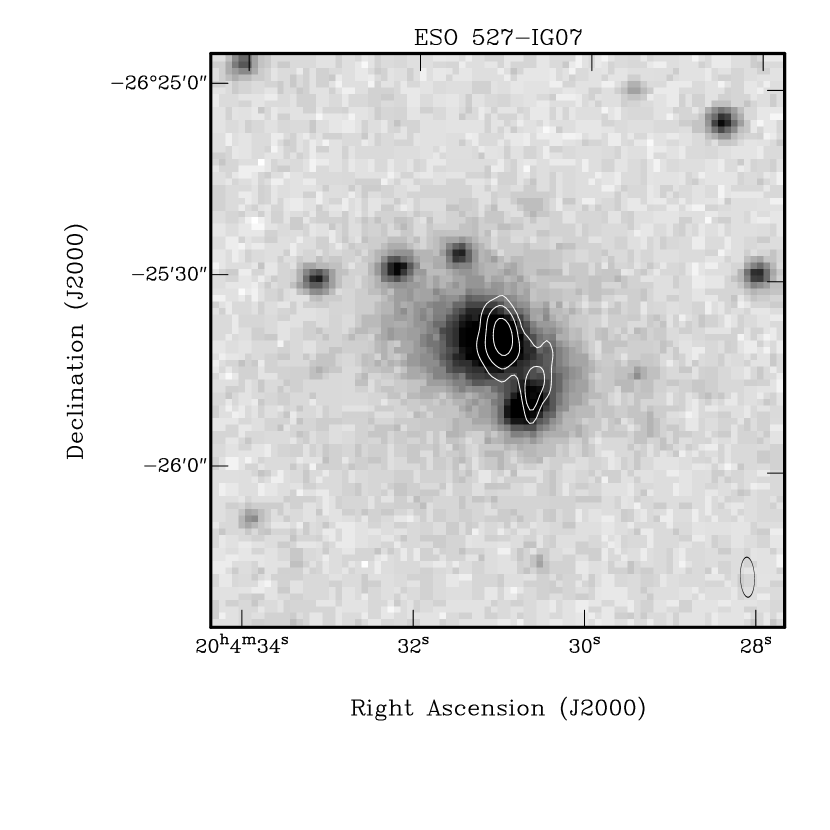
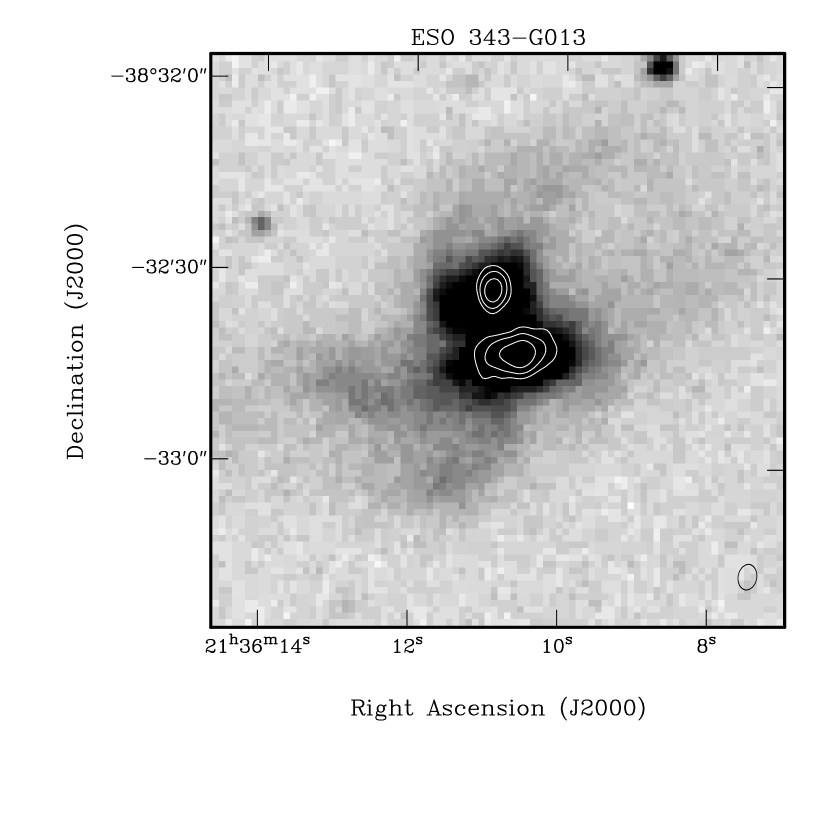
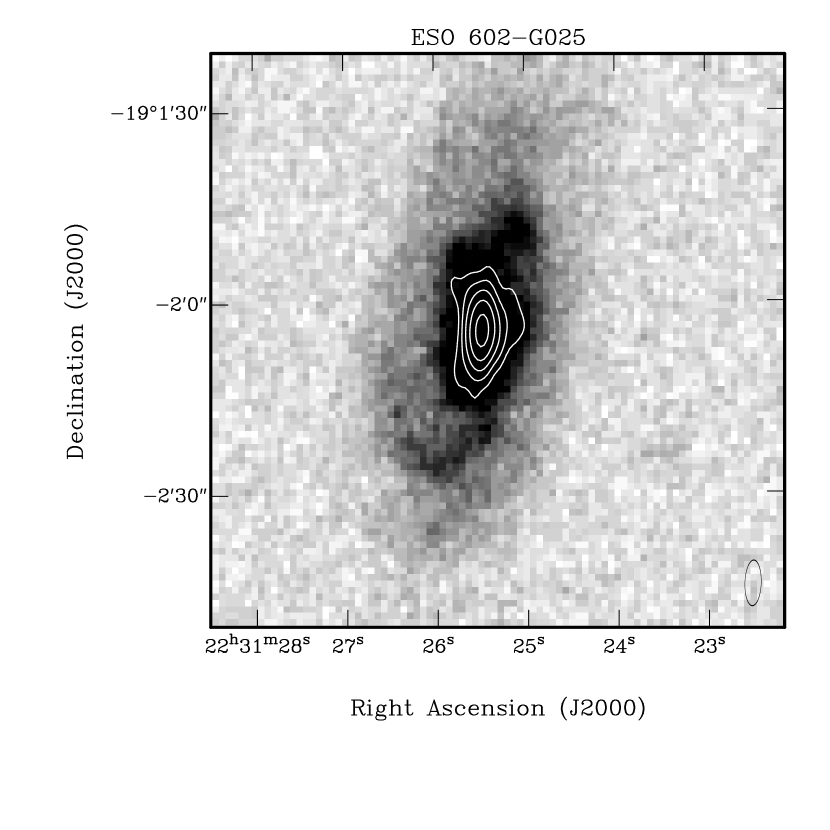
In Figure 1 we present the ATCA 6 cm images overlaid as contours on images from the Digitized Sky Survey (DSS), using the second epoch (red-sensitive) DSS-II.333We note that Deutsch (1999) has found positional errors ( 1 pixel) in both RA and Dec for some images in the prepublication release of the DSS-II. Of the 14 composite galaxies, 13 were detected with the ATCA and in the majority of cases the emission is unresolved. The only non-detection was the northern nucleus of ESO 440-IG058, which has a 3 upper limit of 0.2 mJy.
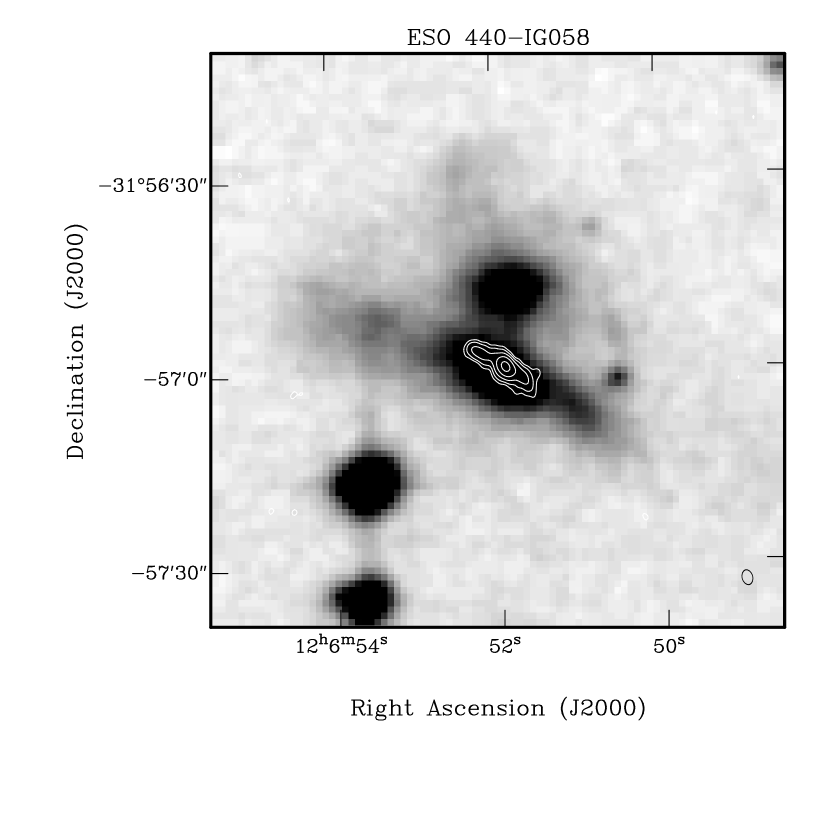
Extended radio structure was found in two galaxies: the southern galaxy in the pair ESO 440-IG58 and the southern galaxy in the pair ESO 343-IG013. The latter pair, in particular, appears to represent a current interaction with tidal tails being seen in optical images. In Figure 2 we present the ATCA 3 cm images overlaid as contours on the DSS-II images for ESO 440-IG058 and ESO 343-IG013. The increased resolution of the 3 cm images shows that the extended radio emission in ESO 440-IG058 south probably traces the star formation in the disk of the galaxy.
Total flux densities for the galaxies, given in Table 2, were obtained using the MIRIAD task SFIND, which performs a Gaussian profile fit. We also include 20 cm flux densities from the NRAO VLA Sky Survey (NVSS) (Condon et al. 1998). The NVSS images (45′′ FWHM) are of lower resolution than the ATCA images so, not surprisingly, the four galaxy pairs observed with the ATCA (ESO 550-IG025, ESO 440-IG058, ESO 527-IG07 and ESO 343-IG013) and the pair of merging galaxies (MCG-02-33-098 and MCG-02-33-099) are detected as single sources by the NVSS. For ESO 440-IG058, ESO 527-IG07 and ESO 343-IG013 the 20 cm emission appears to be centered on the dominant ATCA source. For the non-interacting galaxies the 20 cm emission aligns closely with the ATCA emission, except for ESO 374-IG032 where the NVSS image includes an unrelated source detected at 6 cm with ATCA, lying 45′′ south of the galaxy. For this galaxy, therefore, and for the galaxy pairs, we have divided the 20 cm flux density into two components in proportion to their 6 cm flux densities.
4.2 Spectral Index
Ideally, to determine the spectral index, (where ), of the composite galaxies we require a scaled array in which the baselines (in wavelengths) at 3 and 6 cm are matched. We approximate a scaled array for the 3 and 6 cm images by applying natural weighting to both data sets, thereby giving more significance to the shorter baselines, and by convolving the 3 cm images to the corresponding 6 cm beam so that the images are brought to the same resolution.
Although the spectral index is often determined between just two frequencies, we draw on the NVSS data to expand the frequency baseline. In Table 2, we present the spectral index for each nucleus, measured between 3–6 cm () and 6–20 cm (). Starburst and Seyfert galaxies typically have a spectral index of , although Seyferts are more likely to have steeper spectra, with . (e.g., de Bruyn & Wilson 1978; Sramek & Weedman 1986; Edelson 1987). The mean spectral index for our galaxies, , is consistent with the expected value for both starbursts and Seyferts. The galaxy ESO 436-G026 has an unusually flat spectrum between 3 and 6 cm that steepens significantly towards 20 cm. We attribute this to the presence of a flat-spectrum AGN core, as this galaxy was detected with PTI and has a high core-to-total flux density ratio (see Section 4.3).
4.3 PTI
Unresolved radio emission (referred to here as a PTI ‘core’) was detected in five of the 20 composite galaxies observed with PTI. The sensitivity limit of PTI, corresponding to a 3 detection, was measured to be 0.9 mJy at 13 cm. The flux densities of the five PTI cores are given in Table 3, as well as the estimated total 13 cm flux densities derived from the data in Table 2. In addition to system noise, the PTI core flux densities have nominal errors of 7% due to uncertainty in the antenna gains. Studies of radio galaxies involving multiple observations of individual sources (Slee et al. 1994; Morganti et al. 1997) have shown that the correlated PTI flux density can scatter by as much as 20% due to time variability and/or source structure. In our study only one galaxy, Mrk 1344, was observed twice, in 1996 June and again in 1996 October, and the two measurements agree to well within the combined calibration errors.
We now raise the question: Is our detection rate of 25% consistent with a sample of galaxies that contain AGNs? In the first instance we compare this result with the detection rate found for the three starburst galaxies and three Seyfert galaxies we observed for comparison in this study. PTI cores were detected in two of the three Seyfert galaxies but in none of the starbursts. This result is typical of other studies: Norris et al. (2000) detected only one of 74 starburst galaxies but obtained a PTI detection rate of 38% from 221 Seyferts; Heisler et al. (1998) detected none of three starbursts but found PTI cores in 10 out of 11 Seyferts. We propose that the detection rate for our composite sample, while not being exceptionally high, is consistent with a sample of AGNs, assuming that PTI is insensitive to the low brightness temperatures and diffuse structure typical of starbursts. This interpretation is apparently contradicted by studies in which compact radio cores are detected in many starburst galaxies. One such study by Lonsdale et al. (1993) found detection rates of eight from 15 starbursts (53%) and seven from 13 Seyferts (54%) with 18 cm VLBI observations. These high detection rates for starburst galaxies, and also Seyferts, are perhaps not surprising as the Lonsdale et al. sample was preferentially selected from galaxies known to contain compact radio cores with angular size . The sample may also be subject to a luminosity selection effect, as it was selected from among the most luminous members of the IRAS Bright Galaxy Sample, with .
The detection of VLBI cores in many of the starburst galaxies in the Lonsdale et al. (1993) sample, combined with their strong IRAS emission, may simply indicate a dominance of dust-obscured AGNs and does not necessarily imply a starburst origin for the compact cores. The alternative possibility, that a starburst-related process may produce compact radio emission, comes from the discovery of a new class of exceptionally luminous RSNe (Yin & Heeschen 1991; Lonsdale et al. 1992; Wilkinson & de Bruyn 1990). Smith et al. (1998a) claim that from 11 detections of starburst galaxies, 7 may be explained by extremely luminous RSNe. However, the only galaxy to date where the compact core can definitively be attributed to a starburst is the ultraluminous IRAS galaxy (ULIRG), Arp 220, where high resolution images have revealed numerous unresolved sources interpreted as RSNe (Smith et al. 1998b).
To investigate the possibility of RSNe in our sample we follow Smith et al. (1998b) and compare our PTI detections with the well studied and unusually bright RSN, SN 1986J in the galaxy NGC 891 (Weiler, Panagia & Sramek 1990). During 1986, SN 1986J peaked at 6 cm reaching a flux density of 130 mJy. Using the (optically thick) spectral index calculated at that time from 6 cm and 20 cm observations of the supernova, we derive a corresponding 13 cm flux density of 100 mJy. Our sample galaxies are on average 10 times more distant than NGC 891, so if a RSNe similar to 1986J existed in our sample, it would be at a level of approximately 1 mJy and just marginally detectable with PTI. Since 1986J is amongst the most luminous RSNe ever discovered, the nature of the PTI detections is not yet determined.
An interesting caveat in the debate over a starburst or AGN origin of compact radio cores is given in the recent work of Kewley et al. (2000a). In their study of warm infrared galaxies, they detected compact radio cores in 8 from 10 (80%) AGNs and 10 from 27 (37%) starbursts. However, the core luminosities of the starburst galaxies were lower than those in the AGNs, suggesting that the starburst cores may be radio-luminous supernovae. Comparing the luminosity of our five PTI detections with those in the Kewley et al. sample, we find that three galaxies (ESO 550-IG025, MCG+00-29-23 and IRAS 12224-0624) are consistent with AGN-like compact cores, while the remaining two galaxies (ESO 436-G026 and Mrk 1344) are possibly starburst-related. However, in the specific case of ESO 436-G026, the flatness of its radio spectrum between 3–6 cm does favour the presence of an AGN core.
We cannot tell from the radio data alone whether our PTI detections are weak AGN cores or radio-luminous supernovae. However, we can compare the flux density of the compact core (derived from the PTI detections or 0.9 mJy limits for non-detections) with the total 13 cm flux density (derived from the ATCA observations). These are used to determine a core-to-total flux density ratio, given in Table 3. For the composite galaxies we find on average that a compact core accounts for % of the total radio emission. Interestingly, the compact radio cores in the reference Seyfert galaxies in Table 3 also contribute typically % of the total. We show in Section 4.7 that a similar AGN contribution in the optical is sufficient to account for the ambiguous optical emission line ratios of the composite galaxies.
4.4 Supernova or AGN
The PTI results indicate that most galaxies in our sample are not AGN-dominated. Since it is generally assumed that the radio emission from galaxies with starburst characteristics is predominantly non-thermal emission from cosmic rays accelerated by supernova remnants (SNRs), we follow Condon & Yin (1990) and estimate the Type II supernova rate from
| (1) |
where is the non-thermal component of the radio luminosity in WHz-1, is the frequency in GHz and is the non-thermal radio spectral index, taken here to be . The supernova rate can then be used to estimate the number of ionising photons
| (2) |
and, by assuming the average ionising flux from OB stars to be (Smith, Herter & Haynes 1998), a star-formation rate (SFR) can be derived and is given in Table 4.
Since the SFR is derived from the supernova rate, it is an indication of the past SFR for massive stars in the galaxy, as the progenitors of Type II SNe are massive stars () with lifetimes years. The SFR may be somewhat over-estimated since we have assumed that all of the radio emission is non-thermal. The empirical relationship between the non-thermal and thermal radio emission (Condon & Yin 1990) suggests that 25% of the total 4.85 GHz radio flux density may be thermal (Smith, Herter & Haynes 1998).
The galaxy NGC 1614 has an inferred supernova rate four times larger than any other galaxy in the sample. It has a high FIR luminosity, and is usually classified as a starburst galaxy (Keto et al. 1992). However, based on our selection criteria, NGC 1614 has ambiguous optical emission-line ratios (Veilleux et al. 1995). Although Neff et al. (1990) find no direct evidence of an AGN in NGC 1614 they suggest that the galaxy may be a precursor to a Seyfert (i.e., the AGN has not yet turned on) due to the high luminosity they measure for the nucleus of the galaxy. No signs of an AGN have been found in other studies of NGC 1614 (Lançon et al. 1996; Heisler et al. 1999).
The median supernova rate from Table 4 is 0.2 yr-1, which is high compared with the rate of 0.03 yr-1 found for Seyfert 2 galaxies with circumnuclear star formation (Forbes & Norris 1998). This suggests a dominance of star formation within our sample. However, it is surprising that Mrk 52, which was found to be dominated by star formation in Paper 1, has an exceptionally weak SFR.
4.5 FIR spectral energy distribution
The heating mechanisms at work in galaxies can be investigated using FIR colours. The majority of IRAS galaxies (70–80%) appear to be dominated by star formation, with the FIR emission being due to dust heating from an intense starburst (Sanders & Mirabel 1996; Leech et al. 1989). This appears to hold even for the ULIRGs with (Genzel et al. 1998). Mergers are also common, with 70% of the ULIRGs involved in interactions (Leech et al. 1994). However, the proportion of mergers does drop considerably for (Sanders & Mirabel 1996). The extreme luminosities of some IRAS galaxies, their extensive star formation, and the large fraction of mergers have led to suggestions that these galaxies are presently in a transient phase which may be important in the formation of an active nucleus (Sanders et al. 1988).
All the composite galaxies in our sample have published IRAS flux densities and in Figure 3 we present three FIR colour-colour diagrams which can be used to discriminate between starburst and Seyfert excitation. Included in these diagrams are a reddening line, extreme mixing curve and empirical starburst line taken from Dopita et al. (1998). The reddening line was obtained by applying IR extinctions given by Dwek et al. (1997) to an average Seyfert 1, with flux density normalised to 10 mJy at 100 m. The empirical starburst line joins the average flux values of a “cool” starburst to a “hot” starburst taken from the data of Rush et al. (1993), again with the flux density normalised to 10 mJy at 100 m. The extreme mixing line was determined by adding a percentage of the “cool” starburst flux to the non-reddened average Seyfert 1 value. Dopita et al. (1998) make it clear that any number of mixing curves can be added to these FIR colour-colour diagrams but the mixing curve used here is an extreme solution and, therefore, all objects are expected to lie within the region bounded by the reddening line, the empirical starburst line and the extreme mixing curve.
In Figure 3a the composite galaxies lie along the starburst line, while in Figures 3b and 3c the composite galaxies are clustered around the top end of the AGN/starburst mixing curve. This indicates that star formation is dominating the FIR emission, with a starburst contribution of 90%, consistent with the PTI results which place the AGN contribution at 10%.
4.6 FIR-radio correlation
One of the tightest correlations for radio-quiet star-forming galaxies is found between the FIR and radio luminosities. Although the correlation has been known for two decades or more (Dickey & Salpeter 1984; de Jong et al. 1985; Wunderlich, Klein & Wielebinski 1987; Condon 1992), its origin is still not clear. Starburst activity is one likely explanation: the massive OB stars formed within starbursts heat the surrounding dust which re-radiates in the FIR, while the radio emission comes about through the death of these massive stars as supernovae that accelerate cosmic rays and in turn produce synchrotron radiation (Helou & Bicay 1993; Volk 1989). The uncertainty in this scenario is in the feedback mechanism required to link the FIR and radio emission so tightly.
Starburst galaxies generally show a tighter FIR-radio correlation than Seyferts (Roy et al. 1998; Condon 1992; Norris et al. 1988a), while the more energetic AGNs, such as quasars and radio galaxies, do not fit the correlation due to enhanced radio emission from the AGN (Sopp & Alexander 1991). The FIR-radio correlation for the present sample is shown in Figure 4, together with the fit from de Jong et al. (1985). The composite galaxies are also seen to follow the correlation. If the starburst origin for this correlation is correct, then star formation is again seen to be the dominant process in these galaxies.
4.7 Comparison with optical and NIR spectroscopy
As mentioned in Section 2, the sample of composite galaxies was chosen on the basis of the Veilleux & Osterbrock (1987) optical emission-line diagnostic diagrams. These diagrams are presented in Figure 5 and include starburst and AGN data from the literature, and also two photoionisation models developed in Paper 1 using MAPPINGS II (see Sutherland & Dopita 1993). The starburst model is based on the stellar atmosphere models of Hummer & Mihalas (1970) with a stellar temperature of 40 000 K, while the AGN model was created from a power-law ionising spectrum of the form , with . Other model parameters include a hydrogen density of 103 cm-3 and solar metallicity.
The galaxies that were detected with PTI do not appear to occupy any special position within Figure 5. However, we have also included on the diagnostic diagrams a mixing line from the low-ionisation starburst galaxies to the high-ionisation AGNs. The end points for the mixing line were determined by taking a median of the emission-line ratios for starbursts and AGNs (with a cut-off of applied to the AGN ratios to omit LINERS) taken from Veilleux & Osterbrock (1987 and references therein) and Veilleux et al. (1995). It becomes evident that an AGN contribution of 10% of the total emission of the galaxy can still account for the borderline position of the composite galaxies within the diagnostic diagrams. In fact, it has been recently found that the optical diagnostic diagrams are especially sensitive to the presence of an AGN. Kewley et al. (2000b) applied a mixing line from their photoionisation (or starburst) model to their shock (or AGN) model and found that objects with as little as 20% AGN contribution to their energy budget may be classified as AGN in the optical diagnostic diagrams.
Our study of NIR diagnostic diagrams in Paper 1 found that the line ratio diagram of [Fe II]/Pa vs [O I]/H was the most useful for distinguishing starbursts and Seyferts. This diagram is shown in Figure 6 with the same starburst and power-law models presented in Figure 5 and with the composite galaxies again differentiated by the PTI detections. The two galaxies detected with PTI, and for which we have NIR data, have the largest [Fe II](1.25m)/Pa ratios and therefore are most likely to be classified as AGNs from this diagram (see Paper 1).
5 Conclusions
We have presented arc-second radio images and long-baseline radio interferometer observations to extend our study of composite galaxies with ambiguous optical emission-line ratios. Extended radio morphology in radio-quiet galaxies is usually attributed to starbursts and we found that only two galaxies, ESO 440-IG058 south and ESO 343-IG013 south, showed extended emission with the ATCA. The radio continuum images were also used to derive spectral indices for the galaxies, with the average being which is typical of both starbursts and Seyferts.
Our interferometry observations revealed compact cores in five of the 20 galaxies observed, which may be due either to a weak (% of total flux density) AGN component or a radio-luminous supernova. The majority of non-detections for the sample does not rule out the existence of an AGN core but points to the starburst being the dominant flux density contribution within the galaxies. A similar result was found upon examining the FIR emission which we also found to be dominated by star formation.
From our radio observations and examination of the FIR fluxes we conclude that star formation dominates the composite galaxies, and we attribute only a small fraction of the emission ( 10%) to an AGN component. However, we have shown that an AGN contribution as small as this is still sufficient to identify the galaxies as composites within the optical diagnostic diagrams.
References
- (1) Ashby, M. L. N., Houck, J. R. & Matthews, K. 1995, ApJ, 447, 545.
- (2) Burgess, A. M. & Hunstead R. W. 1995 PubASA, 12, 227.
- (3) Condon, J. J. 1992, ARA&A, 30, 575.
- (4) Condon, J. J., Cotton, W. D., Greisen, E. W., Yin, Q. F., Perley, R. A., Taylor, G. B. & Broderick, J. J. 1998, AJ, 115, 1693.
- (5) Condon, J. J. & Yin, Q. F. 1990, ApJ, 357, 97.
- (6) Crawford, T., Marr, J., Partridge, B., & Strauss, M. A. 1996, ApJ, 460, 225.
- (7) de Bruyn, A. G. & Wilson, A. S., 1978 A&A, 64, 433.
- (8) de Jong, T., Klein, U., Wielebinski, R., and Wunderlich, E. 1985 A&A, 147, L6.
- (9) Deutsch, E. W. 1999, AJ, 118, 1882.
- (10) Dickey, J. M., & Salpeter, E. E. 1984, ApJ, 284, 461.
- (11) Dopita, M. A., Heisler, C. A., Lumsden, S., & Bailey, J. 1998, ApJ, 498, 570.
- (12) Dwek, E., Arendt, R. G., Fixsen, D. J., Sodroski, T. J., Odegard, N., Weiland, J. L., Reach, W. T., Hauser, M. G., Kelsall, T., Moseley, S. H., Silverberg, R. F., Shafer, R. A., Ballester, J., Bazell, D. & Isaacman, R. 1997, ApJ, 475, 565.
- (13) Edelson, R. A. 1987, ApJ, 313, 651.
- (14) Forbes, D. A. and Norris, R. P. 1998, 300, 757.
- (15) Gallimore, J. F., Baum, S. A., & O’Dea, C. P. 1997, Nature 388, 852.
- (16) Genzel, R., Lutz, D., Sturm, E., Egami, E., Kunze, D., Moorwood, A.F.M., Rigopoulou, D. Spoon, H. W. W., Sternberg, A., Tacconi-Garman, L. E., Tacconi, L. & Thatte, N., 1998, ApJ, 498, 579.
- (17) Genzel, R., Weitzel, L., Tacconi-Garman, L. E., Blietz, M., Cameron, M., Krabbe, A., Lutz, D. & Sternberg, A. 1995, ApJ, 444, 129.
- (18) Heckman, T. M., Gonzalez-Delgado, R., Leitherer, C., Meurer, G. R., Krolik, J., Wilson, A. S., Koratkar, A. & Kinney, A. 1997, ApJ, 482, 114.
- (19) Heisler, C. A., Dopita, M. A., Kewley, L. and Lumsden, S., 1999, Ringberg Workshop on Ultraluminous Galaxies, in press.
- (20) Heisler, C. A., Norris, R. P., Jauncey, D. L., Reynolds, J. E. & King, E. A., 1998, MNRAS, 300, 757.
- (21) Helou, G. & Bicay, M. D. 1993, ApJ, 415, 93.
- (22) Hill, T. L., Heisler, C. A., Sutherland R. & Hunstead, R. W. 1999, AJ, 117, 111 (Paper 1).
- (23) Hummer, D. G., & Mihalas, D. M. 1970, MNRAS, 147, 339.
- (24) Keto, E., Ball, R., Arens, J., Jernigan, G. and Meixner, M. 1992 ApJ, 389, 223.
- (25) Kewley, L., Heisler, C., Dopita, M. & Norris, R. 2000a ApJ, 530, 704.
- (26) Kewley, L. J., Heisler, C. A., Dopita, M. A. & Lumsden, S. 2000b ApJS, submitted.
- (27) Lançon, A. & Rocca-Volmerange, B. 1996, New Astronomy, 1, 215.
- (28) Leech, K. J., Penston, M. V., Terlevich, R. J., Lawrence, A., Rowan-Robinson, M. & Crawford, J., 1989, MNRAS, 240, 349.
- (29) Leech, K. J., Rowan-Robinson, M., Lawrence, A. & Hughes, J. D., 1994, MNRAS, 267, 253.
- (30) Lonsdale, C. J., Lonsdale, C. J., & Smith, H. E. 1992, ApJ, 391, 629.
- (31) Lonsdale, C. J., Smith, H. E., & Lonsdale, C. J. 1993, ApJ, 405, L9.
- (32) Morganti, R., Oosterloo, T. A., Reynolds, J. E., Tadhunter, C. N. & Migenes, V., 1997, MNRAS, 284, 541.
- (33) Mouri, H., Kawara, K. & Taniguchi, Y. 1993, ApJ 406, 52.
- (34) Mouri, H., Nishida, M., Taniguchi, Y., & Kawara, K. 1990, ApJ, 360, 55.
- (35) Neff, S. G., Hutchings, J. B., Stanford, S. A. and Unger S. W. 1990, AJ, 99, 1088.
- (36) Norris, R. P., Allen, D. A. & Roche, P. F. 1988a, MNRAS, 234, 773.
- (37) Norris, R. P., Heisler, C. A. & Roy, A. L. 2000, in preparation.
- (38) Norris, R. P., Kesteven, M. J., Wellington, K. J. & Batty, M. J. 1988b, ApJS, 67, 85.
- (39) Oliva, E., Origlia, L., Kotilainen, J. K., & Moorwood, A. F. M. 1995, A&A, 301, 55.
- (40) Roy, A. L., Norris, R. P., Kesteven, M. J., Troup, E. R. and Reynolds, J. E. 1998, MNRAS, 301, 1019.
- (41) Rush, B., Malkan, M. A., & Spinoglio, L. 1993, ApJS, 89, 1.
- (42) Sault, R. J., Tueben, P. J., & Wright, M. C. H. 1995, in Astronomical Data Analysis Software and Systems IV, eds. R. Shaw, H. E. Payne, J. J. E. Hayes, ASP Conf. Ser. 77, 433.
- (43) Sanders, D. B. & Mirabel, I. F., 1996, ARAA, 34, 749.
- (44) Sanders, D. B., Soifer, B. T., Elias, J. H., Madore, B. F., Matthews, K., Neugebauer, G. & Scoville, N. Z., ApJ, 1988, 325, 74.
- (45) Simpson, C., Forbes, D. A., Baker, A. C. & Ward, M. J. 1996, MNRAS, 283, 777.
- (46) Slee, O. B., Sadler, E. M., Reynolds, J. E., & Ekers, R. D. 1994, MNRAS, 269, 928.
- (47) Smith, D. A., Herter, T., & Haynes, M. P. 1998, ApJ, 494, 150.
- (48) Smith, H. E., Lonsdale, C. J. & Lonsdale, C. J. 1998a, ApJ, 492, 137.
- (49) Smith, H. E., Lonsdale, C. J., Lonsdale, C. J. & Diamond, P. D. 1998b, ApJ, 493, L17.
- (50) Sopp, H. M., & Alexander, P. 1991, MNRAS, 251, 14p.
- (51) Sramek, R. A. & Weedman, D. W., 1986, ApJ, 302, 640.
- (52) Sutherland, R. S. & Dopita, M. A. 1993, ApJS, 88, 253.
- (53) Thatte, N., Quirrenbach, A., Genzel, R., Maiolino, R., and Tecza, M. 1997, ApJ, 490, 238.
- (54) van den Broek, A. C., van Driel, W., de Jong, T., Lub, J., de Grijp, M. H. K., & Goudfrooij, P. 1991, A&AS, 91, 61.
- (55) Veilleux, S., Kim, D. -C., Sanders, D. B., Mazzarella, J. M. & Soifer, B. T. 1995, ApJS, 98, 171.
- (56) Veilleux, S. & Osterbrock, D. E. 1987, ApJS, 63, 295.
- (57) Volk, H. J., 1989, A&A, 218, 67.
- (58) Weiler, K. W., Panagia, N. & Sramek, R. A. 1990, ApJ, 364, 611.
- (59) Wilkinson, P. N. & de Bruyn, A. G. 1990, MNRAS, 242, 529.
- (60) Wilson, A. S. 1988, A&A, 206, 41.
- (61) Wilson, A., Helfer, T., Haniff, C., & Ward, M. 1991, ApJ, 381, 79.
- (62) Wilson, A. S. & Ulvestad, J. S. 1982, ApJ, 263, 576.
- (63) Wunderlich, E., Wielebinski, R., Klein, U. 1987, A&AS, 69, 487.
- (64) Wynn-Williams, C. G., Becklin, E. E., & Scoville, N. Z., 1985, ApJ, 297, 607.
- (65) Yin, Q. F. & Heeschen, D. S. 1991, Nature, 354, 130.
| Galaxy | Optical position | z | ATCA | PTI | |
|---|---|---|---|---|---|
| RA(J2000) | Dec(J2000) | Int. Time | Obs | ||
| (min) | |||||
| NGC 232 | 00 42 45.9 | 23 33 36 | 0.023 | 228 | Y |
| NGC 1204 | 03 04 40.4 | 12 20 28 | 0.015 | Y | |
| ESO 550-IG025 N | 04 21 19.9 | 18 48 39 | 0.032 | 139 | Y |
| ESO 550-IG025 S | 04 21 20.0 | 18 48 56 | 0.032 | 139 | Y |
| NGC 1614 | 04 33 59.8 | 08 34 44 | 0.016 | Y | |
| ESO 374-IG032 | 10 06 04.5 | 33 53 08 | 0.034 | 108 | Y |
| IRAS 100573343 | 10 07 59.1 | 33 58 07 | 0.034 | 98 | Y |
| ESO 500-G034 | 10 24 31.4 | 23 33 11 | 0.013 | 101 | Y |
| ESO 436-G026 | 10 28 42.7 | 31 02 18 | 0.014 | 130 | Y |
| MCG+00-29-23 | 11 21 11.7 | 02 59 03 | 0.025 | N | |
| Mrk 739 (NGC 3758) | 11 36 29.1 | +21 35 48 | 0.030 | Y | |
| ESO 440-IG058 N | 12 06 51.7 | 31 56 47 | 0.023 | 167 | Y |
| ESO 440-IG058 S | 12 06 51.8 | 31 56 58 | 0.023 | 167 | Y |
| IRAS 122240624 | 12 25 04.0 | 06 40 53 | 0.026 | Y | |
| Mrk 52 (NGC 4385) | 12 25 42.6 | +00 34 23 | 0.0071 | Y | |
| MCG-02-33-098aaMCG-02-33-098 is the western galaxy of an interacting pair. The eastern galaxy, MCG-02-33-099 has an optical spectrum typical of a starburst. | 13 02 19.9 | 15 46 06 | 0.017 | 175 | Y |
| Mrk 1344 (NGC 4990) | 13 09 17.2 | 05 16 23 | 0.011 | Y | |
| NGC 5713 NbbThe southern nucleus of NGC 5713 has an optical spectrum typical of a starburst. | 14 40 11.1 | 00 17 02 | 0.0073 | Y | |
| NGC 5719 | 14 40 56.7 | 00 18 58 | 0.0058 | Y | |
| NGC 5937 | 15 30 46.6 | 02 49 32 | 0.0094 | Y | |
| ESO 527-IG07 EccThe western nucleus of ESO 527-IG07 has no published optical spectrum. | 20 04 31.3 | 26 25 40 | 0.035 | 175 | N |
| ESO 343-IG013 N | 21 36 11.1 | 38 32 33 | 0.019 | 197 | Y |
| ESO 343-IG013 S | 21 36 11.0 | 38 32 42 | 0.019 | 197 | Y |
| ESO 602-G025 | 22 31 25.3 | 19 02 05 | 0.025 | 208 | Y |
| Starbursts | |||||
| AKN 232 | 10 07 38.8 | +17 06 02 | 0.026 | Y | |
| Mrk 717 (IC 2551) | 10 10 40.3 | +24 24 51 | 0.021 | Y | |
| Mrk 529 (NGC 7532) | 23 14 22.2 | 02 43 39 | 0.010 | Y | |
| Seyferts | |||||
| Mrk 955 | 00 37 35.8 | +00 16 51 | 0.035 | Y | |
| NGC 3627 (M66) | 11 20 15.0 | +12 59 30 | 0.0024 | Y | |
| NGC 4569 (M90) | 12 36 49.8 | +13 09 46 | 0.00078 | Y | |
| Galaxy | Radio position | 3 cmaaThe 3 cm image has been convolved to the 6 cm beamwidth to approximate a scaled array. | 6 cm | 20 cmbbThe 20 cm flux densities are taken from the NVSS (Condon et al. 1998) | (6,3) | (20,6) | |
|---|---|---|---|---|---|---|---|
| RA(J2000) | Dec(J2000) | (mJy) | (mJy) | (mJy) | |||
| NGC 232 | 00 42 45.8 | 23 33 41 | 14.3 | 22.4 | 60.6 | 0.76 | 0.81 |
| NGC 1204 | 03 04 40.0 | 12 20 30 | 26.4 | ||||
| ESO 550-IG025 N | 04 21 20.0 | 18 48 39 | 7.2 | 10.5 | 28.3ccThe NVSS source is blended, and the 6 cm ATCA flux densities have been used to determine the relative contributions at 20 cm. | 0.64 | 0.80 |
| ESO 550-IG025 S | 04 21 20.0 | 18 48 57 | 3.2 | 5.2 | 13.3ccThe NVSS source is blended, and the 6 cm ATCA flux densities have been used to determine the relative contributions at 20 cm. | 0.83 | 0.76 |
| NGC 1614 | 04 34 00.0 | 08 34 45 | 63ddGriffith et al. (1995) | 138.2 | 0.64 | ||
| ESO 374-IG032 | 10 06 04.6 | 33 53 06 | 3.7 | 5.5 | 18.7ccThe NVSS source is blended, and the 6 cm ATCA flux densities have been used to determine the relative contributions at 20 cm. | 0.67 | 0.99 |
| IRAS 100573343 | 10 07 59.0 | 33 58 06 | 3.7 | 5.3 | 13.2 | 0.61 | 0.74 |
| ESO 500-G034 | 10 24 31.5 | 23 33 11 | 15.7 | 22.0 | 57.8 | 0.57 | 0.78 |
| ESO 436-G026 | 10 28 42.9 | 31 02 17 | 2.9 | 3.0 | 11.9 | 0.01 | 1.12 |
| Mrk 739 | 11 36 29.2 | +21 35 49 | 11.2 | ||||
| ESO 440-IG058 N | 0.3ee3 limit | 0.2ee3 limit | |||||
| ESO 440-IG058 S | 12 06 51.9 | 31 56 59 | 9.7 | 18.4 | 52.1 | 1.09 | 0.84 |
| IRAS 122240624 | 12 25 04.1 | 06 40 54 | 11.2 | ||||
| Mrk 52 | 12 25 42.8 | +00 34 23 | 14.8 | ||||
| MCG-02-33-098 | 13 02 19.7 | 15 46 04 | 5.6 | 7.7 | 22.1ccThe NVSS source is blended, and the 6 cm ATCA flux densities have been used to determine the relative contributions at 20 cm. | 0.54 | 0.86 |
| Mrk 1344 | 13 09 17.3 | 05 16 21 | 29.9 | ||||
| NGC 5713 | 14 40 11.3 | 00 17 26 | 81ddGriffith et al. (1995) | 159.9 | 0.55 | ||
| NGC 5719 | 14 40 56.3 | 00 19 07 | 58.7 | ||||
| NGC 5937 | 15 30 46.1 | 02 49 47 | 114.0 | ||||
| ESO 527-IG07 E | 20 04 31.0 | 26 25 39 | 4.0 | 6.1 | 12.8ccThe NVSS source is blended, and the 6 cm ATCA flux densities have been used to determine the relative contributions at 20 cm. | 0.72 | 0.60 |
| ESO 343-IG013 N | 21 36 10.9 | 38 32 33 | 2.6 | 3.2 | 7.9ccThe NVSS source is blended, and the 6 cm ATCA flux densities have been used to determine the relative contributions at 20 cm. | 0.35 | 0.73 |
| ESO 343-IG013 S | 21 36 10.6 | 38 32 43 | 5.6 | 7.8 | 18.0ccThe NVSS source is blended, and the 6 cm ATCA flux densities have been used to determine the relative contributions at 20 cm. | 0.56 | 0.68 |
| ESO 602-G025 | 22 31 25.5 | 19 02 04 | 7.4 | 14.2 | 46.5 | 1.11 | 0.96 |
| Starbursts | |||||||
| AKN 232 | 10 07 38.8 | +17 06 02 | |||||
| Mrk 717 (IC 2551) | 10 10 40.3 | +24 24 50 | 26.0 | ||||
| Mrk 529 (NGC 7532) | 23 14 22.3 | 02 43 42 | 11.6 | ||||
| Seyferts | |||||||
| Mrk 955 | 00 37 36.0 | +00 16 53 | 8.4 | ||||
| NGC 3627 (M66) | 11 20 16.8 | +12 58 46 | 141ffGregory et al. (1995) | 466ggThis is a complicated region where three NVSS sources are blended. | |||
| NGC 4569 (M90) | 12 36 49.6 | +13 09 57 | 73.1 | ||||
| Galaxy | Position of PTI detection | PTI flux | Total 13 cm | core/ | |
|---|---|---|---|---|---|
| RA(J2000) | Dec(J2000) | density | flux densityaaDerived from 6 cm flux density and (6,3) spectral index; however, if no ATCA data was available we used the 20 cm fluxes and assumed a spectral index of 0.7. | total | |
| (mJy) | (mJy) | ||||
| NGC 232 | 0.9 | 39.2 | 2% | ||
| NGC 1204 | 0.9 | 19.6 | 5% | ||
| ESO 550-IG025 | 04 21 18.3 | 18 48 49 | 1.9 | 26.2 | 7% |
| NGC 1614 | 0.9 | 102 | 0.9% | ||
| ESO 374-IG032 | 0.9 | 9.1 | 10% | ||
| IRAS 100573343 | 0.9 | 8.1 | 11% | ||
| ESO 500-G034 | 0.9 | 33.5 | 3% | ||
| ESO 436-G026 | 10 28 43.3 | 31 02 22 | 1.0 | 3.0 | 33% |
| MCG+00-29-23 | 5bbNorris et al. (1990) | ||||
| Mrk 739 | 0.9 | 8.3 | 11% | ||
| ESO 440-IG058 | 0.9 | 41.3 | 2% | ||
| IRAS 122240624 | 12 25 05.9 | 06 40 29 | 3.1 | 8.3 | 37% |
| Mrk 52 | 0.9 | 11.0 | 8% | ||
| MCG-02-33-098 | 0.9 | 11.5 | 8% | ||
| Mrk 1344 | 13 09 17.3 | 05 16 21 | 3.5 | 22.2 | 16% |
| NGC 5713 N | 0.9 | 119 | 0.8% | ||
| NGC 5719 | 0.9 | 43.5 | 2% | ||
| NGC 5937 | 0.9 | 84.5 | 1% | ||
| ESO 343-IG013 | 0.9 | 15.9 | 6% | ||
| ESO 602-G025 | 0.9 | 31.9 | 3% | ||
| Starbursts | |||||
| AKN 232 | 0.9 | ||||
| Mrk 717 | 0.9 | 19.2 | 5% | ||
| Mrk 529 | 0.9 | 8.6 | 10% | ||
| Seyferts | |||||
| Mrk 955 | 0.9 | 6.2 | 15% | ||
| NGC 3627 | 11 20 15.5 | +12 59 20 | 2.0 | 345 | 0.6% |
| NGC 4569 | 12 36 46.6 | +13 09 12 | 1.1 | 54.2 | 2% |
| Galaxy | |||
|---|---|---|---|
| M⊙ yr-1 | |||
| NGC 232 | 0.62 | 3.1 | |
| NGC 1204 | 0.12 | 0.6 | |
| ESO 550-IG025 | 0.88 | 4.4 | |
| NGC 1614 | 3.39 | 16.9 | |
| ESO 374-IG032 | 0.33 | 1.7 | |
| IRAS 100573343 | 0.32 | 1.6 | |
| ESO 500-G034 | 0.19 | 1.0 | |
| ESO 436-G026 | 0.03 | 0.2 | |
| MCG+00-29-023 | |||
| Mrk 739 | 0.20 | 1.0 | |
| ESO 440-IG058 | 0.51 | 2.5 | |
| IRAS 122240624 | 0.15 | 0.8 | |
| Mrk 52 | 0.01 | 0.07 | |
| MCG-02-33-098 | 0.19 | 0.9 | |
| Mrk 1344 | 0.07 | 0.4 | |
| NGC 5713 | 0.21 | 1.0 | |
| NGC 5719 | 0.59 | 0.3 | |
| NGC 5937 | 0.19 | 0.9 | |
| ESO 527-IG07 E | 0.61 | 3.1 | |
| ESO 343-IG013 | 0.22 | 1.1 | |
| ESO 602-G025 | 0.46 | 2.3 |
 |
 |
|
 |
 |
 |
 |
|
 |
 |
 |
 |
|
 |
 |
 |
 |
 |
|
 |

 |
 |
|
 |
