Chemo-spectrophotometric evolution of spiral galaxies:
IV. Star formation efficiency and effective ages of spirals
Abstract
We study the star formation history of normal spirals by using a large and homogeneous data sample of local galaxies. For our analysis we utilise detailed models of chemical and spectrophotometric galactic evolution, calibrated on the Milky Way disc. We find that star formation efficiency is independent of galactic mass, while massive discs have, on average, lower gas fractions and are redder than their low mass counterparts; put together, these findings convincingly suggest that massive spirals are older than low mass ones. We evaluate the effective ages of the galaxies of our sample and we find that massive spirals must be several Gyr older than low mass ones. We also show that these galaxies (having rotational velocities in the 80-400 km/s range) cannot have suffered extensive mass losses, i.e. they cannot have lost during their lifetime an amount of mass much larger than their current content of gas+stars.
keywords:
Galaxies: general - evolution - spirals - photometry - stellar content1 Introduction
The Star Formation Rate (SFR) is the most important and the less well understood ingredient in studies of galaxy evolution. Despite more than 30 years of observational and theoretical work, the Schmidt law still remains popular among theoreticians and compatible with most available observations (e.g. Kennicutt 1998a).
It is well known that there are systematic trends in the SF history of the Hubble sequence: The ratio of the current SFR to the past average one (integrated over the galaxy’s age) increases as one goes from early to late type galaxies, albeit with a large dispersion within each morphological type. The Hubble sequence seems to be determined by the caracteristic timescale for star formation, with early type galaxies forming their stars in shorter timescales than those of late types. However, this simple description of the Hubble sequence fails to answer two important, and probably related, questions: i) what determines the caracteristic timescale for SF in galaxies? and ii) what is the role (if any at all) of a galaxy’s mass?
Gavazzi et al. (1996) found an anti-correlation between the SFR per unit total mass and galactic luminosity; part of this trend may reflect the aforementioned dependence of SFR on Hubble type, but it may also be that this trend is fundamentally related to the galactic mass. In a recent work Bell and de Jong (2000) use a large sample of spiral galaxies with resolved optical and near-infrared photometry and find that it is rather surface density that drives the star formation history of galaxies, while mass is a less important parameter.
Photometric studies alone cannot lift the age-metallicity degeneracy, namely the fact that young and metal-rich stellar populations may be redder than old and metal-poor ones. Studies of the chemical aspects of galaxy evolution (i.e. gas fractions, star formation rates, metal abundances) can help to tackle the problem from a different angle, but they are also limited by the unknown history of gaseous flows from and to the system. A study combining elements from both photometric and chemical evolution offers the best chances to understand this complex situation.
In this work we study the star formation history of spirals by using detailed models of chemical and spectro-photometric galactic evolution. The numerical code has been presented in detail elsewhere (Boissier and Prantzos 1999, hereafter Paper I) and is only briefly described in Sec. 2. It has been successfully applied to the modelling of global properties of spirals (Boissier and Prantzos 2000, hereafter Paper II), as well as to the corresponding abundance and photometric gradients (Prantzos and Boissier 2000, herefter Paper III). Based on the recent work of Boselli et al. (2000), we use here a large and homogeneous sample of data for normal spirals (presented in Sec. 3), ideally suited for the purpose of this work. Our results and the comparison to the observations are presented in Sec. 4. They suggest that galactic mass is the main driver of galactic evolution, although local surface density may also play a role. We argue that massive galaxies are, on average, older than less massive ones, based on the fact that star formation efficiencies seem to be independent of galactic mass, while gas fractions are systematically low in massive spirals. Based on the observed star formation efficiencies and gas fractions, we derive in Sec. 5 corresponding galactic ages by using simple analytical models of galactic chemical evolution, taking into account gaseous flows. We find that low mass spirals must be several Gyr younger than massive ones. Also, we find that spirals with rotational velocities in the 80-400 km/s range must not have suffered extensive mass losses during their past history. Our conclusions are summarized in Sec. 6.
2 Modelling the evolution of disc galaxies
2.1 The model and the Milky Way
In Boissier and Prantzos (1999, paper I), we presented a model for the chemical and spectrophotometric evolution of the Milky Way disc. We recall here the main ingredients of the model.
The disc is simulated as an ensemble of concentric, independently evolving rings, slowly built-up by infall of primordial composition. For each ring we solve the classical equations of chemical evolution (e.g. Pagel 1997) without the assumption of Instantaneous Recycling Approximation. We use: stellar lifetimes from Schaller et al. (1992); the yields of Woosley and Weaver (1995) for massive stars and Renzini and Voli (1981) for intermediate mass stars; SNIa producing Fe with a rate given in Matteucci and Greggio (1986); and the Initial Mass Function of Kroupa et al. (1993) between 0.1 M⊙ and 100 M⊙. The adopted star formation rate (SFR) varies with gas surface density and radius as:
| (1) |
where is the rotational velocity, assumed to be 220 km/s in the largest part of the Milky Way disc. This radial dependence of the SFR is suggested by the theory of star formation induced by density waves in spiral galaxies (e.g. Wyse and Silk 1989). The efficiency of the SFR (Eq. 1) is fixed by the requirement that the observed local gas fraction, at R=8 kpc from the Galactic centre (0.2), is reproduced at T=13.5 Gyr (our adopted value for the age of the local disc).
The disc is built up by infall with a rate exponentially decreasing in time, and a characteristic time-scale increasing with radius (as to mimic the inside-out formation of the disc). The relation between and (total surface density) is shown on Fig. 1 and is a posteriori justified, since it is crucial in shaping the various radial profiles (of gas, SFR, abundances, etc) of the disc, which compare favourably to observations.
The spectro-photometric evolution is followed in a self-consistent way, with the metallicity dependent stellar tracks from the Geneva group (Schaller et al. 1992, Charbonnel et al. 1996) and stellar spectra from Lejeune et al. (1997). Dust absorption is included according to the prescriptions of Guiderdoni et al. (1998) and assuming a “sandwich” configuration for the stars and dust layers.
It turns out that the number of observables explained by the model is much larger than the number of free parameters. In particular the model reproduces present day “global” properties (amounts of gas, stars, SFR, and supernova rates), as well as the current disc luminosities in various wavelength bands and the corresponding radial profiles of gas, stars, SFR and metal abundances; moreover, the adopted inside-out star forming scheme leads to a scalelength of 4 kpc in the B-band and 2.6 kpc in the K-band, in agreement with observations (see paper I).
2.2 Scaling relations
For a simplified extension of the model to the the case of other disc galaxies we adopt the “scaling properties” derived by Mo, Mao and White (1998, hereafter MMW98) in the framework of the Cold Dark Matter (CDM) scenario for galaxy formation. For the details, the reader should refer to MMW98 and Boissier and Prantzos (2000, paper II). Discs form inside non baryonic dark matter haloes of various masses and concentration factors. Assuming constant disc to halo mass ratios (here taken to be =0.05), discs are characterized by two parameters: , the circular velocity measuring the mass of the disc, and , the spin parameter measuring its angular momentum. A disc is described by its scale-length and its central surface density , which can be related to the ones of our Galaxy (designated by ) by:
| (2) |
and
| (3) |
The total mass of the disc is proportional to , but independent of . The distribution deduced from numerical simulations (see MMW98 and references therein) presents a maximum at and extends from 0.01 to 0.20. Since the value of is not far from the peak value, we explored here values of in the range 1/3 to 3 . Assuming that and are independent, we constructed models with velocities in the observed range 80 to 360 km/s. We calculated the velocity profile resulting from the disc plus an isothermal dark halo, and we used Equ. 1 to calculate self-consistently the SFR (with the same coefficient , “calibrated” on the Milky Way).
At this point it should be noticed that our scaling relations (2 and 3) are based on the assumption that angular momentum is conserved during the evolution of the disk. Numerical hydrodynamical simulations of galaxy formation (e.g. Navarro and Steinmetz 1999 and references therein) do not support this idea; indeed, it is found that as the baryonic halo gas cools down and collapses to the disk it loses most of its angular momentum. In those conditions, the final configuration of the disk cannot be related in a simple way to the initial of the halo. However, such simulations lead , in general, to disk sizes much smaller than observed. It is possible that star formation and feedback are not properly described in those simulations. For instance, Sommer-Larsen, Gelato and Vedel (1999) found that delaying the cooling of the gas reduces the loss of angular momentum. Since the situation is not clear yet, we make here the assumption of disk evolution at constant angular momentum, a posteriori justified by the fact that the resulting disk sizes are in agreement with observations (see Paper II). For a more detailed discussion of these issues, see also Cole et al. (2000).
2.3 Infall timescales
The infall rate in our models is exponentially dependent on time, with a time-scale that depends on the surface mass density and is calibrated on the Milky Way disc (see Fig. 1); as explained in paper II, we found that a dependence on the total mass of the galaxy is necessary in order to reproduce the observations of present-day discs. We consider that all the galaxies started forming their stars 13.5 Gyr ago and that the formation of their exponential discs (characterized by and ) was completed at the present epoch. Notice that the value of T=13.5 Gyr plays no essential role in the results of this work (values in the 10-15 Gyr range would lead to quite similar conclusions); these results depend mainly on the infall timescales. The more massive galaxies are characterized by shorter formation time-scales, while less massive galaxies are formed on longer ones (Fig. 1). This assumption turned out to be a crucial ingredient of our models, allowing to reproduce an impressive amount of observed properties of spirals that depend on mass (or ): colours, gas fractions, abundances and integrated spectra. Those observables are thoroughly presented in paper II, while some of them are revisited in this work. In Prantzos and Boissier (2000, paper III in the series), we show that this model also reproduces fairly well the observed colour and abundance gradients in spirals.
We notice that Bell and de Jong (2000) suggested recently that the observed colour gradients of disc galaxies correlate very well with the local surface density, in the sense that inner and denser regions are older. Our assumption about the infall timescale agrees, at least qualitatively, with their findings.
We stress that infall timescales are inputs to the model, and adjusted as to reproduce observations. Star formation timescales are outputs of the model (resulting from the adopted prescriptions for infall and SFR) and are presented in Sec. 4.1.

3 Comparison to observations
3.1 The observational sample
The sample of galaxies analysed in this work, which has been extracted from
the large multifrequency database of nearby galaxies of Gavazzi and Boselli,
is extensively described in Boselli et al. (2000).
Here we give just a brief description of the sample selection criteria:
we refer the reader to Boselli et al. (2000) for the detailed references
on the data and on their analysis.
Galaxies analysed in this work are taken from the Zwicky catalogue (CGCG, Zwicky et al. 1961-1968)(mpg 15.7). They are either late-type (typeS0a) members of 3 nearby (recession velocity c 8000 km s-1) clusters (Cancer, A1367, Coma), or located in the relatively low-density regions of the Coma-A1367 supercluster (11h30m RA 13h30m; 18odec32o) as defined in Gavazzi et al. (1999a). To extend the present study to lower luminosities, we include in the sample the late-type Virgo cluster galaxies brighter than mpg 14.0 listed in the Virgo Cluster Catalogue as cluster members (VCC, Binggeli et al. 1985). Furthermore VCC galaxies with 14.0 mpg 16.0 included in the “ISO” subsample described in Boselli et al. (1997a) and CGCG galaxies in the region 12h RA 13h; 0odec18o but outside the VCC, are considered.
To avoid systematic environmental effects we consider the subsample of late-type galaxies whose HI deficiency (defined as = log(), the ratio of the HI mass to the average HI mass in isolated objects of similar morphological type and linear size, see Haynes & Giovanelli 1984) is 0.3, typical of unperturbed, isolated galaxies. The final combined sample comprises 233, mainly “normal” galaxies.
We assume a distance of 17 Mpc for the members (and possible members) of Virgo cluster A, 22 Mpc for Virgo cluster B, 32 Mpc for objects in the M and W clouds (see Gavazzi et al. 1999b). Members of the Cancer, Coma and A1367 clusters are assumed at the distance of 62.6, 86.6 and 92 Mpc respectively. Isolated galaxies in the Coma supercluster are assumed at their redshift distance adopting = 75 km s-1 Mpc-1.
For the 233 optically selected galaxies, data are available in several bands as follows: 100% have HI (1420 MHz) and 99% H band (1.65 m) data, while a much coarser coverage exists in the UV (2000 Å)(29 %), CO (115 GHz)(38%) and H (6563 Å) (65%), as shown in Table 1 and 2 of Boselli et al. (2000). The distribution of the sample galaxies in the different morphological classes is given in Table 3 of Boselli et al. (2000).
As previously discussed, the present sample is optically selected and thus can be biased against low surface brightness galaxies; the inclusion of the Virgo cluster should in principle favor the presence of some low surface brightness galaxies, not easily detectable at higher distances. Being volume limited, the sample is not biased toward bright, giant spirals, but it includes also dwarfs and compact sources. Its completeness at different wavelengths makes this a unique sample suitable for statistical analysis.
3.2 Data analysis
H and UV fluxes, corrected for extinction (and [NII] contamination) as described in Boselli et al. (2000), are used to estimate star formation rates through population synthesis models given in that work; a power-law IMF of slope -2.5 with a lower and upper mass cutoff of 0.1 M⊙ and 80 M⊙, respectively, is adopted. Its high mass part is quite similar to the one of the IMF of Kroupa et al. (1993), adopted in our models. Given the uncertainty in the UV and H flux determination, in the extinction correction and in the transformation of the corrected fluxes into SFRs via population synthesis models, we estimate an uncertainty of a factor of 3 in the determination of the SFR.
The total gas content of the target galaxies, HIH2, has been determined from HI and CO measurements. CO (at 2.6mm) fluxes have been transformed into H2 masses assuming a standard CO to H2 conversion factor of 1.0 1020 mol cm-2 (K km s-1)-1 (Digel et al. 1996). For galaxies with no CO measurement, we assume that the molecular hydrogen content is 10% of the HI, as estimated from isolated spiral galaxies by Boselli et al. (1997b). The total gas mass has been corrected for He contribution by 30%. HI fluxes are transformed into neutral hydrogen masses with an uncertainty of 10%. The average error on CO fluxes is 20%; the error on the H2 content, however, is significantly larger (and difficult to quantify) due to the poorly known CO to H2 conversion factor (see Boselli et al. 1997b).
Galaxy colours have been determined from broad band near-IR and optical photometry. Near-IR (H band) images are available for 230 of the 233 sample galaxies, while B images or aperture photometry for 214 objects. H and B magnitudes have been corrected for extinction as in Gavazzi & Boselli (1996). No correction has been applied to galaxies of type later than Scd. The estimated error on B and H magnitudes is 15 %.
Rotational velocities have been determined from the HI line width at 21cm, and corrected for inclination as in Gavazzi (1987). To avoid large systematic errors, we estimate rotational velocities only for galaxies with inclinations 30 deg and with the 21cm line width accurately determined (double or single horned profile with high signal-to-noise). The uncertainty on the determination of the rotational velocity is 15 km s-1.
In summary, we have a homogeneous sample of 233 normal (non-perturbed) disc galaxies. For 96 of them, we evaluated all the quantities of interest in this work: Blue magnitude , total mass , total gas mass , star formation rate and rotational velocity . We shall see below how our models fit those properties and what kind of inferences can be made on the star formation history of those galaxies.
3.3 Mass-driven colours and gas fractions
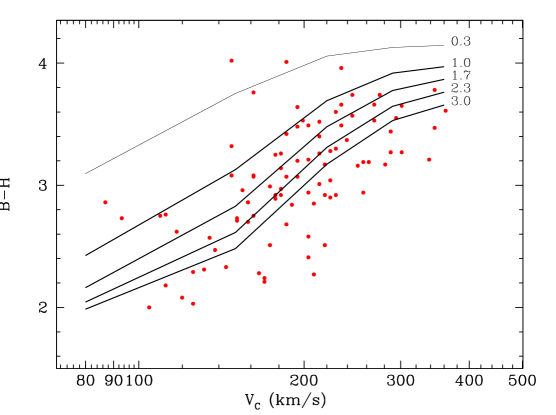
In Fig. 2 we compare our model results to the colours of our galaxy sample. A clear correlation is obtained between and , with the more massive discs being, on average, redder than their lower mass counterparts. Our models (solid curves) reproduce naturally the observed correlation, since by construction the more massive discs form their stars earlier (Fig. 1). The corresponding timescales for star formation will be discussed in Sec. 4.1. The observed dispersion in the lower panel of Fig. 2 can be accounted for by the range of values in our models, but only partially. Discs with lower are more compact, have higher central surface densities and evolve earlier than those with larger . Obviously, values larger than 3 (the largest value used here), would lead to even smaller values than the models displayed on Fig. 2, possibly accounting for the rest of the scatter.
We notice that our models do take extinction by dust into account (with the prescriptions presented in Sec. 2.1), and that extinction contributes somewhat (by 0.5 mag) in redenning the most massive discs in our models, which have relatively large amounts of metals. However, we insist on the fact that it is age, not extinction, which is mainly responsible for the trends of our models on Fig. 2.
In Fig. 3 we present two important pieces of data, on which the main argument of this paper is based. In the upper panel, we show the ratio (mass of gas to H-band luminosity) vs rotational velocity . Since reflects the mass of the stellar population (Gavazzi et al. 1996), this ratio is a measure of the gas fraction of the system. Despite the large scatter, it is clear that a correlation does exist, the more massive galaxies being, in general, gas poor. Our model results can fairly well describe the observations, accounting for both the slope and the dispersion of the vs relation.
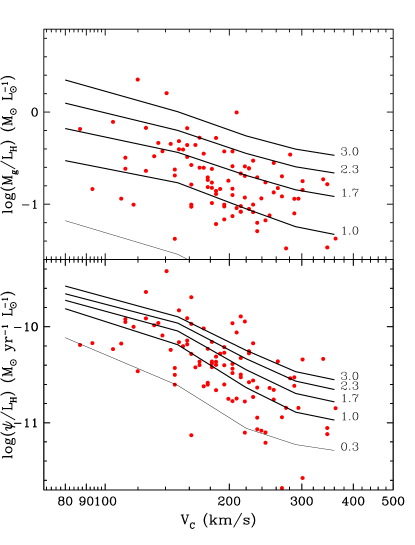
In the lower panel of Fig. 3 we plot the ratio (current SFR to band luminosity) vs. . As discussed in several places (e.g. Kennicutt 1998a), this ratio is a measure of the parameter , the ratio of the current SFR to the past average one. Massive galaxies display smaller , and thus lower values, than their low mass counterparts. This means that they formed their stars at much higher rates in the past. Again, our results compare fairly well with the data, concerning both the slope and the scatter of the correlation. For a given , large discs have larger gas fractions today and were less active in the past than their lower counterparts. As we shall see in Sec. 4.3, and discuss in Sec. 5, when the two panels of Fig. 3 are combined, they suggest quite convincingly that low mass spirals are on average younger than massive ones.
At this point, we notice that Gavazzi and Scodeggio (1996) already advanced a similar hypothesis to explain the observed colors of galaxies as a function of their H-band luminosity (a mesure of their dynamical mass according to them). Gavazzi et al. (1996) came to similar conclusions and suggested that mass is the main parameter of galaxy evolution, on the basis of multiwavelength observations concerning a variety of disc properties (colours, gas content, star formation rate, radius, surface brightness).
4 Star formation histories in discs
4.1 Formation time-scales
The Hubble sequence of galaxies is usually interpreted in terms of different star formation timescales (e.g. Kennicutt 1998a), although such an interpretation leaves unclear the role of the galaxy’s mass (Prantzos 2000). In order to put our results in that context, we performed an exponential fit to the star formation histories of our model galaxies (excluding the first 2 Gyr, where such a fit turns out to be inadequate). The resulting timescales are shown in Fig. 4. Notice that in some models the SFR is continuously increasing with time, resulting in negative caracteristic timescales. For that reason we present , which has the advantage of varying continuously when going from a SFR increasing in time to one decreasing with time. For an exponential star formation rate, , is equal to (where ) and can be considered as the normalized rate of change of the SFR. Obviously, the larger is , the earlier the galaxy forms its stars.

As can be seen on Fig. 4, massive galaxies in our models form their stars on shorter timescales than their lower mass counterparts. This general trend is somewhat modulated by the spin parameter : discs with smaller (i.e. more compact) have larger than discs with larger of similar rotational velocity. The most massive discs of our simulations (=360 km/s) have decreasing SFR with 4-5 Gyr. Discs with 200 km/s have long timescales, of the order of 10 Gyr, i.e. essentially constant SFR. Finally, low mass discs ( 100 km/s) have SFR increasing in time, with caracteristic timescales -0.2 to -0.5 Gyr-1.
4.2 The evolution of the star formation efficiency
What is the reason for the vastly different SF timescales obtained in our models as a function of ? Is the overall SF efficiency directly affected by the mass of the galaxy? An inspection of Eq. 1 suggests that this cannot be the reason. Indeed, at the caracteristic radius of the disc , the local efficiency is:
| (4) |
since from Eq. 2 and from Eq. 3. In other terms, the SF efficiency at varies very little with and depends much more on than on . Since the value of any intensive quantity (like SF efficiency) at is typical of the whole disc, it is expected that the global SF efficiency also depends little on . In order to show this quantitatively, we plot in Fig. 5 the evolution of the global SF efficiency of our models as a function of time. We show the results for 3 values of (1/3, 1 and 3 times ) and three values of (80, 220 and 360 km/s, respectively). We compare our results at T=13.5 Gyr to estimates of in our sample of nearby spirals (presented in Sec. 4.3) . The following points should be noted concerning our models:
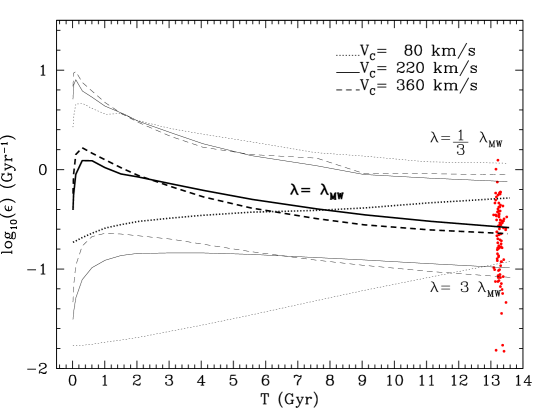
i) The efficiency depends very little on , especially during the last half of the history of the galaxy.
ii) is mainly determined by : “compact” galaxies have higher efficiency because of their smaller size (, for a given ) and larger gas surface density at the caracteristic radius . At T=13.5 Gyr, the variation of our values due to can fully account for the dispersion in measured in nearby spirals.
iii) The SF efficiency in compact galaxies (low ) presents a peak at early times and then decreases. This happens because the star formation migrates to outer regions (due to the inside-out disc formation scheme) where the local SF efficiency is lower (because of lower surface densities and of the 1/R factor). In more extended galaxies (larger ) does not present such a decrease because local properties vary little with radius.
iv) For the lowest disc velocities , may increase with time. This is due to the adopted form of infall: the gas surface density increases considerably when the gas arrives finally in the disc (which may take a very long time in the case of the largest values and lowest values, see Fig. 4).
The main point of this section is that in our models the SF efficiency does not depend directly on the mass of the galaxy. The range of span by our models during galactic evolution is due to and , not to ; the most important of the two parameters is . Of course, is adjusted to , so that the observations of Fig. 2 and 3 (and many others, presented in Paper II) are reproduced. This is a crucial ingredient for the success of our models, and we discuss its implications in Sec. 5.
4.3 Gas fraction and star formation efficiency
The analysis of Sec. 4.1 and Sec. 4.2 lead to an important conclusion: the success of our models is to be interpreted in terms of mass-dependent SF timescales; but this is not due to any explicit dependence of SF efficiency on galaxy mass. Indeed, the SF efficiency of our models is virtually independent of mass during most of galactic history, and in particular at the present time. Is this supported by observations?
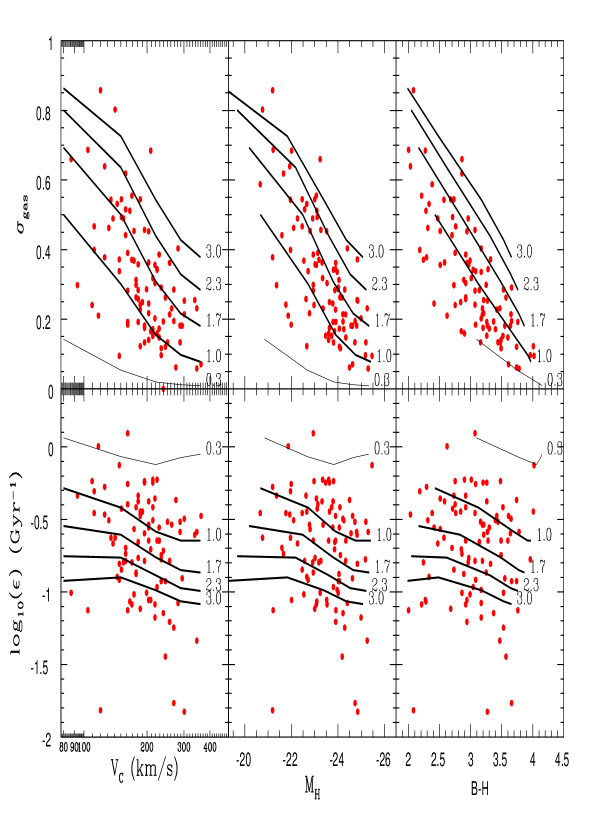
In Fig. 6 we display our data of Fig. 3, this time in a more “physical” presentation, appropriate for a quantitative discussion (see Sec. 5). The gas fractions (upper panels) and SF efficiency (lower panels) are presented as a function of rotational velocity (left panels), H-magnitude (middle panels) and colour (right panels).
The gas fraction (where the total mass is the mass of stars + gas) is obtained by converting the luminosity to star mass through the mass to light ratio obtained in our models. This value is in the 0.3-0.6 range in solar units (0.35 for =80 km/s, 0.47 for 220 km/s and 0.56 for =360 km/s). Despite the uncertainties, a clear trend is present in the upper panel: the more massive, luminous and red a galaxy is, the smaller is its gas fraction. Notice that a similar trend is obtained by McGaugh and de Blok (1997) and Bell and de Jong (2000). Our model results are in excellent agreement with the data, although we have some difficulty in reproducing blue and gas poor discs (with 2.5 and 0.4).
The SF efficiency of our observed galaxies is obtained by simply dividing the SFR with the gas mass . We notice that the uncertainties in deriving are rather large: those concerning the SFR are quite large (a factor of 3), whereas those of the gas mass at least of 20 %. As a result, the observationally derived scatter of , as appears on Figs. 5 and 6, is certainly larger that the real one. It is clear, however, that the SF efficiency does not seem to be correlated with the mass or the colours of spirals. The scatter in the observed values of (a factor of 10), should be compared to the range of 60 span by galaxy mass (since the mass of the disc ) or the range of five magnitudes in H-luminosity. Our model SF efficiencies at T=13.5 Gyr, also displayed in Fig. 6 (lower panel, solid curves), show no dependence on mass or colour. They also reproduce the observed dispersion, the more compact discs (smaller ) being the more efficient in turning their gas into stars.
The upper and lower panels of Fig. 6, when combined, point to an important conclusion: since the SF efficiency is independent of galactic mass (or luminosity), the fact that low mass galaxies have larger gas fractions today may only be due to their smaller ages. This is the most straightforward interpretation, independent of any theoretical considerations (except for the implicit assumption that the SF efficiency has remained constant during the galaxy’s history). This conclusion is corroborated by an independent observable, namely that low mass galaxies are, in general, bluer than more massive ones. Notice that the latter observable concerns also elliptical galaxies, but the well known problem of the age-metallicity degeneracy does not allow to conclude in that case. In the case of spirals, the situation is even worse in principle, because colours may be affected by the presence of dust (presumably more abundant in massive spirals). Because of this complication, the observed gas fraction (smaller in large spirals) is not sufficient in itself to lift the age-metallicity degeneracy. However, when combined with the fact that the SF efficiency is independent of galactic mass (as argued here), the degeneracy is lift, and the aforementionned conclusion is naturally obtained.
Before turning to a more detailed discussion of our findings, we would like to point out that similar results are obtained in other recent works. For instance, McGaugh and de Blok (1997) find a clear trend between the gas fraction and the magnitude of their galaxy sample, that they describe by the relation =0.12 (+23). This relationship is shown in Fig. 7 (upper panel, dashed line), along with the McGaugh and de Blok (1997) data for normal spirals and our data for normal spirals. It can be seen that there is a very good agreement between the two data sets. We notice that our models fit the observations of McGaugh and de Blok (1997) fairly well (see Fig. 13 of Boissier and Prantzos 2000).
In the lower panel of Fig. 7 we show the SF efficiency, both for our data set and the one of Kennicutt (1998b). Notice that Kennicutt (1998b) gives the average SFR surface density and average gas surface density of normal spirals, i.e. the integrated quantities are divided by the disc surface aerea (within the optical radius). Obviously, the ratio gives the overall SF efficiency (since the disc aerea cancels out). As can be seen in Fig. 7, Kennicutt’s values of the SF efficiency are slightly larger than ours (by a factor of ), and have a smaller dispersion in the adopted logarithmic scale. Taking into account the various uncertainties in estimating the SFR from the data (see Sec. 3), such a discrepancy between Kennicutt’s results and ours is not unexpected. But the important point is that Kennicutt’s values are also independent of the galaxy luminosity and, by virtue of the Tully-Fisher relation, on the galaxy’s mass.

The anti-correlation between gas fraction and luminosity in spirals was noticed by several authors (e.g. Gavazzi et al. 1996, McGaugh and de Blok 1997, Bell and de Jong 2000, Boselli et al. 2000, etc.). Based on two independent samples, we showed here that the SF efficiency of spirals is independent of their mass. The two findings combined, point to small discs being younger, on average, than massive ones. Our model, presented in Sec. 3.2, nicely explains these features (and several other, presented in papers II and III). However, one may argue that the complex interdependence between the adopted infall and SFR prescriptions makes a straightforward interpretation difficult; he/she may also argue that other types of models could also account for the observations and give a different interpreration for the same data (e.g. by invoking outflows). For that reason, we discuss in the next section this issue on the basis of simple analytical models of galactic chemical evolution and we make a very rough evaluation of the “ages” of the galaxies in our sample. Our purpose is not to derive the exact ages of the galaxies, but rather to have an order of magnitude estimate and, in particular, to check whether there is any trend of the derived ages with galactic mass.
5 Galactic Ages
In the framework of simple models of galactic chemical evolution adopting the Instantaneous Recycling Appproximation (IRA), one may obtain analytical solution for various quantities. In particular, provided that the Star Formation Rate is proportional to the gas mass , i.e.
| (5) |
one may obtain a relationship between the gas fraction and time T (assuming that the SF efficiency is constant in time). The form of this relationship depends on further assumptions about the evolution of the system, i.e. on the possibility of allowing for gas flows in or outside the “box” (e.g. Pagel 1997).
Assuming that the galaxies of our sample have evolved as simple, homogeneous, “boxes”, we consider three possibilities: a “closed box” (all the gas is present from the very beginning), an “infall” model (where gas mass is continuously added to the system) and an “outflow” model (with gas continuously leaving the system). In the cases of gaseous flows, further assumptions about the corresponding flow rates are required in order to obtain analytical solutions. More specifically:
a) Closed Box: In that case, we have
| (6) |
where the return fraction accounts for the gas returned by stars to the interstellar medium; for the IMF of Kroupa et al. (1993) adopted here we have 0.32.
b) Infall: An analytical solution is easily obtained if it is assumed that the infall rate just balances the gas depletion due to star formation. As we have shown in Paper II, with detailed numerical models reproducing a large body of observational data, this situation describes rather well the largest period in the lifetime of most spiral galaxies. In that case, we have:
| (7) |
c) Outflow: Analytical solutions may be obtained by assuming that the outflow rate is proportional to the SFR: . In that case, we have:
| (8) |
We shall assume here that the outflow rate is equal to the SFR, i.e. =1 (since, for higher outflow rates, we obtain ridiculously low galactic ages).
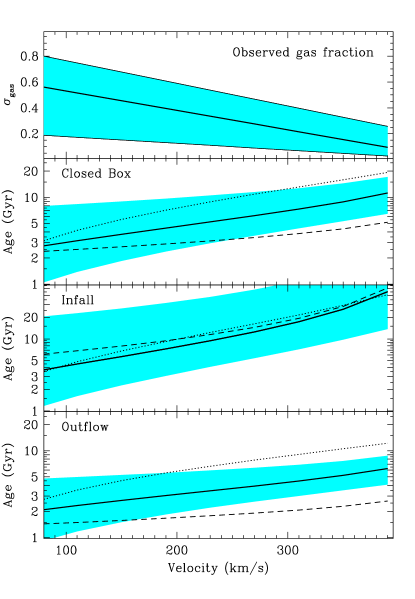
For each of the three scenarios, we shall consider five combinations between the observed gas fraction and SF efficiency, in order to derive galactic age T through Eqs. 6, 7 and 8. For the gas fraction vs. rotational velocity, we adopt the three curves of the upper panel of Fig. 8, corresponding roughly to the mean trend and the upper and lower bounds of the observations, respectively. For each of those three curves, we derive the corresponding galactic ages by using a SF efficiency =0.3 Gyr-1 (the mean value of the observations in Fig. 6 and 7); in that way, we obtain the shaded regions in Fig. 8, with the thick curve corresponding to the mean trend, the largest ages to the lowest gas fractions and vice versa. We perform two more calculations. For the first, we adopt the high gas fractions (uppermost curve in the upper panel of Fig. 8), combined to a low SF efficiency =0.1 Gyr-1 (a reasonable lower bound for the observations of Fig. 6 and 7); in that way we obtain the dotted curves in Fig. 8. Finally, we adopt the low gas fractions (lower curve in the upper panel of Fig. 8), combined to a high SF efficiency =1 Gyr-1 (a reasonable upper bound for the observations of Fig. 6 and 7); in that way we obtain the dashed curves in Fig. 8.
An inspection of the results, plotted in the three lower panels of Fig. 8, shows that the derived “effective” galactic age is a monotonic function of rotational velocity in all cases. The absolute ages depend, of course, on the adopted gas fractions, SF efficiencies and assumptions about gaseous flows. For a given gas fraction and SF efficiency, the infall model leads to the largest ages; since the gas is constantly replenished, it takes more time to attain a given gas fraction than in a closed box (starting with =1). Also, the outflow model produces the lowest ages; since part of the gas is constantly removed, it takes less time to reach a given gas fraction than in a closed box. The ages derived in the framework of the outflow model are, in general, too low: they are lower than 6 Gyr for all galaxies with 200 km/s. It transpires that galaxies in this velocity range should not have suffered extensive mass losses, i.e. they must not have lost during their lifetime an amount of gas as important as their stellar content (since we adopted here).
The mean age values in the case of the infall model are 4-5 Gyr for the small discs (in the 100 km/s range) and 10 Gyr for 220 km/s. For discs with 300 km/s, extremely large ages (15 Gyr) are found; however, the approximation of evolution at constant gas mass is certainly not valid in that case (see Fig. 4 in Boissier and Prantzos 2000). We notice that Bell and de Jong (2000), on the basis of a different sample and with a completely different method (based on a photometric estimate of the ages) find an “effective age” of 10 Gyr for the more luminous galaxies (-26) and 6 Gyr for the less luminous ones (-20); the galaxies of our sample span also this luminosity range, and its interesting to see that similar ages are found with completely independent methods.
The results obtained in this section confirm the suggestion of Sec. 3.2: low mass discs are, on average, younger than massive ones. The only way to reverse this trend is by assuming that the SF efficiency is strongly correlated with disc mass. Despite the large scatter in the observational data, it is clear that such a correlation does not exist, at least at the present time; and, since the observed galaxies span a large range in masses and metallicities, it does not seem plausible that such a correlation ever existed in the past. In the case of outflow models, another possibility would be to consider that the more massive discs suffered more important mass losses (leading to low gas fractions without having to invoke large ages). However, such a hypothesis is incompatible to the fact that massive discs have deeper potential wells and are less prone to outflows than low mass ones.
6 Summary
In this work we investigate the properties of the star formation efficiency of spiral galaxies and study the implications for their evolution. We use a large homogeneous sample of disc galaxies, for which we measure gaseous mass (HI), rotational velocity , star formation rates and luminosities in the and bands. We are then able to derive the corresponding gas fractions and SF efficiencies as a function of , luminosity and colour index. We find that the gas fraction is correlated to , luminosity and , in the sense that more massive, luminous and redder discs have smaller gas fractions. Previous work by McGaugh and de Blok (1997) reached similar conclusions. The main finding of this work is that the SF efficiency does not correlate with any of the galaxy properties; despite a rather large dispersion (within a factor of 10), the observed is independent of , or .
We interpret our data in the framework of detailed models of galactic chemical and spectrophotometric evolution, utilising metallicity dependent stellar lifetimes, yields, tracks and spectra. These models are calibrated on the Milky Way disc (paper I) and use radially dependent star formation rates, which reproduce observed gradients (paper III). They are extended to other spirals in the framework of Cold Dark Matter scenarios for galaxy formation, and are described by two parameters: rotational velocity and spin parameter . As in our previous work (paper II), we find good agreement with the observations, provided a crucial assumption is made: massive discs are formed earlier than less massive ones. With this assumption our models reproduce the observed trends of gas fractions and SF efficiencies vs. , while variations due to account for the observed dispersion in both cases.
It is important to notice that the dependence of age on galactic mass that we find is not due to any mass-dependent SF efficiency, only to disc formation timescales; in our models this is achieved by varying the infall timescales. Both observations and models suggest that the SF efficiency is independent of galaxy properties. Since the observed galaxies cover a wide range of masses, colours and metallicities, there is no reason to suppose that the SF efficiency was different in the past. The adopted SFR prescription in our models also results in a very slowly varying SF efficiency with time.
When the observed relations of gas fraction vs and SF efficiency vs are considered in combination, they convincingly suggest that low mass discs are, on average, younger than more massive ones; this conclusion is independent of any model and the only assumption is that the SF efficiency is constant in time (a quite plausible assumption, as argued above). In the framework of simple analytical models of galactic chemical evolution, we evaluate the “effective ages” for the galaxies of our sample, using the observationally derived values of and . We find that even models with modest outflows (with ejected masses equal to the stellar ones) lead to ridiculously low values for the galaxy ages; our conclusion is that galaxies in the range 80-400 km/s have not suffered extensive mass losses. Closed box models and infall models lead to more plausible values for the effective ages. In particular, infall models lead to ages of 4-5 Gyr for discs of 100 km/s and 8-10 Gyr for 200 km/s. These “chemically derived” ages are in fair agreement with those derived on the basis of our more sophisticated numerical models, which fit a much larger body of observational data for low redshift spirals. Most importantly, they are also in fair agreement with the “photometric” ages derived in a completely independent way and with a different sample by Bell and de Jong (2000).
In summary, our data, taken at face value, suggest that the bulk of stars in more massive discs are older than in less massive ones. This is supported by our detailed numerical models of galactic chemical and photometric evolution, but also by recent, independent, analysis (Boselli et al. 2000). We notice that Bell and deJong (2000) conclude that it is local surface density that mainly drives the star formation history, while mass plays a less important role. Our study suggests that mass is the main factor, while local surface density plays only a minor role (through the spin parameter : lower values lead to higher local surface densities for a given rotational velocity ).
We notice that this picture is hardly compatible with the currently popular “paradigm” of hierarchical galaxy formation, which holds that large discs are formed by merging of small units at relatively late epochs. If this were the case, massive discs should have large SF efficiencies, in order to have their gas fractions reduced to lower levels than their less massive counterparts. However, such an enhanced SF efficiency is not supported by observations.
References
- [1] Bell E., de Jong R., 2000, MNRAS, 312, 497
- [2] Binggeli B., Sandage A., Tammann G., 1985, AJ, 90, 1681
- [3] Boissier S., Prantzos N., 1999, MNRAS, 307, 857 (paper I)
- [4] Boissier S., Prantzos N., 2000, MNRAS, 312, 398 (paper II)
- [5] Boselli A., Tuffs R., Gavazzi G., Hippelein H., Pierini D., 1997a, A&A, 121, 507
- [6] Boselli A., Gavazzi G., Lequeux J., et al., 1997b, A&A, 1997, 327, 522
- [7] Boselli A., Gavazzi G., Donas J., Scodeggio M., 2000, AJ, submitted
- [8] Charbonnel C., Meynet G., Maeder A., Schaerer D., 1996, A&AS, 115,339
- [9] Cole S., Lacey C., Baugh C. & Frenk C., 2000, MNRAS in press (astro-ph/0007281)
- [10] Digel S., Grenier I., Heithausen A., Hunter S., Thaddeus P., 1996, ApJ, 463, 609
- [11] Gavazzi G., 1987, ApJ, 320, 96
- [12] Gavazzi G., Boselli A., 1996, Astro. Lett. and Communications, 35, 1
- [13] Gavazzi G., Pierini D., Boselli A., 1996, A&A, 312, 397
- [14] Gavazzi G., Scodeggio M., 1996, A&A, 312, L29
- [15] Gavazzi G., Carrasco L., Galli R., 1999a, A&AS, 136, 227
- [16] Gavazzi G., Boselli A., Scodeggio M., Pierini D., Belsole E., 1999b, MNRAS, 304, 595
- [Guiderdoni et al.1998] Guiderdoni B., Hivon E., Bouchet R., Maffei B., 1998, MNRAS, 295,877
- [17] Haynes M., Giovanelli R., 1984, AJ, 89, 758
- [18] Kennicutt R., 1998a, ARAA, 36, 189
- [19] Kennicutt R., 1998b, ApJ, 498, 541
- [20] Kroupa P., Tout C., Gilmore G., 1993, MNRAS, 262, 545
- [21] Lejeune T., Cuisinier F., Buser R., 1997, A&AS, 125,229
- [Matteucci & Greggio] Matteucci F., Greggio L., 1986, A&A, 154, 279
- [McGaugh & DeBlok1997] McGaugh S., De Blok W., 1997, ApJ, 481, 689
- [Mo et al.1998] Mo H., Mao S., White S., 1998, MNRAS, 295,319
- [22] Navarro J.F. & Steinmetz M., 1999, ApJ 513, 555
- [23] Pagel B., 1997, “Nucleosynthesis and galactic chemical evolution”, Cambridge UP
- [24] Prantzos N., 2000, in Proc. of 33d ESTEC Symp. “Star Formation from the small to the large scale”, Eds. F. Favata, A. Kaas & A. Wilson, ESA SP-445, in press
- [25] Prantzos N., Boissier S., 2000, MNRAS, 313, 338 (paper III)
- [Renzini & Voli1981] Renzini A., Voli A., 1981, A&A, 94, 175
- [26] Schaller G., Schaerer D., Maeder A., Meynet G., 1992, A&AS, 96, 269
- [27] Sommer-Larsen J., Gelato S. & Vedel H., 1999, ApJ 519, 501
- [Woosley & Weaver1995] Woosley S., Weaver T., 1995, ApJS, 101, 181
- [Wyse & Silk1989] Wyse R., Silk J., 1989, ApJ, 339, 700
- [28] Zwicky F., Herzog E., Karpowicz M., Kowal C., Wild P., 1961-1968, ”Catalogue of Galaxies and of Cluster of Galaxies” (Pasadena, California Institute of Technology; CGCG)