Search for Millisecond Periodicities in Type I X-ray Bursts of the Rapid Burster
Abstract
We have searched the rising portion of type I X-ray bursts observed from the Rapid Burster with the Rossi X-ray Timing Explorer for the presence of periodicities. The 95 per cent confidence upper limit on the average root-mean-square variation of near coherent pulsations with a width of 1 Hz (in 60–2048 Hz) during the first second of the bursts is 8.8 per cent. We find a possible detection (98 per cent significance) at 306.5 Hz.
keywords:
X-rays:bursts – X-rays:stars – stars:individual:Rapid Burster1 Introduction
The past four years have seen dramatic advances in our understanding of low-mass X-ray binaries (LMXBs) thanks to precision-timing observations made with the Rossi X-ray Timing Explorer satellite (RXTE; Bradt, Rothschild & Swank 1993). Quasi-periodic oscillations (QPOs) in the 200–1200 Hz frequency range have been detected in the persistent emission of many LMXBs. These QPOs often occur simultaneously separated by a frequency difference that remains roughly constant or decreases as the frequencies increase; these frequencies may reflect the relativistic motion of material at the inner edge of the accretion disk in these systems. For a recent review see van der Klis (2000).
Separately, nearly-coherent oscillations (NCOs) with () values of 300 have been detected during many type I X-ray bursts from six LMXBs, and there is strong evidence that these frequencies reflect the underlying neutron star spin period for these sources (Strohmayer et al. 1996; for a review see Strohmayer 1999). In particular, (1) the high coherence of the signals is a challenge to alternative models: in a single burst from KS 1731260 (Smith, Morgan, & Bradt 1997), and values of 4000 have been demonstrated, by modeling of the frequency evolution during the burst, for bursts from 4U 172834 and 4U 1702429 (Strohmayer & Markwardt 1999) and KS 1731260 (Muno et al. 2000); (2) the long-term stability (to better than one part in 1000) of the NCO period in at least three sources has been demonstrated over a time scale of 1 year (Strohmayer et al. 1998b; Muno et al. 2000); (3) the strength of the oscillations varies throughout the burst as expected for a spin modulation: the oscillations are generally strongest on the leading edge and tail of the bursts and undetectable at the burst peak, when a large portion of the NS surface is in conflagration (Strohmayer, Swank & Zhang 1998a); and (4) pulse phase-resolved spectroscopy of a burst from 4U 1636536 indicates that the flux modulation during the tail of the burst is accompanied by a modulation of the blackbody temperature of the spectrum, again as expected (Strohmayer et al. 1998a).
The Rapid Burster (MXB 1730335, or RB hereafter; Lewin et al. 1976) is a recurrent transient LMXB, located in the Galactic plane at a distance of approximately 8.6 kpc (Frogel et al. 1995) in the highly reddened globular cluster Liller 1 (Liller 1977). It is the only LMXB known to produce both type I and type II X-ray bursts (Hoffman, Marshall & Lewin 1978). Whereas the type I bursts result from the explosive thermonuclear burning of accreted material on the surface of a neutron star, the type II bursts result from spasmodic accretion – the release of gravitational potential energy – presumably because of a recurrent accretion instability. For a review, see Lewin, van Paradijs, & Taam (1993).
Guerriero (1998) undertook a search for pulsations from the type I bursts, type II bursts, and persistent emission of the Rapid Burster, as observed through the first four outbursts of the source seen with RXTE. No significant detections were made, with upper limits for persistent signals of 3 per cent RMS variation in the range 20–2048 Hz. Given the unique nature of the Rapid Burster, we undertook to perform a more sensitive search. We used the knowledge that has been gleaned from other sources about the NCO phenomenon, focusing our search on the leading edge of the type I bursts, and on the higher energy photons only (see below, Sect. 2). Preliminary results of this work were reported by Fox & Lewin (1999a).
2 Observations and Analysis
As of January 2000, seven outbursts of the Rapid Burster have been observed with RXTE (Lewin et al. 1996a,b; Guerriero, Lewin & Kommers 1997; Guerriero et al. 1998; Fox & Lewin 1998; Fox et al. 1998; Fox & Lewin 1999b; the sixth outburst began in March 1999 and was not reported). RXTE All-Sky Monitor (ASM; Levine et al. 1996) data for these outbursts are available in “quicklook” and fully-processed form from the web sites of the ASM team333http://xte.mit.edu/XTE/asmlc/ASM.html and the High-Energy Astrophysics Science Archive Research Center,444http://heasarc.gsfc.nasa.gov/docs/xte/asm_products.html respectively.
Alerted by the ASM, we are able to commence target of opportunity observations with the Proportional Counter Array (PCA; Jahoda et al. 1996) within one day of the start of an outburst, and to follow it throughout its month-long evolution (Guerriero et al. 1999).
Outburst profiles, as observed with the RXTE ASM, typically exhibit a sharp 1–3 d rise to a maximum flux of 400 mCrab (2–12 keV; the Crab produces 75 c s-1 in the ASM cameras), as time-averaged over the 90-second ASM dwells. The X-ray flux then declines quasi-exponentially over the next month with a time constant of 8 d (Guerriero et al. 1999). Note, however, that the sixth outburst in March 1999 deviated significantly from this pattern (Fox et al. 1999).
The timing analysis presented here relies exclusively on the PCA data. Our observations used individually described, event-encoded data with a time resolution of 122 s and 64 energy channels. For the usual spectral parameters of the RB, one PCA c s-1 ergs cm-2 s-1, 2–20 keV (Guerriero et al. 1999). When the outburst reaches a maximum (PE and type I bursts), count rates are 5000 PCA c s-1 corresponding to an isotropic luminosity of ergs s-1 (2–20 keV) at a distance of 8.6 kpc. The brightest type I burst peak luminosities, after PE subtraction, are similarly ergs s-1 (see Table 1).
| PE | Peak | Rise | Merit | ||||
| Burst | Date | UT | (c s-1) | (c s-1) | (s) | (c s-2) | |
| Outburst 2 | |||||||
| 1 | (a) | 1996-11-06 | 20:00:49 | 3256 | 4960 | 1.4 | 2138 |
| 2a | (a) | 1996-11-09 | 01:06:20 | 1056 | 2664 | 1.3 | 1496 |
| 3a | (c?) | 1996-11-11 | 21:52:45 | 816 | 656 | 0.2 | 1856 |
| Outburst 3 | |||||||
| 4 | (b) | 1997-06-26 | 05:03:43 | 5360 | 2072 | 2.4 | 240 |
| 5 | (b) | 1997-06-26 | 05:13:23 | 5288 | 2272 | 5.6 | 123 |
| 6a | (b) | 1997-06-26 | 05:22:42 | 2112 | 1000 | 4.6 | 70 |
| 7 | (b) | 1997-06-26 | 08:21:13 | 5696 | 2368 | 2.8 | 251 |
| 8 | (b) | 1997-06-26 | 08:28:59 | 5784 | 1632 | 7.2 | 50 |
| 9a | (b) | 1997-06-26 | 08:40:36 | 2368 | 1144 | 2.6 | 145 |
| 10a | (b) | 1997-06-26 | 08:48:51 | 2200 | 1120 | 3.6 | 105 |
| 11 | (b) | 1997-06-27 | 18:13:15 | 5152 | 3448 | 2.2 | 642 |
| 12b | (b) | 1997-06-27 | 18:30:34 | 5264 | 2768 | 1.8 | 536 |
| 13a | (a) | 1997-06-29 | 07:03:31 | 1496 | 2016 | 1.5 | 783 |
| 14 | (a) | 1997-06-29 | 18:07:23 | 4016 | 4000 | 1.4 | 1409 |
| 15a | (a) | 1997-06-29 | 18:35:24 | 1656 | 1560 | 0.6 | 1226 |
| 16a | (a) | 1997-07-07 | 13:29:06 | 664 | 2088 | 1.1 | 1391 |
| 17a,b | (a) | 1997-07-10 | 14:03:41 | 528 | 2208 | 1.2 | 1473 |
| 18 | (a) | 1997-07-13 | 12:01:19 | 1136 | 1728 | 1.5 | 706 |
| Outburst 4 | |||||||
| 19 | (a) | 1998-01-30 | 18:31:04 | 4680 | 3424 | 2.0 | 716 |
| 20b | (a) | 1998-01-30 | 18:54:18 | 4784 | 3424 | 1.6 | 867 |
| 21 | (a) | 1998-01-30 | 20:02:22 | 4344 | 3584 | 1.5 | 1088 |
| 22 | (a) | 1998-01-30 | 20:28:12 | 4328 | 3864 | 1.7 | 1082 |
| 23c | (a) | 1998-01-30 | 20:54:18 | 4232 | 4200 | 1.5 | n/a |
| 24 | (a) | 1998-01-31 | 23:25:27 | 3672 | 3664 | 1.6 | 1169 |
| 25 | (a) | 1998-01-31 | 23:53:09 | 3712 | 3736 | 1.3 | 1494 |
| 26 | (a) | 1998-02-02 | 17:00:47 | 2480 | 4720 | 1.3 | 2349 |
| 27 | (a) | 1998-02-02 | 18:46:18 | 2552 | 4912 | 1.2 | 2703 |
| 28 | (a) | 1998-02-04 | 20:21:48 | 2288 | 4960 | 1.7 | 1954 |
| 29 | (a) | 1998-02-07 | 19:00:34 | 1776 | 5328 | 1.5 | 2746 |
| 30 | (a) | 1998-02-07 | 20:04:54 | 1744 | 4920 | 1.3 | 2800 |
| 31g | (c) | 1998-02-10 | 22:06:44 | 1424 | 4208 | 1.2 | 2587 |
| 32 | (c) | 1998-02-16 | 14:04:17 | 1256 | 3632 | 0.5 | 5292 |
| 33d | (c) | 1998-02-16 | 15:13:01 | 1168 | 1608 | 2.3 | n/a |
| 34a | (c) | 1998-02-19 | 14:29:55 | 192 | 2896 | 0.3 | 8103 |
| Outburst 5 | |||||||
| 35e,g | (a?) | 1998-08-19 | 05:07:19 | 13664 | 5232 | 4.7 | 306 |
| 36e | (a?) | 1998-08-20 | 13:21:38 | 10848 | 3256 | 1.0 | 765 |
| 37f | (d) | 1998-08-22 | 08:24:11 | 3328 | 3448 | 1.3 | 1313 |
| 38f | (d) | 1998-08-22 | 09:01:59 | 3272 | 3384 | 1.6 | 1107 |
| 39a,f | (d) | 1998-08-22 | 10:15:45 | 1184 | 1384 | 1.6 | 453 |
| 40 | (c) | 1998-09-01 | 02:13:16 | 1152 | 4480 | 0.6 | 5603 |
| 42xf | (c?) | 1998-09-07 | 03:35:12 | 608 | 2288 | 3.3 | 541 |
| Outburst 6 | |||||||
| 41g | (a) | 1999-03-12 | 21:50:02 | 3440 | 2776 | 2.7 | 467 |
| 42g | (a) | 1999-03-12 | 22:12:53 | 3344 | 2928 | 1.5 | 935 |
| 43i | (a) | 1999-03-16 | 02:32:05 | 1616 | 1488 | 1.2 | 593 |
| 44i | (a) | 1999-03-16 | 03:00:04 | 1576 | 1448 | 1.4 | 501 |
| 45g | (a) | 1999-03-16 | 03:55:32 | 3152 | 2600 | 0.9 | 1336 |
| 46g | (a) | 1999-03-16 | 04:23:23 | 3104 | 2968 | 1.0 | 1411 |
| 47g | (a) | 1999-03-19 | 19:57:22 | 1056 | 1448 | 1.4 | 586 |
| PE | Peak | Rise | Merit | ||||
|---|---|---|---|---|---|---|---|
| Burst | Date | UT | (c s-1) | (c s-1) | (s) | (c s-2) | |
| Outburst 7 | |||||||
| 48h | (b) | 1999-09-30 | 20:35:00 | 2632 | 1848 | 1.6 | 466 |
| 49h | (b) | 1999-09-30 | 20:55:54 | 2512 | 1880 | 2.7 | 299 |
| 50h | (b) | 1999-09-30 | 21:17:23 | 2464 | 2048 | 2.2 | 420 |
| 51h | (b) | 1999-09-30 | 22:03:53 | 2488 | 2136 | 1.6 | 614 |
| 52h | (a) | 1999-09-30 | 22:26:54 | 2368 | 2408 | 2.0 | 607 |
| 53i | (a) | 1999-10-02 | 09:28:25 | 1520 | 1728 | 1.8 | 518 |
| 54i | (a) | 1999-10-02 | 09:54:57 | 1528 | 1896 | 1.8 | 572 |
| 55i | (a) | 1999-10-02 | 10:49:25 | 1528 | 1744 | 1.6 | 565 |
| 56i | (a) | 1999-10-02 | 11:16:28 | 1520 | 1760 | 1.6 | 596 |
| 57a,b,i | (a) | 1999-10-02 | 11:44:19 | 544 | 736 | 1.3 | 335 |
| 58d,h | (a) | 1999-10-05 | 12:11:53 | 1752 | 3112 | 1.6 | 1273 |
| 59h | (a) | 1999-10-05 | 12:49:39 | 1768 | 3160 | 1.7 | 1193 |
| 60 | (a) | 1999-10-08 | 12:40:07 | 2736 | 4672 | 1.3 | 2335 |
| 61g | (a) | 1999-10-12 | 12:29:52 | 1664 | 4024 | 1.0 | 2926 |
| 62a,g | (a) | 1999-10-12 | 14:28:52 | 632 | 1744 | 1.6 | 825 |
| 63 | (a) | 1999-10-16 | 04:13:44 | 1344 | 4688 | 1.0 | 3487 |
| 64a,i | (c) | 1999-10-19 | 06:12:23 | 176 | 1872 | 0.2 | 8612 |
Dates and times are in UT. Profile classes for the bursts correspond to the examples shown in Fig. 1. Persistent emission + background (PE) and burst peak count rates (Peak; for 1/8-second bins) are in PCA cts/sec (2–60 keV). Burst rise times (in seconds) are characteristic times for exponential fits; Merit figures are calculated as Merit = (Peak2/PE)/Rise. Boldface burst numbers indicate the 31 bursts of the original search; boldface Merit figures indicate the 17 bursts of the final search; see text for details.
aObserved during offset pointing (see text); bBurst tail truncated by slew or data gap; cNot recorded in Event Mode data; dOnly partially recorded in Event Mode data; eOccurred during a type II burst; fIdentification as type I burst is uncertain; g4 of 5 PCUs operational; h3 of 5 PCUs operational; i2 of 5 PCUs operational
Type I X-ray bursts are distinguished from the type II bursts of the RB in that they show a pronounced cooling over the course of the burst; type II bursts, on the other hand, maintain a roughly constant temperature through the burst. Near the maximum of the RB outbursts, when the persistent emission is at its strongest, we have occasionally observed bursts with a slow rise, slow decay and relatively low peak flux – classified as b-profile bursts below – that we have difficulty identifying definitively as type I or type II. For the most part we have identified them as type I on the basis of spectral analyses (Guerriero et al. 1999); however, this identification is not certain in all cases.
In Figure 1 we present the profiles of four type I bursts from the Rapid Burster that indicate the variety of burst profiles that we observe. Table 1 identifies all of the bursts by profile class; note, however, that these identifications are merely gross characterizations, and in particular, the distinction between profile classes (a) and (b) is probably not well-defined at this point.

We note that an occasional type I burst from 4U 172834 is visible at 50 per cent collimation efficiency during direct pointings at the RB, but that these bursts exhibit spectra (fitted blackbody temperatures (2 keV), peak count rates (10,000 c s-1), and light curves (10 sec decays) that readily distinguish them from the RB bursts.
Our analysis evolved historically and must be described as such. It began in 1998 after RXTE had observed five outbursts from the Rapid Burster. We compiled a list of all RB type I bursts that were observed with RXTE during these outbursts (Table 1, data through September 1998); note that no type I bursts were observed during the first outburst (April and May 1996). We selected one-second time segments from the start of each burst: an automated procedure found the first eighth-second bin to represent a 4.5 fluctuation above the background level, and these start times were then inspected visually and adjusted by a half-second or less by hand.
To maximize our sensitivity to pulsations modulating the burst flux alone (and not the background or PE), we rank-ordered the bursts in terms of Peak2/PE (Table 1), and selected the top 31 bursts for our sample, as these seemed the most attrative targets; the selected bursts are indicated in bold in Table 1. To increase signal-to-noise for a relatively hard pulsation we selected photons in the 5.5–16 keV bandpass, roughly the upper half of the energy range for the Rapid Burster spectrum.
We binned the light curves from these one-second intervals to sec time resolution, corrected times to the solar system barycentre, took the Fourier transform, and averaged the 31 resulting power density spectra – producing a single power density spectrum (PDS) of 1 Hz frequency resolution and Nyquist frequency 2048 Hz.
2.1 Search Procedure
The frequency of the NCOs often drifts by roughly 2 Hz during the bursts (Strohmayer et al. 1996), so we do not necessarily anticipate a one-bin excess in the PDS. Rather than search for the highest individual powers, then, we began by inspecting the running two-bin average of adjacent powers from the PDS. Then, in a check for broader signals, we rebinned the PDS by successive factors of two and, at each stage, performed a two-bin running-average search on the averaged powers.
Since the statistical distribution of Poisson noise powers is known (for raw powers it is the distribution with two degrees of freedom; Leahy et al. 1983), we were able to compare the search results from different stages of this process and select those which are most significant in a global sense. In fact, averaging 31 PDSs already puts the powers in a near-Gaussian regime, and we adopted this approximation in ranking prospective triggers of different bin sizes.
We have performed Monte Carlo calculations to determine the absolute significance of any particular excess over the entire power-spectral search. We did this because, first, the running-average search procedure (with its multiple rebinnings and reexaminations of the PDS) results in a distribution of tested powers that does not have an analytical form; and second, because the burst rise injects strong low-frequency power and places sidebands on noise spikes, increasing the noise powers for an integral-power search such as ours.
2.2 Monte Carlo Method
Our Monte Carlo (MC) procedure used the actual burst data, scrambling the data on short time scales to destroy real high-frequency power while preserving the burst rise and low-frequency noise responsible for the amplification of noise spikes in the PDS. The 120 time bins from each 30 msec interval of a burst were randomly interchanged prior to performing the FFT. We then averaged the 31 “fake” PDSs from the individual bursts and performed our full search protocol, recording the highest three signals that were found. For the purposes of this paper, we performed an MC run of 100,000 trials.
There are two aspects of this procedure which, if ignored, will systematically affect the resulting statistics. First, real noise is present in our fake PDSs at low frequencies, 100 Hz, because of the nature of our scrambling procedure. We therefore ignore false triggers in the frequency range 60 Hz.
Second, the MC procedure destroys real broad-band power at high frequencies, which (if not accounted for) will systematically enhance powers in the real PDS relative to powers in the fake (MC) ones. We have therefore characterized the broad-band excess power that is present in the real data. Subtracting off the deadtime-corrected PCA Poisson level (Morgan, Remillard & Greiner 1997) from our real (averaged) PDS, and logarithmically rebinning, we find that we may fit the residuals with a power law of exponent 0.7 and total normalization 1.0 per cent rms over 1–2048 Hz. We corrected our real PDS powers by dividing by this background level before comparing our powers to the MC results.
2.3 Candidate Signal Identification
The average power density spectrum of the first one second of the 31 type I bursts (see Table 1) from the RB is presented in Fig. 2.
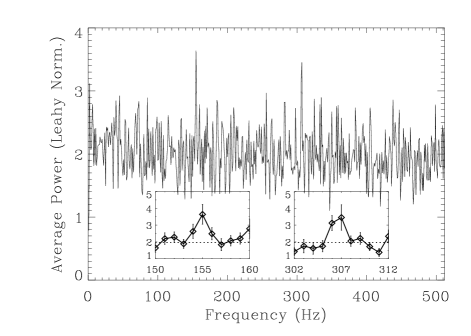
The two highest peaks, centred at 306.5 Hz and 155 Hz, respectively, extend noticeably above the noise level, and are placed in a near-harmonic relationship. Specifically, our Monte Carlo results indicate that a peak with the strength of the 306.5 Hz peak (or stronger) is present in 1.8 per cent of the simulated power density spectra, and that a peak with the strength of the 155 Hz peak, or stronger, is present in 15.3 per cent of the simulated PDSs. Note that although the single-bin 155 Hz power is the strongest in the PDS, the 306.5 Hz candidate signal is more significant because of the strong power in two adjacent bins. The chances of any PDS having two peaks, both stronger than the strength of our 155 Hz peak, is 1.2 per cent.
The near-harmonic frequencies of the two peaks may be evidence for a common physical origin. However, the 1 per cent difference in frequencies is uncomfortably large to result from the frequency drifts that have been observed in type I bursts from other sources (Strohmayer & Markwardt 1999; Muno et al. 2000) – though a connection can certainly not be excluded. The burst frequencies in other sources drift by less than 1 per cent, total, and exhibit the most pronounced evolution during the tails of the bursts. Moreover, the signal we observe here, if real, results from the contribution of several bursts, which would tend to diminish the observable effects of the frequency drift.
In the event that the two signals are related then their combined significance is still dependent upon post factum assumptions; we give an illustrative example. If we allow for a 3 per cent shift in the frequency of a harmonic or subharmonic relative to the main signal (conservative in that the actual shift is 1.1 per cent) then we would consider two frequency windows, 153–158 Hz and 594–632 Hz – centred on one-half and double the main 306.5 Hz signal frequency, respectively – as candidate windows for harmonic detection. The chance of observing a signal as strong as our 155 Hz signal (or stronger) within this range is roughly 0.38 per cent (15.3 per cent full-search probability multiplied by the size of this restricted range and divided by the size of the full 60–2048 Hz window). Multiplying the odds for the main signal (54:1) by the odds for this additional signal (259:1) would give a combined probability for the dual detection of , corresponding to a 4.0 level of confidence.
2.4 Outbursts 6 and 7
After we had finished the analysis of the type I bursts of the first five outbursts as described above, and before we were ready to submit our results for publication, two additional outbursts of the RB occurred in March and September 1999, respectively. The few bursts from Outburst 6 were of generally low quality, but during Outburst 7 better bursts were collected and so we performed a full analysis on those 23 bursts (see Table 1). We found no evidence for modulation near 306 Hz, or at any other frequency. We can set 95 per cent confidence RMS upper limits of 8.1 per cent, 7.7 per cent, and 5.0 per cent, respectively, on the average 306 + 307 Hz power during the one second before the rise, the one second rise, and the one second after that.
We then analyzed all 61 type I bursts with fast-timing data (covering the first seven RXTE outbursts). As with our initial search, we found the strongest signal in the 306 + 307 Hz bin. The RMS variation in the average PDS is 7.01.1 per cent during the first one second of the bursts (5.5–16 keV energy band). Monte Carlo simulations indicate, however, that this signal is not significant: 19 per cent of the simulated datasets have signals of equal or greater significance. If the signal is not real, then it sets our quoted 95 per cent confidence upper limit for a narrow pulsation: 8.8 per cent rms on average. 95 per cent confidence upper limits on the average 306 + 307 Hz RMS modulation in the one second before and the one second after the first second, for the full burst set, are 5.7 per cent and 2.2 per cent, respectively.
2.5 Candidate Signal Follow-Up
Cumming & Bildsten (2000) have shown that the vertical thermal time during mixed hydrogen/helium burning is longer than the wrapping time from the expansion-induced differential rotation, and that the opposite is true for helium-rich bursts: the heat from these bursts can get out faster and, in addition, the shearing frequency is lower. This makes it easier for a periodic signal from some underlying asymmetry to escape from a helium-rich burst. Muno et al. (2000) have found that the “fast” bursts from KS 1731260 – bursts with high peak fluxes, short decay times, and radius expansion, indicative of helium burning – occur in the same part of the X-ray colour-colour diagram, and all exhibit burst pulsations. The “slow” bursts, likely the result of mixed hydrogen/helium burning – with lower peak fluxes, longer decay times, and no radius expansion – do not show pulsations, consistent with this picture. Lewin et al. (1987) showed that the bursts from 163653 with radius expansion had substantially shorter rise times than those that did not exhibit radius expansion.
Inspired by the above, we restricted our attention to a set of 17 fast-rise bursts from all seven outbursts, and we recomputed an average PDS, and performed our signal search again. These bursts were selected on the basis of their “Merit” function (see Table 1), defined as (Peak2/PE)/Rise to take into account the expected strength of any burst signal, as well as the distinction between fast- and slow-rise bursts. Note however that we have no particular evidence that these bursts (or any bursts from the RB) resulted from helium-rich as opposed to hydrogen-rich burning; this question will be addressed in future work. We ignore Burst 3, a burst with low signal-to-noise that has high “Merit” only because of its unusually short rise time.
We find that the signal is strengthened significantly, with an average power in this burst sample of 4.13 for the two-bin 306.5 Hz average (mean of 34 powers). A signal of this strength or stronger is found in only 0.07 per cent of the Monte Carlo simulations of this dataset, corresponding to a 3.4-sigma level of confidence. The strength of the signal corresponds to an average 8.0 per cent RMS modulation of the burst flux during these intervals.
Similar searches of the burst flux preceding and following the selected one second do not show significant signal power; the 95 per cent confidence upper limit on the excess average 306 + 307 Hz power during these intervals is 0.76 and 0.47, respectively. These correspond to average upper limits of 10 per cent and 2 per cent RMS, respectively, for modulation of the burst flux during these intervals.
Likewise, a search for power in the soft band (2.0–5.5 keV) photons from the first second of each burst does not show significant power: the 95 per cent confidence upper limit on the excess average 306 + 307 Hz power during these intervals is 0.69, corresponding to an average RMS upper limit of 4.3 per cent for modulation of the soft burst flux.
We performed a separate systematic search for pulsations near 307 Hz during the tails of all type I bursts (except for Burst 3, which is too weak for useful limits to be set). The search parameters here were chosen to maximize signal for the relatively weaker pulsations during the burst tails: we select higher-energy photons only (5.5–16 keV), divide the first 16 s of each burst into four 4 s segments, FFT and search for the highest power in the 304–310 Hz range. We found no significant power, and our mean per-burst 95 per cent confidence upper limits on the strength of any coherent power (0.25 Hz bins) in the tails of the bursts are 5 per cent–14 per cent RMS, relative to the 5.5–16 keV burst flux, depending on the strength of the burst. Given the weaker signal strengths that are generally observed during burst tails, and the large search space we necessarily considered, we do not consider this non-detection surprising.
Since our only finding, subsequent to the evidence uncovered in our initial search, was a strengthening of that evidence within an overlapping set of bursts, this result is subject to a posteriori effects and is of uncertain absolute significance.
3 Conclusions
We have performed a search for burst pulsations from the type I bursts of the Rapid Burster. The search was targeted to maximize the chances for detection of a signal like those found in other type I burst sources, where the maximum modulation amplitude occurs at the leading edge of a burst and the pulsations are spectrally hard compared to the burst and persistent emission. We find evidence at the 98 per cent confidence level for a modulation near 307 Hz which, if confirmed, will indicate a spin period for the Rapid Burster of 3.25 or 6.5 milliseconds, depending on whether the main burst signal is the fundamental or first harmonic of the spin frequency.
Acknowledgments
We thank Deepto Chakrabarty, Tod Strohmayer and Fred Lamb for helpful discussions. W.L. gratefully acknowledges NASA support. L.B. was partially supported by NASA via grant NAG 5-8658 and by the National Science Foundation under grant no. PHY 94-07194. L.B. is a Cottrell Scholar of the Research Corporation.
References
- [1]
- [2] Bradt H.V., Rothschild R.E., Swank J.H., 1993, A&AS, 97, 355
- [3] Cumming A., Bildsten L., 2000, ApJ, in press, astro-ph/0004347
- [4] Fox D.W., Lewin W.H.G., 1998, IAUC 6992
- [5] Fox D.W., Lewin W.H.G., 1999a, IAUC 7081
- [6] Fox D.W., Lewin W.H.G., 1999b, ATEL #46
- [7] Fox D.W., Smith D.A., Lewin W.H.G., Rutledge R., 1998, ATEL #32
- [8] Frogel J.A., Juchinski L.E., Tiede G.P., 1995, AJ, 109, 1154
- [9] Guerriero R., 1998, Master’s Thesis, Massachusetts Institute of Technology
- [10] Guerriero R., Lewin W.H.G., Kommers J., 1997, IAUC 6689
- [11] Guerriero R., Fox D., Lewin W., Rutledge R., Moore C., van der Klis M., van Paradijs J., 1998, IAUC 6815
- [12] Guerriero R., et al., 1999, MNRAS, 307, 179
- [13] Hoffman J.A., Marshall H.L., Lewin W.H.G., 1978, Nat, 271, 630
- [14] Jahoda K., Swank J.H., Giles A.B., Stark M.J., Strohmayer T., Zhang W., Morgan E.H., 1996, SPIE, 2808, 59
- [15] Leahy D.A., Darbro W., Elsner R.F., Weisskopf M.C., Sutherland P.G., Kahn S., Grindlay J.E., 1983, ApJ, 266, 160
- [16] Levine A.M., Bradt H., Cui W., Jernigan J.G., Morgan E.H., Remillard R., Shirey R.E., Smith D.A., 1996, ApJ, 469, L33
- [17] Lewin W.H.G., van Paradijs J., Taam R.E., 1993, Space Science Review, 62, 223
- [18] Lewin W.H.G., et al., 1976, ApJ, 207, L95
- [19] Lewin W.H.G., Penninx W., van Paradijs J., Damen E., Sztajno M., Truemper J., van der Klis M., 1987, ApJ, 319, 893
- [20] Lewin W.H.G., et al., 1996a, IAUC 6409
- [21] Lewin W.H.G., et al., 1996b, IAUC 6506
- [22] Liller W., 1977, ApJ, 213, L21
- [23] Morgan E.H., Remillard R.A., Greiner J., 1997, ApJ, 482, 993
- [24] Muno M.P., Fox D.W., Morgan E.H., Bildsten L., 2000, ApJ, in press, astro-ph/0003229
- [25] Smith D.A., Morgan E.H., Bradt H., 1997, ApJ, 479, L137
- [26] Strohmayer T.E., 1999, in the Proceedings of X-ray Astronomy ’99: Stellar Endpoints, AGN and the Diffuse X-ray Background. Bologna, Italy, in press, astro-ph/9911338
- [27] Strohmayer T.E., Zhang W., Swank J.H., Smale A., Titarchuk L., Day C., Lee U., 1996, ApJ, 469, L9
- [28] Strohmayer T.E., Swank J.H., Zhang, W., 1998a, in Proceedings of the Symposium “The Active X-ray Sky: Results from BeppoSAX and Rossi-XTE”, Eds. L. Scarsi, H. Bradt, P. Giommi, & F. Fiore, Rome: Nuclear Physics B Proceedings Supplements, astro-ph/9801219
- [29] Strohmayer T.E., Zhang W., Swank J.H., Lapidus I., 1998b, ApJ, 503, L147
- [30] Strohmayer T.E., Markwardt C.B., 1999, ApJ, 516, L81
- [31] van der Klis M., 2000, ARAA, in press, astro-ph/0001167