Observations of the core of the Pleiades with the Chandra X-ray Observatory
Abstract
We present results from a 36-ksec observation of the core of the Pleiades open cluster using ACIS-I on the Chandra X-ray Observatory. We have detected 57 sources, most of which do not have previously known optical counterparts. Follow-up photometry indicates that many of the detections are likely to be AGNs, in accordance with extragalactic source counts, but some of the sources may be previously undiscovered low-mass members of the Pleiades. We discuss our dataset and our findings about X-ray emission from early-type stars as well as very late type stars. In particular, the large X-ray fluxes, lack of variability, and hardness ratios of the four Pleiades B6 IV – F4 V stars suggest a tentative conclusion that Pleiades stars in this spectral type range are intrinsic X-ray sources rather than previously unknown binaries in which the X-ray emission is from a late-type companion. Also the sensitivity of Chandra allowed us to detect nonflare X-ray emission from late-M stars.
1 Introduction
Open clusters are an excellent laboratory for studying the evolution of stellar properties as each cluster contains a sample of stars of the same age and similar chemical composition formed under (presumably) similar initial conditions. Thus a comparison of clusters of different ages allows us to study the evolution of angular momentum as well as coronal and chromospheric activity as a function of age and mass. Previous X-ray surveys, especially ROSAT, have shed light on coronal properties in a large number of open clusters spanning a wide range of ages (see Micela et al. (1999) for a comprehensive list). Several of these clusters also have measurements of rotation (in the form of rotational velocities, , or rotational periods, ) for a large sample of stars.
One important result of the ROSAT observations of these clusters is that once the pre–main-sequence proto-planetary disk has been shed, F, G, and K-type coronal activity, as evidenced by X-ray surface flux or , is directly related to rotation rate; more specifically it is related to the Rossby number (, the ratio of the rotation period to the convective overturn time; see review by Jeffries (1999)). Thus the rotation-activity connection has been intensively studied this past decade across a range of masses and ages in several open clusters, for e.g., IC2391/2602 (30 Myr; Patten & Simon (1996), Randich et al. (1995)), Per (50 Myr; Prosser et al. (1996)), Pleiades (100 Myr; Stauffer et al. (1994); Micela et al. (1999)), Hyades (670 Myr; Stern et al. (1995)). We note that the ages for these open clusters are not certain as other indicators (such as the lithium depletion boundary method, e.g., Stauffer (2000)) suggest that the age scale may need to be shifted to be systematically older. It is not yet clear whether the same age-rotation-activity-paradigm extends to the fully convective M dwarfs and the very young T Tauri stars, and it is completely unknown whether it extends to the substellar brown dwarfs (BDs).
It was long thought that there might be a break in coronal properties at the fully convective boundary, as one progresses from stars with convective cores and radiative envelopes to fully convective stars. Such an abrupt transition in chromospheric, transition-region, and coronal activity has not been observed (e.g., Fleming et al. (1993)). Hence, the question arises whether the break is at the hydrogen burning mass limit instead, i.e., BDs with .
Several deep optical and near-infrared surveys have discovered very-low mass stars and BDs in many star forming regions and young open clusters (e.g., Zapatero Osorio, Rebolo, & Martín (1997); Luhman (1999); Stauffer et al. (1999); Lucas & Roche (2000)). X-ray emission has also been discovered from some of these very low mass objects, including some BDs and from a larger sample of brown dwarf candidates (BDCs; Neuhäuser et al. (1999)). We note that persistent X-ray emission from BDs has been observed only in very young objects (age 1 Myr). Some X-ray flares have been seen from late-type older objects such as VB 8 (spectral type M7; Giampapa et al. (1996)) and VB 10 (spectral type M8; Fleming, Giampapa, & Schmitt (2000)). Both these sources have ages of the order of several times years (Reid, Tinney, & Mould (1994)). Most recently, an X-ray flare was detected using the Chandra X-ray observatory from the nearby brown dwarf LP 944-20 (age 500 Myr; Rutledge et al. (2000)). None of these older sources have been detected in X-rays outside of the flares.
Thus, there are several interesting questions to be answered with new X-ray observations. The Pleiades open cluster is ideal for studying X-ray activity as a function of rotation and mass because (i) it is a young (100 Myr), rich open cluster at a distance of only 125 pc, (ii) it is one of the best studied open clusters, (iii) rotational velocities or rotation periods have been measured for a large number of stars spanning a wide range of mass and rotation rate (e.g., Soderblom et al. (1993); Krishnamurthi et al. (1998); Queloz et al. (1998)), and (iv) the Pleiades has long been a hunting ground for BDs at optical and infra-red wavelengths (e.g., Hambly, Jameson, & Hawkins (1993); Zapatero Osorio, Rebolo, & Martín (1997); Festin (1997); Bouvier et al. (1998); Zapatero Osorio et al. (1999); Pinfield et al. (2000)).
There have been several X-ray studies of the Pleiades conducted using ROSAT (for e.g., Stauffer et al. (1994), Gagné, Caillault, & Stauffer, (1995), Micela et al. (1996), Micela et al. (1999)). In addition to providing us with a valuable X-ray database for the Pleiades, these studies have shed light on several important questions such as the rotation-activity paradigm for F, G and K dwarfs, and luminosity functions for the earlier-type stars as well as short-term and long-term variability. However, while these surveys did detect some early M stars, they did not detect many late-M stars due to sensitivity limits. Additionally, many BDs in the Pleiades have only been discovered and cataloged recently.
In order to determine whether X-ray emission can be seen at the very bottom of the main sequence and beyond, we observed the core of the Pleiades cluster with the ACIS-I instrument aboard the Chandra X-ray Observatory. The much improved spatial resolution and higher effective area of ACIS-I over the ROSAT PSPC provided an opportunity to detect the small number of F, G, K, and early-M cluster members not detected by ROSAT. The ACIS-I images will also enable us to determine whether persistent X-ray emission can be seen from late-M dwarfs and BDs older than a few million years, and perhaps let us study the rotation-activity relation across the H-burning boundary.
Section 2 discusses our observations and data reduction methods, while section 3 discusses the main results. Section 4 presents the conclusions and future work.
2 Data Acquisition and Reduction
The observations presented in this paper were obtained as part of the Guaranteed Time Observation (GTO) program for the Chandra X-ray Observatory. We were allocated 60 ksecs of observing time, which was split into two parts. This paper presents the first dataset comprising 36 ksec of data and the remaining data will be presented in paper 2.
The observation was centered on the core of the Pleiades cluster (RA(J2000): 03h 46m 46s, Dec.(J2000): +24d 04m 06s) and was obtained with the ACIS-I imaging array on September 18, 1999. The imaging array is comprised of four charge-coupled devices (CCDs) that are front-side illuminated (I0, I1, I2, and I3). All four chips of the imaging array were active during this observation, giving us a square field 16 by 16 in size. At the distance of the Pleiades, this corresponds to a field of view 0.60 pc 0.60 pc. Two of the chips from the ACIS-S array (S3 and S4) were also active during this observation, but they were significantly out of the focal plane and hence data from those chips were not analyzed for this paper. The ACIS detector was operated in graded mode throughout this observation, and the standard 3.3 s readout mode was employed.
The data reduction and analysis was done using the Chandra Interactive Analysis of Observations (CIAO) software, developed by the Chandra Science Center. We started the analysis from the Level 2 events list provided by the Chandra Science Center and retained only ASCA grades 0, 2, 3, 4, and 6. Inspection of the resulting image shows bright stripes on all front illuminated chips (including S4). Formation of an image in chip coordinates (rather than sky coordinates in which the dithering of the space-craft has been accounted for) reveals that these stripes are due to isolated ‘bad’ columns on the chip. Ignoring these bad columns successfully eliminates the stripes with negligible loss of data. We also examined the time dependence of the background by making an ‘image’ in the energy-time plane. Periods of high background, corresponding to stripes in this energy-time image, were flagged and excluded from our final clean image.
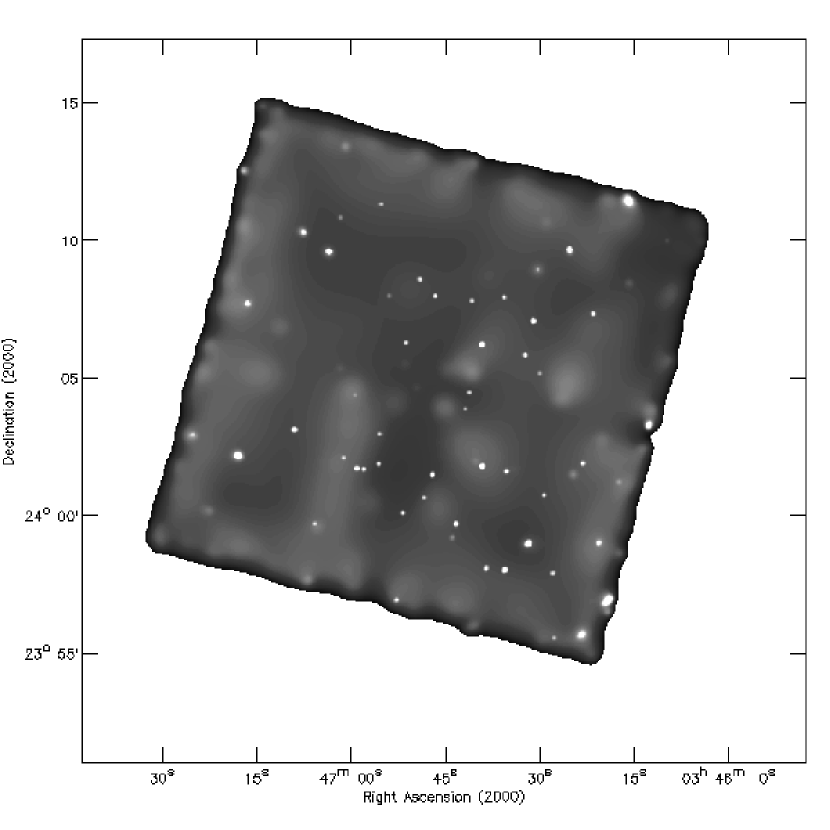
Using these methods, we produced a final clean image with a low background level and free of defects. Figure 1 shows a smoothed ACIS-I image of the Pleiades obtained in 36 ksecs. The image was generated using the CSMOOTH algorithm in CIAO. This algorithm uses Fourier techniques to perform adaptive smoothing of the image such that any structure is smoothed out unless it is present above some predetermined level of significance. We chose to smooth to the level. Numerous point sources can be seen in this image. The diffuse structure seen in the background is likely due to the smoothing of the instrumental effects and diffuse cosmic background.
Data from the front-side illuminated (ACIS-I) CCDs in our dataset are affected by the degradation of charge transfer efficiency in the low-energy range 0.2-0.5 keV, caused by the high dosage of particle irradiation early in the Chandra mission (Prigozhin et al. (2000)). A charge transfer inefficiency (CTI) corrector has been developed to correct this problem (Townsley et al. (2000)). However, as our data were obtained in 33 “graded mode” rather than in 33 “faint mode”, the 33 event neighborhood was not telemetered to the ground. As these neighborhoods are required by the corrector to reconstruct the CTI-free event, we are not able to correct our dataset for this problem.
The primary goal of this work is to identify the point sources in this field. Initially, we attempted to use the CIAO routine “celldetect”, which is a simple detection algorithm based on the Poisson statistics within a sliding box. We found that, near the center of the field, this routine missed sources which were clearly present upon a visual inspection. Instead, source detections were obtained using the wavelet-based algorithm “wavdetect” in CIAO. We set the false alarm probability set to 10-6 per pixel. This implies that there would be 1 spurious source detected per 10001000 pixel image. Our binned image was 512512 pixels, so we would expect 0.25 spurious sources in our field. We have detected 57 sources using this method. Careful visual inspection of the field gives us confidence that “wavdetect” has performed its task successfully.
We also ran the “wavdetect” algorithm with the false alarm probability set to 10-5 per pixel. This lower threshold picked up 15 additional sources, listed in Table 3. From an inspection of the X-ray image, we believe it is likely that most of these sources are not real.
3 Results and discussion
| Number | RA (2000) | DEC (2000) | Counts | Error | Hardness | Error in |
|---|---|---|---|---|---|---|
| ratio (HR) | HR | |||||
| 1 | 3 47 25.25 | 24 2 54.10 | 75.15 | 11.23 | -0.39 | 0.14 |
| 2 | 3 47 18.10 | 24 2 11.17 | 785.24 | 29.21 | -0.11 | 0.04 |
| 3 | 3 47 16.98 | 24 12 33.70 | 50.67 | 9.00 | 0.59 | 0.09 |
| 4 | 3 47 16.48 | 24 7 41.84 | 184.59 | 15.14 | -0.56 | 0.08 |
| 5 | 3 47 14.10 | 24 3 18.70 | 12.94 | 5.10 | -0.11 | 0.37 |
| 6 | 3 47 9.11 | 24 3 7.56 | 189.64 | 14.70 | -0.20 | 0.08 |
| 7 | 3 47 7.59 | 24 10 16.19 | 111.14 | 12.53 | 0.80 | 0.02 |
| 8 | 3 47 5.71 | 23 59 42.30 | 40.85 | 9.06 | 0.63 | 0.08 |
| 9 | 3 47 3.57 | 24 9 34.86 | 292.16 | 18.11 | -0.33 | 0.06 |
| 10 | 3 47 1.66 | 24 10 47.53 | 28.95 | 7.28 | 0.91 | 0.02 |
| 11 | 3 47 1.29 | 24 2 6.07 | 29.11 | 7.07 | 0.45 | 0.17 |
| 12 | 3 47 0.80 | 24 13 24.56 | 20.22 | 6.56 | 0.46 | 0.18 |
| 13 | 3 46 59.25 | 24 1 42.54 | 85.48 | 10.15 | 0.05 | 0.11 |
| 14 | 3 46 58.15 | 24 1 40.39 | 41.70 | 7.68 | -0.43 | 0.19 |
| 15 | 3 46 55.74 | 24 1 52.67 | 27.99 | 6.56 | 0.52 | 0.09 |
| 16 | 3 46 55.63 | 24 2 56.88 | 20.26 | 5.75 | 0.25 | 0.22 |
| 17 | 3 46 55.17 | 24 11 14.27 | 27.56 | 6.86 | -0.30 | 0.38 |
| 18 | 3 46 54.06 | 24 7 56.49 | 12.74 | 5.10 | -0.28 | 0.31 |
| 19 | 3 46 53.05 | 23 56 55.20 | 63.53 | 9.44 | 0.74 | 0.04 |
| 20 | 3 46 51.97 | 24 0 4.61 | 29.09 | 6.78 | 0.33 | 0.13 |
| 21 | 3 46 51.31 | 24 6 16.17 | 24.04 | 6.41 | -0.17 | 0.23 |
| 22 | 3 46 49.13 | 24 8 33.45 | 40.33 | 7.62 | 0.30 | 0.12 |
| 23 | 3 46 48.54 | 24 0 40.57 | 21.44 | 6.09 | 0.52 | 0.10 |
| 24 | 3 46 47.23 | 24 1 28.87 | 81.81 | 10.25 | 0.40 | 0.08 |
| 25 | 3 46 46.71 | 24 7 57.58 | 42.13 | 7.55 | 0.45 | 0.11 |
| 26 | 3 46 44.29 | 23 59 11.53 | 18.54 | 6.09 | 0.38 | 0.16 |
| 27 | 3 46 43.52 | 23 59 41.51 | 109.11 | 11.23 | -0.21 | 0.11 |
| 28 | 3 46 41.94 | 24 3 51.17 | 18.67 | 5.75 | 0.25 | 0.19 |
| 29 | 3 46 41.29 | 24 4 26.01 | 20.28 | 5.39 | 0.35 | 0.18 |
| 30 | 3 46 40.99 | 24 7 46.32 | 26.35 | 6.41 | 0.75 | 0.05 |
| 31 | 3 46 39.34 | 24 1 46.22 | 425.09 | 21.19 | -0.24 | 0.11 |
| 32 | 3 46 39.30 | 24 6 11.17 | 745.54 | 28.04 | -0.51 | 0.04 |
| 33 | 3 46 38.80 | 23 58 5.12 | 64.03 | 9.49 | 0.31 | 0.12 |
| 34 | 3 46 35.84 | 23 58 0.39 | 209.48 | 15.33 | -0.36 | 0.08 |
| 35 | 3 46 35.66 | 24 7 52.78 | 33.41 | 7.07 | 0.57 | 0.10 |
| 36 | 3 46 35.45 | 24 1 35.44 | 36.65 | 7.21 | -0.60 | 0.17 |
| 37 | 3 46 32.39 | 24 5 47.81 | 69.26 | 9.33 | 0.45 | 0.09 |
| 38 | 3 46 32.06 | 23 58 58.15 | 789.31 | 28.90 | -0.14 | 0.04 |
| 39 | 3 46 31.11 | 24 7 1.74 | 280.49 | 17.61 | -0.27 | 0.07 |
| 40 | 3 46 30.32 | 24 8 53.80 | 31.43 | 7.68 | 0.40 | 0.17 |
| 41 | 3 46 30.41 | 24 5 5.63 | 20.37 | 6.48 | -0.19 | 0.28 |
| 42 | 3 46 29.47 | 24 0 41.88 | 31.14 | 7.07 | 0.38 | 0.17 |
| 43 | 3 46 28.15 | 23 57 54.75 | 37.42 | 7.81 | 0.25 | 0.17 |
| 44 | 3 46 28.01 | 23 55 32.46 | 37.26 | 7.62 | 0.35 | 0.16 |
| 45 | 3 46 25.30 | 24 9 36.06 | 336.23 | 19.29 | 0.00 | 0.06 |
| 46 | 3 46 23.70 | 23 55 38.87 | 293.24 | 18.95 | 0.58 | 0.04 |
| 47 | 3 46 23.36 | 24 1 51.15 | 49.90 | 8.49 | -0.23 | 0.17 |
| 48 | 3 46 23.39 | 24 8 56.02 | 15.40 | 5.48 | 0.64 | 0.08 |
| 49 | 3 46 21.56 | 24 7 17.02 | 48.32 | 8.66 | 0.71 | 0.07 |
| 50 | 3 46 20.85 | 23 58 58.52 | 123.08 | 12.57 | -0.01 | 0.10 |
| 51 | 3 46 19.52 | 23 56 53.05 | 1146.65 | 35.60 | -0.33 | 0.03 |
| 52 | 3 46 19.42 | 23 56 29.18 | 26.00 | 7.07 | 0.47 | 0.09 |
| 53 | 3 46 17.71 | 24 1 10.51 | 32.96 | 8.07 | 0.46 | 0.11 |
| 54 | 3 46 15.91 | 24 11 22.26 | 988.97 | 33.63 | -0.48 | 0.04 |
| 55 | 3 46 12.77 | 24 3 14.73 | 303.41 | 18.47 | -0.19 | 0.06 |
| 56 | 3 46 24.91 | 24 1 29.30 | 25.17 | 7.42 | 0.48 | 0.17 |
| 57 | 3 46 17.45 | 23 58 32.80 | 23.63 | 7.00 | 0.77 | 0.05 |
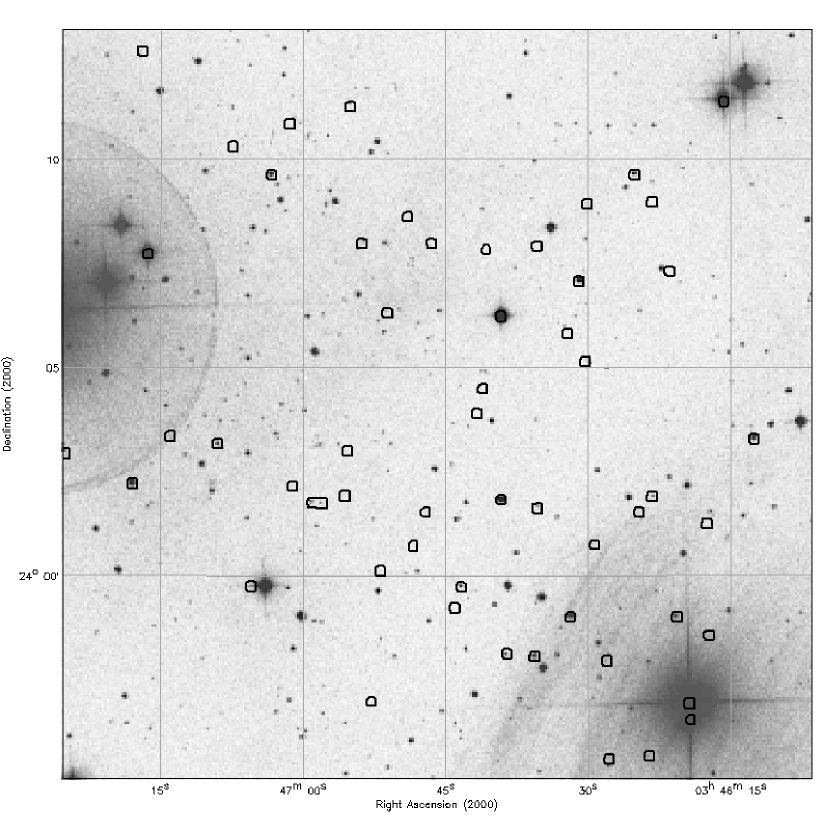
The 57 sources detected by Chandra in the Pleiades field are listed in Table 1. The first column refers to the source number, columns 2 and 3 specify the positions, columns 4 and 5 list the counts and the statistical error on the counts, and columns 6 and 7 list the hardness ratios (discussed further in Section 3.2). Figure 2 shows the ACIS-I detections (little black boxes) overplotted on an optical image of the Pleiades field of view. The optical image used is from the “skyview” database (operated by NASA/GSFC), which incorporates the “Digitized Sky Survey”. Note that we do not see optical counterparts for several X-ray detections in this image and conversely, we do not have X-ray detections for several optically bright stars in the field.
| Number | Optical | Offset | Corrected | X-ray | V | Spectral | Member |
|---|---|---|---|---|---|---|---|
| counterpart | () | offset() | counts | type | |||
| 51 | hii 980 | 3.3 | 1.28 | 1147 | 4.18 | B6IV | Y |
| 54 | hii 956 | 3.0 | 1.10 | 989 | 7.96 | A7V | Y |
| 4 | hii 1338 | 2.0 | 0.15 | 185 | 8.69 | F3V | Y |
| 32 | hii 1122 | 2.7 | 1.00 | 745 | 9.29 | F4V | Y |
| 31 | hii 1124 | 1.9 | 0.33 | 425 | 12.32 | K1V | Y |
| 2 | hii 1355* | 1.8 | 0.51 | 785 | 14.02 | K6V | Y |
| 34 | hii 1094 | 2.1 | 0.38 | 209 | 14.02 | KV | Y |
| 55 | hii 930* | 2.3 | 0.67 | 303 | 14.20 | KV | Y |
| 39 | hii 1061 | 2.1 | 0.16 | 280 | 14.21 | K5V | Y |
| 38 | hcg 225* | 2.7 | 0.77 | 789 | 14.55 | – | N |
| 9 | hii 1280* | 1.4 | 1.11 | 292 | 14.57 | K7.5V | Y |
| 47 | hcg 218 | 1.4 | 0.9 | 50 | 15.63 | – | N |
| 45 | hcg 219* | 1.6 | 0.43 | 336 | 15.83 | KV | Y |
| 1 | hhj 427 | 3.4 | 1.42 | 75 | 16.10 | MV | Y |
| 13 | hhj 299* | 1.1 | 1.11 | 85 | 17.60 | MV | Y |
| 18 | MHO-8 | 2.2 | 1.65 | 12 | 18.92 | MV | ? |
| 36 | hhj 140 | 0.9 | 2.1 | 37 | 19.00 | MV | Y |
| 17 | MHO-9 | 3.3 | 2.43 | 27 | 19.02 | MV | ? |
| ††footnotetext: Hii refers to the second list in Hertzsprung (1947), sometimes also referred to as Hz; HCG refers to the catalog of Haro, Chavira & Gonzalez (1982); HHJ is the Hambly, Hawkins and Jameson catalog (1991); MHO objects are from the Mount Hopkins survey (Stauffer et al. 1998). ††footnotetext: * indicates a star has flared during the observation. Discussion in sections 3.4 and 3.5. ††footnotetext: ? indicates uncertain membership. |
We checked for optical counterparts to our detections by comparing against a compiled master list of sources in the Pleiades, including recently conducted deep surveys to detect brown dwarfs. The optical counterparts which lie within 5 of the X-ray detections are presented in Table 2. We also tested for counterparts within 10 to see if we picked up any additional sources, but we did not. Figure 3 shows a plot of offsets between the Chandra detections and the optical positions of the well-cataloged Pleiades members. The largest offset is 3.3. Since the position offsets are mostly in the same direction, we believe that the pipeline-processed Chandra aspect solution could be in error and therefore obtained a least squares correction to the aspect solution. The best fit is obtained if we shift the X-ray positions by RA = –0.60 and Dec = +1.88. The corrected offsets are listed in column 4 of Table 2. The correction reduces the mean offset from 2.18 to 0.97.
In some cases, the Chandra image resolved sources previously thought to be single (from ROSAT data) into multiple sources. This will be discussed further in an upcoming paper. Note that only 18 of the sources detected by Chandra can be definitely correlated with optical counterparts from our master list. Although there have been several deep surveys in the Pleiades (e.g., Zapatero Osorio et al. (1999); Bouvier et al. (1998)) these typically have not included the core of the cluster where our observations lie.
3.1 Keck photometry
In order to determine whether the X-ray sources without any optical counterparts are very low mass members of the Pleiades, we obtained some follow-up photometry of these fields. We obtained CCD images at the Keck II telescope using the Low Resolution Imaging Spectrograph (LRIS; Oke et al. (1995)) on January 6, 2000. Three fields were observed, centered at 03:46:55, +24:07:00; 03:46:46, +23:59:00; and 03:46:24, +24:06:00 (J2000). The field of view of LRIS is 67.8, with a scale of 0.215 arcsec/pix. Thus, we covered 140.4 arcmin2, or about 60% of the area of our Chandra image. For each field we obtained two exposures with the standard broadband filter R, with exposure times 90 and 600 seconds; and two exposures in the I-band, with exposure times of 60 and 300 seconds. Stars brighter than R=16.9 and I=16.5 are saturated in our short exposures. Our detection limit for point sources (5 ) is R=24.4, I=23.5.
These observations were bracketed by images of the cool star CFHT-Pl-20, for which R, I photometry is available in Bouvier et al. (1998). Martín et al. (2000) have shown that CFHT-Pl-20 is a low-mass field star, and not a Pleiades member. We used CFHT-Pl-20 as a standard to calibrate our data. Thus, our R and I photometry is in the same system as that of Bouvier et al. (1998). We reduced the data using standard IRAF/DIGIPHOT routines. We performed point spread function (PSF) photometry of all the sources detected with DAOFIND. The FWHM of the PSF ranged from 2.1 to 3.6 pixels (0.45 to 0.77), depending on the position on the detector. All the data was obtained at airmass less than 1.15. However, due to thin cirrus, our data are not photometric. We see scatter in the photometry of the stars of the CFHT-Pl-20 field of up to 0.15 magnitudes in I-band and up to 0.07 magnitudes in R-band. Adding the contribution of this scatter and the photon-noise errors, the errors in our photometric measurements are better than 0.2 mag., which is sufficient for our purposes of identifying faint optical counterparts to the X-ray sources.
Figure 4 shows an I vs. R-I plot for the Keck sources that lie within 10 of the Chandra detections. From this figure, it is seen that the Keck sources are too blue to be low mass Pleiades members. We were able to find optical counterparts for 21 of the 39 “mystery sources”, but the Keck photometry covers only about 60% of the Chandra field of view. Some Chandra detections might indeed be low mass Pleiades members as discussed in the next section.
3.2 Hardness ratios
Since the ACIS-I detectors have intrinsic energy resolution, we can examine the spectral properties of the detected sources. Since most of the sources have insufficient counts to form a spectrum, we will use hardness ratios. As discussed below, this is an important constraint on the nature of these sources.
Hardness ratios were computed using the following method. Starting with the level-2 events list, we formed a soft (0-1 keV) and a hard (1-3 keV) image. The critical values of the pulse height amplitude (pha) corresponding to these energy bounds was determined using a redistribution matrix file (rmf) derived from the appropriate FITS embedded function (FEF) file. Next, we used “wavdetect” to find all of the sources in each image, using a very low false-alarm probability (FAP) of 10-4. We used such a low FAP in order to detect as many of the full-band sources as possible. We then attempted to identified our 57 cataloged sources in the soft and hard band images (with a spatial tolerance of 3), and measured their soft and hard band count rates. This procedure allowed the soft and hard band count rates to be measured for all but 15 of the faintest sources. For these 15 sources, we measured the soft and hard band count rates by manually extracting and counting the photons from the events list using the source position as determined from the full band image. Note that the numerous spurious ‘sources’ found in the hard and soft band images due to the low FAP of are irrelevant since we base our identifications on a much more rigorous search of the full band image.
Given the soft and hard band count rates, we define a hardness ratio for each source as:
| (3-1) |
and compute the standard error in that ratio assuming Poisson statistics in each band. In order to use the hardness ratio to constrain the nature of these sources, we have used XSPEC to compute HR for a few canonical spectra. We find that a standard AGN spectrum (with photon index, , and absorbed by the Galactic column density in the direction of the Pleiades of NH=1.11021 cm-2, Dickey & Lockman (1990)) would have HRAGN = +0.35. In practice, luminous AGN may be harder than this (i.e. ), and may have intrinsic absorption. Both of these effects will tend to make the source harder (i.e. HR 0.35). Ultrasoft AGN (such as narrow line Seyfert 1 galaxies; Boller, Brandt, & Fink (1996)) can have photon indices as soft as , giving HR. Hence, any source with HR is unlikely to be an AGN. Indeed, no known type of extragalactic X-ray source will be softer than this once the effects of the Galactic absorption have been taken into account. It is important to note that the source counts of Mushotzky et al. (2000), corrected for the relatively high column density along the Pleiades line of sight, imply extragalactic sources in our field.
Given the strong soft X-ray absorption when looking out of our Galaxy, any source softer than HR is likely to be a stellar source in our Galaxy. However, the converse is not true – stellar sources may well be harder than this critical threshold. To be more quantitative, a star with an X-ray spectrum characterized as a thermal plasma spectrum (kT=0.5keV) absorbed by the column density to the Pleiades will have HR. On the other hand, choosing keV or keV gives HR and HR respectively, thereby demonstrating that plausible stellar X-ray spectra can give a wide variety of hardnesses ranging from very-soft to moderately hard.
Examining the hardness ratios for 16 Pleiades members, we see that they are all rather soft, spanning the range from HR to HR. There is a slight tendency for the bright members with V10 to be soft X-ray sources (Fig. 5a). A histogram of the hardness ratio for the Pleiades members and the other X-ray sources shows a very clear demarcation — the vast majority of the 41 X-ray sources that are not identified with Pleiades members are hard. In addition, the Keck photometry available for some of these other sources show that they are too blue to be Pleiades low mass members. We suggest that the ten sources with HR0.5 are almost certainly background AGN, probably with a large amount of intrinsic absorption. These are exactly the type of objects believed to make up the hard X-ray background (Comastri et al. (1995)). An additional 22 non-Pleiades sources have HR consistent with the canonical AGN value HR and are also likely to be background AGN. The remaining 9 non-Pleiades sources could be either ultra-soft AGN or previously unknown low mass stars either in the Pleiades or along the Pleiades line of sight. In particular, we note that the softest 4 of these sources have hardness ratios consistent with HR and hence might be too soft to be extragalactic sources. Unfortunately, more data is required in order to reduce the error bars on HR and make this conclusion a firm one.
3.3 Flux determination
To determine fluxes for the Chandra detections, we started by extracting spectra for the X-ray bright sources that have optical counterparts. We then utilized the package “XSPEC” to fit a two-temperature Mekal model assuming a hydrogen column density to the Pleiades of NH = 1020.5 cm-2 (Caillault & Helfand (1985)), kT1 was fixed to 0.544 keV (Gagné et al. (1999)) and kT2 was allowed to vary. We determined the corrected fluxes in the 0.5-2.0 keV range and found that the mean counts-to-flux conversion factor was 1.5510-16 erg s-1 cm-2. Assuming a constant counts-to-flux conversion factor, we derived fluxes for all our detections. Figure 6 shows a histogram of fluxes for the Chandra detections, the known Pleiades members are shown as dashed lines.
Assuming a distance of 127 pc to the Pleiades to be consistent with previous ROSAT measurements (Stauffer et al. (1994)), we determined the luminosities for the known Pleiades members. Although there are only a few known Pleiades members in our sample, the lowest flux measured corresponds to log(Lx)=27.5. This is an order of magnitude fainter than the comprehensive ROSAT survey carried out by Stauffer et al. (1994). We found that the difference between the ROSAT and Chandra luminosities for the sources in common between our dataset and the ROSAT survey varies from 10% to a factor of 3. We suspect that source variability and the CTI effects may account for the difference. This issue will be explored further in paper 2.
3.4 Coronal variability and the early-type stars
Light curves were extracted for all 57 detected sources; we used the CIAO tool “dmextract” to produce light curves binned in 2000 second intervals for the sources with more than 100 counts, and binned the sources with less than 100 counts more coarsely (8000 second bins). We assessed whether the stars had flared using two techniques: (i) a simple visual examination of the light curves, and (ii) determining the values resulting from fitting a constant model to the light curve and finding those cases where the constant model is rejected at the 99% level (Bevington & Robinson (1992)).
Figure 7 shows a panel of representative light curves for some of the stars in the sample: one B sub-giant, one A-star, one F-dwarf (none of which are variable), a K dwarf that has flared, an M dwarf that has flared and an M dwarf that is not variable.
A long standing question is whether A stars have coronae or whether the X-ray emission sometimes seen from early-type stars is due to an unseen later-type companion (Grillo et al. (1992); Schmitt et al. (1993); Micela et al. (1996)). Most X-ray surveys of clusters with early-type members find that only a small fraction of the sample emit X-rays. This has been interpreted as being consistent with the scenario of a low-mass companion emitting X-rays. While our limited data set does not allow us to make a definitive statement concerning whether Pleiades age A-type stars are intrinsic X-ray sources or the emission is from late-type companion stars, the increased sensitivity of Chandra compared to ROSAT does allow us to identify an interesting trend that should be pursued in subsequent observations. With the more sensitive Chandra data, we can bring source variability and X-ray hardness ratio data into the analysis. The four “early-type” stars in the sample (spectral types B6IV, A7V, F3V, and F4V) are not variable, have soft hardness ratios (HR between –0.33 and –0.56), and have large X-ray fluxes (an average of 767 X-ray counts). By comparison, five of the eight K stars in our sample are variable in X-rays. There is a large difference between the five K stars that are variable (an average of 501 counts and HR between –0.33 and +0.0) and the three K stars that are not variable (an average of 180 counts and HR between –0.36 and –0.23).
With these data we now consider the hypothesis that the emission from the sample of four “early-type” stars is due to putative K stars companions. If we assume that the X-ray emission from the four “early-type” stars is produced by K dwarf companions like the five variable stars, then the mean X-ray count rates could be explained (767 counts for the “early-type” stars vs 501 for the variable K stars), but the absence of X-ray variability and soft HRs of the “early-type” stars cannot be explained. If, on the other hand, we assume that the companion stars are like the three nonvariable K stars, then the average X-ray flux of the early-type stars is 4.3 times too large (767 vs 180 counts). The only alternative left is that the B6IV–F4V stars are intrinsic X-ray sources. This admittedly unorthodox conclusion must be considered tentative at this point as additional long Chandra observations of many A-type stars are needed to confirm or refute the hypothesis. Such observations are now underway.
3.5 X-ray emission from very low mass members
Convective, rapidly rotating stars have dynamo-generated magnetic fields and hence coronal heating. Stars later than a spectral type of M5 are fully convective and thus cannot have the standard solar-like () dynamos. Instead, strong chaotic magnetic fields can be generated by thermally driven turbulent convection without the need for helicity or a lower boundary with a radiative core as likely occurs just below the solar photosphere (Cattaneo (1999)). A survey of late-M dwarfs conducted using ROSAT (Fleming et al. (1993)) showed that late-M dwarfs also emit X-rays and thus must have hot coronae. Therefore, it is fully expected that fully convective BDs, with or without rapid rotation, should also be X-ray sources. Very late M-dwarfs such as VB 8 (spectral type M7; Giampapa et al. (1996)) and VB 10 (spectral type M8; Fleming, Giampapa, & Schmitt (2000)) have been seen only during flares and only upper limits exist for their quiescent flux. Also, X-ray emission from brown dwarfs had been seen only in very young objects (age 1 Myr, Neuhäuser et al. (1999)) until recently. Chandra has now detected a flare on the relatively old (500 Myr) nearby field brown dwarf LP 944-20 (Rutledge et al. (2000)). We have detected X-ray emission from M dwarfs (including some late-M stars) in the Pleiades. It is worth noting that of five possible M dwarf Pleiades members, (hhj 427, hhj 299, hhj 140, MHO-8 and MHO-9) only one star has flared (hhj 299); we have detected quiescent fluxes for the remaining objects.
There are also several potential BDCs seen in the Keck images obtained for follow-up photometry of the Chandra detections with no optical counterparts. While the substellar nature of these objects needs to be confirmed with follow-up spectroscopy, none of these BDCs have been detected in our Chandra dataset. We can put an upper limit of log L27.5 on X-ray emission from these objects if they are confirmed to be Pleiades brown dwarfs. We will be obtaining follow-up spectroscopy of these potential brown dwarfs. Results will be presented and discussed in the succeeding paper.
4 Conclusions
We have presented results of a 36 ksec observation using ACIS-I on Chandra of the core of the Pleiades cluster. We found that most of our detections did not have previously known optical counterparts and we obtained follow-up photometry utilizing the Keck LRIS. Several sources seen in the Chandra dataset but with no previous IDs have been detected in the Keck dataset. Hardness ratio calculations indicate that many of these sources are likely extra-galactic, but a small fraction are soft and may be good candidates for Pleiades very low mass stars or substellar objects. We have also detected quiescent X-ray emission from some late-M dwarfs in the Pleiades not previously seen in X-rays.
Some brown dwarf candidates have been identified in the Keck dataset. Despite ACIS-I’s great sensitivity, these BDCs have not been detected in X-rays. If planned follow-up spectroscopy of these objects confirms them to indeed be brown dwarfs, this lack of X-ray emission from brown dwarfs in the Pleiades will shed light on the role of coronal heating and magnetic fields in older brown dwarfs.
A subsequent paper will present the results of the remaining 24 ksecs of data and present the Keck photometry with possible IDs for the sources, as well as the results of any follow-up spectroscopy. Additionally, as these two datasets were taken 6 months apart, we will be able to study the X-ray variability of the detected objects.
Appendix
We present a table of the 15 additional sources picked up by “wavdetect” if FAP is set to 10-5 rather than 10-6.
| RA(J2000) | Dec(J2000) | X-ray counts | Error |
|---|---|---|---|
| 3 47 11.70 | 24 6 53.58 | 12.89 | 4.69 |
| 3 47 4.02 | 23 59 42.68 | 8.41 | 4.13 |
| 3 47 3.30 | 24 12 14.07 | 8.79 | 4.47 |
| 3 46 59.54 | 24 4 21.01 | 15.93 | 5.83 |
| 3 46 49.03 | 24 0 3.47 | 12.24 | 5.29 |
| 3 46 48.08 | 24 3 34.63 | 8.22 | 4.13 |
| 3 46 43.64 | 24 1 20.57 | 7.70 | 4.13 |
| 3 46 34.10 | 24 1 49.53 | 20.95 | 7.00 |
| 3 46 12.70 | 24 3 45.38 | 20.67 | 6.48 |
| 3 46 9.84 | 24 9 54.32 | 23.45 | 6.41 |
| 3 47 22.49 | 24 0 9.89 | 18.50 | 6.17 |
| 3 46 57.40 | 24 13 7.10 | 13.09 | 5.39 |
| 3 46 46.01 | 24 5 3.26 | 21.74 | 6.86 |
| 3 46 15.95 | 24 8 26.20 | 9.51 | 4.24 |
| 3 46 7.15 | 24 11 5.91 | 9.51 | 3.87 |
References
- Bevington & Robinson (1992) Bevington, P.R. & Robinson, D.K. 1992, Data Reduction and Error Analysis for the Physical Sciences, 2nd edition, McGraw Hill
- Boller, Brandt, & Fink (1996) Boller, T., Brandt, W.N., & Fink, H. 1996, A&A, 305, 53
- Bouvier et al. (1998) Bouvier, J., Stauffer, J. R., Martín, E. L., Barrado y Navascués, D., Wallace, B. & Bejar, V. J. S., 1998, A&A, 336, 490
- Caillault & Helfand (1985) Caillault, J.-P. & Helfand, D.J. 1985, ApJ, 289, 279
- Cattaneo (1999) Cattaneo, F. 1999, ApJ, 515L, 39
- Comastri et al. (1995) Comastri, A., Setti G., Zamorani G., & Hasinger G., 1995, A&A, 296, 1
- Dickey & Lockman (1990) Dickey, J.M. & Lockman, F.J. 1990, ARA&A, 28, 215
- Festin (1997) Festin, L. 1997, A&A, 322, 455
- Fleming et al. (1993) Fleming, T.A., Giampapa, M.S., Schmitt, J.H.M.M., & Bookbinder, J.A. 1993, ApJ, 410, 387
- Fleming, Giampapa, & Schmitt (2000) Fleming, T.A., Giampapa, M.S., & Schmitt, J.H.M.M. 2000, ApJ, 533, 372
- Gagné, Caillault, & Stauffer, (1995) Gagné, M., Caillault, J.-P., & Stauffer, J.R. 1995, ApJ, 445, 280
- Gagné et al. (1999) Gagné, M., Valenti, J.A., Linsky, J.L., Tagliaferri, G., Covino, S., & Gudel, M. 1999, ApJ, 515, 423
- Giampapa et al. (1996) Giampapa, M.S., Rosner, R., Kashyap, V., Fleming, T.A., Schmitt, J.H.M.M., & Bookbinder, J.A. 1996, ApJ, 463, 707
- Grillo et al. (1992) Grillo, F., Sciortino, S., Micela, G., Vaiana, G.S., & Harnden, F.R.,Jr. 1992, ApJS, 81, 795
- Hambly, Jameson, & Hawkins (1993) Hambly, N.C., Hawkins, M.R.S., & Jameson, R.F. 1993, A&AS, 100, 607
- Haro, Chavira & Gonzalez (1982) Haro, G., Chavira, E., & Gonzalez, G. 1982, Boll. Obs. Tonantzintla y Tacubaya, 3, 3
- Hertzsprung (1947) Hertzsprung, E. 1947, Ann. Leiden Obs., 19, No. 1A
- Jeffries (1999) Jeffries, R.D. 1999, in “Solar and Stellar Activity: Similarities and Differences”, ASP Conference Series 158, ed. C.J. Butler & J.G. Doyle, 1999, p.75
- Krishnamurthi et al. (1998) Krishnamurthi et al. 1998, ApJ, 493, 914
- Lucas & Roche (2000) Lucas, P.W. & Roche, P.F. 2000, MNRAS, 314, 858
- Luhman (1999) Luhman, K.L. 1999, ApJ, 525, 466L
- Martín et al. (2000) Martín, E. L. et al. 2000, ApJ, in press
- Micela et al. (1996) Micela, G., Sciortino, S., Kashyap, V., Harnden, F.R., Jr., & Rosner, R. 1996, ApJS, 102, 75
- Micela et al. (1999) Micela, G., Sciortino, S., Harnden, F.R., Kashyap, V., Rosner, R., Prosser, C.F., Damiani, F., Stauffer, J.R., & Caillault, J.-P. 1999, A&A, 341, 751
- Mushotzky et al. (2000) Mushotzky, R.F., Cowie L.L., Barger A.J., & Arnaud K. A., 2000, Nature, 404, 459
- Neuhäuser et al. (1999) Neuhäuser, R. et al. 1999, A&A, 343, 883
- Oke et al. (1995) Oke, J. B. et al. 1995, PASP, 107, 375
- Patten & Simon (1996) Patten, B.M., Simon, T. 1996, ApJS, 106, 489
- Pinfield et al. (2000) Pinfield, D.J., Hodgkin, S.T., Jameson, R.F., Cossburn, M.R., Hambly, N.C., & Devereux, N. 2000, MNRAS, 313, 347
- Prigozhin et al. (2000) Prigozhin, G., Kissell, S., Bautz, M., Grant, C., LaMarr, B., Foster, R., & Ricker, G. 2000, in “International Symposium on Astronomical Telescopes and Instrumentation”, Proc. SPIE, 4012, in press
- Prosser et al. (1996) Prosser, C.F., Randich, S., Stauffer, J.R., Schmitt, J.H.M.M., & Simon, T. 1996, AJ, 112, 1570
- Queloz et al. (1998) Queloz, D., Allain, S., Mermilliod, J.-C., Bouvier, J., & Mayor, M. 1998, A&A, 335, 183
- Randich et al. (1995) Randich, S., Schmitt, J.H.M.M., Prosser, C. F., & Stauffer, J.R. 1995, å, 300, 134
- Reid, Tinney, & Mould (1994) Reid, N., Tinney, C.G., & Mould, J. 1994, AJ, 108, 1456
- Rutledge et al. (2000) Rutledge, R.E., Basri, G., Martín, E.L., & Bildsten, L. 2000, ApJL (in press)
- Schmitt et al. (1993) Schmitt, J.H.M.M., Zinnecker, H., Cruddace, R., & Harnden, F.R.,Jr. 1993, ApJ, 402L, 13
- Soderblom et al. (1993) Soderblom, D.R., Stauffer, J.R., Hudon, J.D., & Jones, B.F. 1993, ApJS, 85, 315
- Stauffer et al. (1994) Stauffer, J.R., Caillault, J.-P., Gagné, M., Prosser, C.F., & Hartmann, L.W. 1994, ApJS, 91,625
- Stauffer et al. (1998) Stauffer, J.R. et al. 1998, ApJ, 504, 805
- Stauffer et al. (1999) Stauffer, J.R. et al. 1999, ApJ, 527, 219
- Stauffer (2000) Stauffer, J. 2000, in “Stellar Clusters and Associations: Convection, Rotation, and Dynamos”, ASP Conference Series, vol. 198, ed. R. Pallavicini, G. Micela, and S. Sciortino, 2000, p. 255
- Stern et al. (1995) Stern, R.A., Schmitt, J.H.M.M., Pye, J.P., Hodgkin, S.T., Stauffer, J.R., & Simon, T. 1995, ApJ, 427, 808
- Townsley et al. (2000) Townsley, L.K., Broos, P.S., Garmire, G.P., & Nousek, J.A. 2000, ApJ, 534L, 139
- Zapatero Osorio, Rebolo, & Martín (1997) Zapatero Osorio, M.R., Rebolo, R., & Martín, E.L. 1997, A&A, 317, 164
- Zapatero Osorio et al. (1999) Zapatero Osorio, M.R., Rebolo, R., Martín, E.L., Hodgkin, S.T., Cossburn, M.R., Magazzù, A., Steele, I.A., Jameson, R.F. 1999, A&AS, 134, 537