Size-selective concentration of chondrules and other small particles
in protoplanetary nebula turbulence
Jeffrey N. Cuzzi1, Robert C. Hogan2, Julie M. Paque3, and Anthony R. Dobrovolskis4
1) Ames Research Center, NASA, cuzzi@cosmic.arc.nasa.gov; 2) Symtech, inc., hogan@cosmic.arc.nasa.gov; 3) SETI Institute, jpaque@mail.arc.nasa.gov; 4) Univ. of California, Santa Cruz, dobro@cosmic.arc.nasa.gov; mailing address for all authors: Mail Stop 245-3, Moffett Field CA 94035-1000.
Astrophysical Journal, in press (expect January 1 2001 issue)
Abstract
Size-selective concentration of particles in a weakly turbulent protoplanetary nebula may be responsible for the initial collection of chondrules and other constituents into primitive body precursors. This paper presents the main elements of this process of turbulent concentration. In the terrestrial planet region, both the characteristic size and size distribution of chondrules are explained. “Fluffier” particles would be concentrated in nebula regions which were at a lower gas density and/or more intensely turbulent. The spatial distribution of concentrated particle density obeys multifractal scaling, suggesting a close tie to the turbulent cascade process. This scaling behavior allows predictions of the probability distributions for concentration in the protoplanetary nebula to be made. Large concentration factors () are readily obtained, implying that numerous zones of particle density significantly exceeding the gas density could exist. If most of the available solids were actually in chondrule sized particles, the ensuing particle mass density would become so large that the feedback effects on gas turbulence due to mass loading could no longer be neglected. This paper describes the process, presenting its basic elements and some implications, without including the effects of mass loading.
1 Background and Introduction:
Primitive (unmelted) chondritic meteorites are composed in large part of mm-sized, once-molten silicate particles (chondrules) and metallic grains out of mineralogical equilibrium with each other. Many chondrites contain inclusions of refractory minerals that have been dated as the oldest objects formed in the solar system (MacPherson et al 1989, 1995). The chemical, isotopic, mineralogical and petrographic properties of individual chondrules themselves imply that independent entities were melted by some “flash heating” event in the gaseous protoplanetary nebula, and remained molten for fairly short times (less than an hour; Jones et al 2000). Chondrules are diverse in chemistry but are narrowly size-sorted (Grossman et al 1989, Jones and Brearley 1999), apparently by their aerodynamic cross section (Dodd 1976, Skinner and Leenhouts 1991, Keubler et al 1999); the least mechanically evolved pieces in chondrites have the appearance of being gently brought together (Metzler et al 1992) and subsequently compacted to solid density. Various hypotheses have been advanced to explain these properties (see, e.g., Boss 1996, Hewins et al. 1996, Hewins 1997, Connolly and Love 1998, and Jones et al 2000 for recent general reviews and discussion), but the puzzle remains unsolved. The fact that many primitive meteorites are composed of up to 70-80% chondrules by volume (Grossman et al 1989) implies that the chondrule formation and accumulation processes were of widespread and significant importance in the very earliest stages of the accretion of the asteroidal objects which provide the parent bodies for these primitive meteorites. Since the terrestrial planets apparently formed from various proportions of known meteorite types, one expects that the process extended beyond the current asteroid belt and that understanding these early stages is important for understanding planetary accretion overall. These stages of circumstellar disk evolution relates to regions and epochs when the particulate opacity is high, but when some particle growth has occurred - and are thus also of great interest for study at infrared and millimeter wavelengths.
Prior work (Dubrulle et al 1995, Cuzzi et al 1996) has pointed out that, unless the turbulent kinetic energy in the nebula gas is vanishingly small (see Section 2), chondrule-sized particles are unable to settle individually to the nebula midplane, where most growth to planetesimal size must occur. Instead, Cuzzi et al (1996; henceforth CDH96) proposed that, following their initial melting, and throughout multiple recurrences of similar heating events (Wasson 1996, Connolly and Love 1998, Desch and Cuzzi 2000), chondrules pursue an extended free-floating existence under plausible conditions of nebula gas density and turbulent intensity in the terrestrial planet region, successively encountering zones of varying concentration enhancement (section 5.1), until by chance they encounter an unusually dense zone where they might physically coalesce into much more massive, but still not solid, entities. In a second stage, such entities - dense clusters of particles - might have enough coherence to resist disruption as they settle to the midplane, or to be collected in a different process into the cores of the largest eddies (discussed below) for subsequent accumulation into planetesimals. Or, dense zones may only provide environments of enhanced collisional accumulation of chondrules. The second stage remains unstudied and qualitative; here we focus on the first stage.
The process of interest is known as preferential concentration or turbulent concentration (TC). The nature of this process is that isotropic, homogeneous, 3D turbulence provides numerous fluid zones of low vorticity and high strain in which particles having a narrowly defined range of aerodynamic properties can be significantly, but usually briefly, concentrated (discussed further below). This somewhat counterintuitive effect was first alluded to theoretically (Maxey 1987), subsequently demonstrated numerically (Squires and Eaton 1990, 1991; Wang and Maxey 1993), and recently demonstrated experimentally as well (Fessler et al 1994; for a review see Eaton and Fessler 1994). The concentration factor is the ratio of the local particle density to its global average. In numerical studies to date (Squires and Eaton 1990, 1991; CDH96, Hogan et al 1999), turbulence with Reynolds numbers of contains dense zones where the concentration factors reach 40-300 for optimally concentrated particles. We extended numerical studies of this effect, and applied scaling relationships to predict its behavior under protoplanetary nebula conditions (CDH96, Cuzzi et al 1998). We found that under canonical inner nebula conditions, particles with the size and density of chondrules would be optimally concentrated. Here, we show that the process is easily generalized to a wide range of fluffier particles in lower density regions of the nebula (section 3).
We note that TC is a quite different process than the superficially similar effect in which far larger (meter-and-larger-radius) particles with stopping times comparable to or larger than the eddy times of the largest eddies (with frequencies comparable to the orbit period) can accumulate near the centers of such eddies (Barge and Sommeria 1995, Tanga et al 1996, Bracco et al 1999). Klahr and Henning (1997) showed concentration of mm-sized particles within large, slow, 2D circulation patterns (not turbulent eddies). However, unless these slow circulation patterns represent the primary kinetic energy reservoir of the (non-Keplerian) fluid motions, concentration of such small particles will not occur. That is, if the nebula turbulence has a normal 3D cascade with its energy peak at spatial and temporal scales which are a small fraction of the nebula scale height and orbital period (as normally implied by turbulent “-models”described in section 2), chondrule-sized particles will diffuse faster than they can be concentrated by such large, slow circulation patterns. For example, numerical calculations by Supulver and Lin (1999), which modeled eddy motions on a wide “inertial range” of spatial and temporal scales, as well as our own calculations, show that chondrule-sized particles do not accumulate in large eddies for two reasons: first, their trajectories are mixed by the smaller eddies, and second, “real” eddies in homogeneous turbulence - even the largest ones - dissipate within a single overturn time. Under these circumstances (assumed in this paper), mm-sized particles would be nearly uniformly dispersed by 3D turbulence, as one would naively expect for such small particles which are trapped to nearly all fluid parcels, if it were not for the role of turbulent concentration as described herein. The true energy spectrum and dimensionality of nebula turbulence is, however, not currently understood, and is the subject of several active research tasks.
Our emphasis in testing these concepts has been to compare our predictions with the properties of easily identified and studied chondrules and chondrites. For instance, we have now studied the size distribution of preferentially concentrated particles in detail, and found it to be insensitive to, or independent of, Reynolds number (Hogan and Cuzzi 2000); here we show that this predicted size distribution is in very good agreement with a typical chondrule size distribution (section 4).
While does increase systematically with increasing Reynolds number (CDH96), our prior estimates of concentrations at nebula Reynolds numbers, which are plausibly far larger than those accessible to numerical modeling, had required sizeable extrapolations. We have more recently shown that the spatial structure of the concentrated particle density field is a multifractal which has Reynolds-number-independent properties (Hogan et al 1999) and here will use this result to provide a firmer basis for predictions under nebula conditions (section 5).
The evolution of extremely dense clumps, within which interparticle collisons might entrap particles (CDH96) remains unstudied, and will require a better understanding of the behavior of turbulent concentration when the particle mass density exceeds that of the gas, and of particle ensembles whose density is large enough to affect the gas flow properties. In section 6 we discuss this important effect.
2 Turbulence and turbulent concentration (TC):
Homogeneous, isotropic, 3D turbulence is characterized by a cascade of energy through a range of scales, known as the inertial range, from the largest (or integral) spatial scale , having associated velocity , to the smallest (or Kolmogorov) scale where it is dissipated (Tennekes and Lumley 1972, Hinze 1975). The intensity of the turbulence is characterized by the Reynolds number, which can be written . Since dissipation occurs primarily on the small scales where molecular viscosity comes into play, more energetic (higher ) flows can drive turbulence through a wider inertial range, to smaller , for any given viscosity.
is ordinarily defined as , where is the molecular viscosity; here is the ratio of transport by macroscopic motions to that by molecular motions. This definition combines the velocity and length scales into a turbulent viscosity . The Reynolds stresses which appear in angular momentum transport equations are often modeled by this sort of turbulent viscosity (the “alpha model” of Shakura and Sunyaev 1973). However, in a Keplerian disk, the mere existence of turbulent motions (turbulent kinetic energy, leading to diffusivity of scalars) does not necessarily imply viscous transport of angular momentum (by a Reynolds stress, or torque, acting as a positive turbulent viscosity; Prinn 1990). This distinction is related to the possibility that the on-diagonal and off-diagonal terms of the stress tensor might have very different relative strengths in Keplerian disks than in more familiar turbulent environments (Kato and Yoshizawa 1997). While astrophysical “alpha-models” of protoplanetary disks emphasize turbulent viscosity in its angular momentum transport role, TC is more closely related to scalar diffusivity, or turbulent kinetic energy per unit mass density . Therefore, we distinguish two types of the familiar astrophysical . We first discuss the familiar Shakura-Sunyaev prescription, which defines the turbulent viscosity as , where is the sound speed and is the vertical scale height.
Without external drivers, the overall nebula is likely to be in a regime of Rossby number of order unity, where is the largest eddy frequency and is the orbital frequency. We thus rewrite in terms of these fundamental properties:
| (1) |
Thus
| (2) |
With the stipulation that the largest truly turbulent eddies (those that participate in the turbulent cascade) have frequencies no smaller than, but probably comparable to, the local orbital frequency , and . Occasionally it is assumed that , but this implies and thus , an implausible situation for genuine turbulence. The distinction is important for us, as we need to scale turbulent velocities and lengthscales independently. The important point is that the scaling parameter is “shared” by the length and velocity scales, rather than being associated with one or the other.
A scaling analysis cannot establish whether fluid motions with arbitrary and do in fact provide a positive Reynolds stress or “turbulent viscosity” given by their product; conversely, estimates of the magnitude of and from an observed turbulent viscosity and associated , as above, may misrepresent their actual magnitudes. This is because certain types of spatial correlations between “random” fluid motions are needed to provide a positive Reynolds stress, or turbulent viscosity, and this may not occur in systems which are strongly influenced by rotation or otherwise strongly perturbed (Prinn 1990, Kato and Yoshizawa 1997).
Another approach to determining is based on the turbulent kinetic energy per unit mass and an associated : , or . The mere presence of turbulent fluid motions with is sufficient to produce turbulent concentration, with no additional uncertainties about the degree and sign of the correlation between orthogonal components of the fluid motions as in (Prinn 1990). While this definition provides no insight into the turbulent length scale , we presume by analogy to the above argument that . With regard to the nebula, where properties are uncertain, we suppress the factor of (effectively ignoring the distinction between a single component of and its magnitude) and approximate the turbulent Reynolds number of the nebula by . Angular momentum may still be transported by a turbulent viscosity , but whether or not is peripheral to this work (Kato and Yoshizawa (1997) find that ).
Possible sources of include forcing by ongoing infall onto the disk in the very early stages (Cameron 1978, Prinn 1990), turbulent convection powered by release of gravitational energy into heat as the disk evolves (Lin and Papaloizou 1985, Cabot et al 1987; Goldman and Wandel 1994; Bell et al 1997), enforced Keplerian differential rotation (Dubrulle 1993), and magnetorotational instability or MRI (Balbus and Hawley 1991, 1998). Typical estimates of from these sources are - , and thus - .
However, uncertainties remain with all of the above mechanisms. The infall stage lasts only a relatively short fraction of the evolution lifetime of typical nebulae, and the magnetorotational instability will not act in the dense inner scale height of the disk where most of the mass and chondrules probably reside (Gammie 1996) and perhaps not even high in the nebula (Desch 2000). The validity of convection and differential rotation, acting by themselves, rests on their uncertain ability to be self-sustaining. This requires turbulence to be able to transport sufficient angular momentum outwards that mass can evolve inwards, releasing gravitational energy to be converted into turbulence. Several studies (most recently Stone and Balbus 1996) found that convective turbulence fails to produce outward angular momentum transport (positive Reynolds stresses). However, some recent 3D numerical studies, which better capture large azimuthal structures, seem to imply that it may in fact be able to do so (Klahr 2000a,b). Of course, as grains accumulate, opacity decreases and thermal convection may weaken. Differential rotation is free of this limitation (Dubrulle 1993), but numerical and analytical arguments by Balbus et al (1996) question differential rotation as a source for turbulence based on the energetics and stability of Keplerian disks. However, Richard and Zahn (1999) have suggested, based on laboratory analogues, that instability to turbulence in such systems requires a higher Reynolds number than accessible to current numerical models. Kato and Yoshizawa (1997) have shown that Keplerian rotation probably does not preclude some true turbulent viscosity (ie. positive Reynolds stress, or ), but as a much smaller fraction of the ambient turbulent kinetic energy () than under non-Keplerian conditions. Thus, it also remains in doubt whether turbulence driven by differential rotation alone can be self-sustaining. Non-steady situations might even need to be considered.
In short, the source of angular momentum transport is poorly understood, and it is not clear how disks evolve at all. However, while we still don’t understand the mechanism that allows them to do so, protoplanetary disks are observed to evolve with mass accretion rates in the range of /yr (Hartmann et al 1998) and thus have an associated gravitational energy release rate per unit area of (Lynden-Bell and Pringle 1974). Here, is the gravitational constant, is the mass of the central star, and is the distance from the central star.
Turbulent kinetic energy is dissipated at a rate of approximately , where is the local gas density and . If the gravitational energy is released where most of the mass resides, and converted into mechanical turbulence with efficiency , then for a disk in steady state with independent of radius, , or
| (3) |
Substituting and ,
| (4) |
For a typical “canonical” nebula with , cm sec-1, and g cm-2, with being any enhancement in mass over the “minimum mass” nebula density (Hayashi 1981; see also Cuzzi et al 1993), then
| (5) |
Some recent numerical calculations show to be at least several percent (H. Klahr, personal communication 1999); thus seems not to be out of the question in the 2-3 AU region where meteorite parent bodies form. Conversely, Dubrulle et al (1995) have shown that, in order for chondrule-sized particles to settle into a midplane layer having a density approaching that of the gas (a layer of thickness ), would need to be in the range (see also CDH96). For to be this low, equations 4 and 5 show that the conversion efficiency into turbulence would need to be less than for a disk with . Here we simply presume the presence of nebula turbulence at a weak level and explore the consequences. Henceforth, we identify the nebula “” as , and treat and its associated as characterized by and .
We assume the turbulence has a Kolmogorov-type inertial range, within which each length scale is characterized by velocity (Tennekes and Lumley 1972, CDH96) and eddy frequency , where the frequency of the largest eddy is set equal to , the local orbital frequency. Because the most interesting scales for particle concentrations are on the order of , and even , deviations from isotropy due to rotation are not a major concern. Particles smaller than the gas mean free path (i.e., smaller than several cm radius under nebula conditions) are in the Epstein drag regime (Weidenschilling 1977), and have a stopping time due to gas drag which is
| (6) |
where and are particle radius and internal density. The particle Stokes number determines the particle response to eddies of a particular size and frequency; previous studies have shown that the optimally concentrated particles have (Eaton and Fessler 1994; Hogan and Cuzzi 2000), that is, their stopping time is comparable to the Kolmogorov eddy turnover time.
3 Generality of turbulent concentration
Solving the relation under nebula conditions, CDH96 concluded that the optimally concentrated particles in the terrestrial planet region of a minimum mass nebula with would have radius and density comparable to those of chondrules. Here we generalize TC to the entire range of nebula conditions. Using the definition for (equation 6) to rewrite the expression for ,
| (7) |
CDH96 Substituted , where is the molecular mean free path, and g and cm2 are the mass and cross section of a hydrogen molecule. However, their expression for did not include the finite size or the Maxwellian velocity distribution of the gas molecules (cf. Kennard 1938; equations 106d and 126b), so their was too large by a factor of . Rearranging terms from equation (7) and correcting this oversight, we find
| (8) |
where is surface mass density at some distance in the nebula. In the last term we have adopted a canonical radial dependence of for a “minimum mass” nebula, with being some mass enhancement factor.
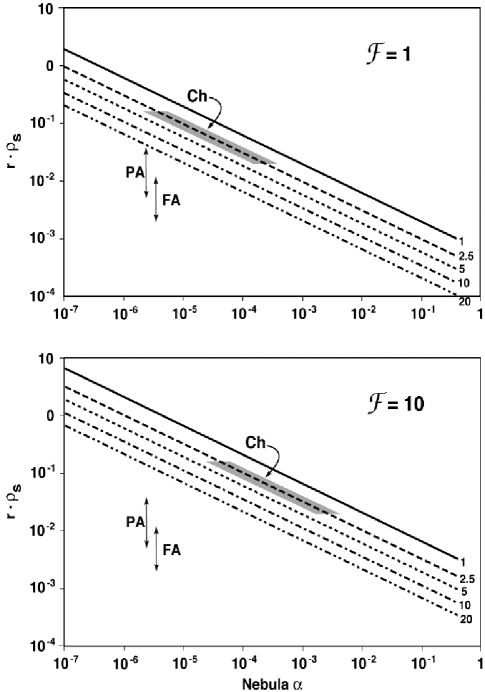
This relationship is shown in figure 1 for several different typical locations and two different nebula masses. The range of for most chondrules (Ch), obtained using data in Grossman et al (1989), is mapped along the line for AU, and indicates the range of required to concentrate them selectively. Higher values of (more intense turbulence) select smaller and/or lower density particles. In both cases, porous aggregates (PA), having considerably lower radius-density product than chondrules, can be optimally concentrated at the low gas densities which characterize the outer planet region or low density regions high above the nebula midplane. Such porous objects are easily produced because the low relative velocities in turbulence of both porous, low-density aggregates, and their constituent monomers, lead to large sticking efficiency and minimal disruption (Weidenschilling and Cuzzi 1993; Chokshi et al 1993; Dominik and Tielens 1997). It has also been suggested that extremely low density, intensely turbulent regions may concentrate tiny grains or very fluffy aggregates (FA) (Wood 1998). TC may thus have been ubiquitous, helping to initiate the formation of “cometesimals” from porous grain aggregates at 10-30 AU or speeding the accretion of dust particles at high elevations (low gas densities) even in the terrestrial planet region.
However, textural evidence might be difficult to obtain from this regime; subsequent compaction would obliterate evidence for any preferred size or density of easily squashed fluffy constituents. Chondrules and their parent chondrites, by nature of their availability and unique, persistent textures, provide the most obvious initial testing ground for turbulent concentration.
4 Concentrated particle size distribution
If dense clusters of particles are precursors of primitive bodies in any way, the relative abundance as a function of Stokes number for particles in dense regions should show some correspondence to the distributions found in chondrites. To further compare the predictions of TC with meteorite evidence, we have recently determined the detailed form of the size distribution of selectively concentrated particles (Hogan and Cuzzi 2000). Numerical simulations were performed with homogeneous, isotropic, incompressible 3D turbulence at three Reynolds numbers 62, 246, and 765 (these values differ from those given in Hogan et al. 1999 because we now adopt the more correct definition of as one component of the turbulent velocity rather than its magnitude). The particles can be given arbitrary aerodynamic stopping times ; their motions respond only to gas drag and are integrated in the spatial domain. Feedback by the particles onto the gas is not incorporated. The computationally intensive calculations are run on 16 Cray C90 cpus at Ames Research Center. Simulations were initiated with uniform spatial distributions of particles, themselves uniformly distributed in stopping time over the range = 0.1 - 6, and the relative equilibrium abundance of particles was studied as a function of and . In the large- limit of interest, the shape of the relative abundance distribution was found to be independent of both and and only very weakly dependent on the spatial binning assumed (relative to ) (Hogan and Cuzzi 2000). Thus, we believe the numerical results should be valid as a prediction of the size distribution in dense particle concentrations under nebula conditions. The theoretical results are adequately fit by a lognormal distribution over the core range = 0.5 to 2.0.

We compared our predictions with binned relative abundance data for chondrules disaggregated from one carbonaceous and four ordinary chondrites (Paque and Cuzzi 1997, 2000; Cuzzi et al 1999). While a few ostensibly similar data sets exist in the literature (eg. Hughes 1978, Eisenhour 1996, Rubin and Grossman 1987), they generally rely on radii measured microscopically from thin sections of meteorites, or even from disaggregated chondrules, and adopt some average chondrule density . However, recall from equation (6) that the aerodynamic stopping time , which selects particles for TC or any other aerodynamic sorting process, depends on the product for each object. Data for these meteorites imply that merely measuring the chondrule radius distribution and assuming some mean density will slightly, but noticeably, misrepresent the distribution because of chondrule-to-chondrule density variations (Cuzzi et al 1999, Paque and Cuzzi 2000).
In figure 2 we compare the particle abundance shape function from our numerical simulations (Hogan and Cuzzi 2000) with the meteorite data. The meteorite histograms were fit by lognormal functions and aligned horizontally with the predicted histogram by assuming that the optimally concentrated particle size-density product corresponds to . We conclude that TC by itself can explain the very narrow chondrule size distribution, whatever the chondrule formation process may have produced. There is evidence that both larger and smaller chondrules were created; TC would predict that these non-optimally sized particles were simply not concentrated to a sufficient degree for eventual incorporation into meteorites unless they were swept up into chondrule rims (if originally smaller) or broken to the proper size (if originally larger). Some particles of arbitrary size will always appear just by accident, perhaps captured by a dense cluster; parent body processes will confuse the situation further.
5 Probability distributions and multifractals:
As mentioned earlier, our numerical results (CDH96) are obtained at which are six orders of magnitude smaller than plausible nebula . Thus, it is very important to understand the -scaling of TC properties in detail. We believe this has become possible using a connection between TC and the -independent scaling properties of fractals, which are rooted in the properties of the turbulent cascade itself (Hogan et al 1999; henceforth HCD99). Fractals and multifractals are readily associated with cascade processes. Turbulence (and specifically its inertial range) is the archetype of a cascade process (Tennekes and Lumley 1972, Meneveau and Sreenivasan 1987, 1991), and considerable attention has been devoted to multifractals in turbulence (Frisch and Parisi 1985, Mandelbrot 1989).
A working definition of a fractal is a structure which is generated by sequential application of a scale-invariant rule on regularly decreasing spatial scales. Simple fractals with constant (but non-integer) dimension are invariant to changes in scale, and result from rules which produce a binary distribution of the local density (say, either 0 or 1). Examples of these are the Cantor set or the Sierpinski gasket (Mandelbrot 1989), in which segments of a line, or portions of a plane, are simply removed without changing the surrounding values. Their average density, as a function of scale , may be written as with dimension (between a point and a line) and (between a line and a plane) respectively.
In contrast, multifractals result from application of rules (or probability distributions of rules) in which the local measure is changed, while conserving the total measure, by unequal repartitioning of the content of a bin into sub-bins of regularly decreasing spatial scale. For example, it is easily seen that partitioning some quantity into the two halves of a bin with unequal proportions (say 0.7 and 0.3) raises the mean density in the first half and decreases it in the second. Repetition of this rule produces some bins which become ever denser with decreasing scale, and others which become ever less dense - with all combinations in between. The ensuing spatial distribution has no well defined local value in the limit of diminishing bin size; that is, the local values are spatially spiky, “intermittent”, or “singular” (Meneveau and Sreenivasan 1987 present a short and readable discussion of cascade processees and multifractals). The spatial distributions of multifractals are, however, predictable in a statistical sense, using Probability Distribution Functions (PDFs) which are derived directly from their dimensions. For instance, dissipation of turbulent kinetic energy, which occurs on the Kolmogorov spatial scale, is not spatially uniform but has the spatial distribution of a mutifractal (Chhabra et al 1989).
In multifractals, the dimension varies with the value of the measure. In our case, the measure is particle concentration factor , which is the ratio of the local particle volume density to its global average value. The fractional probability of a particle lying in a bin which contains particles out of total particles is defined as , where bin size/domain size. The scaling index can be viewed as a local dimension for . The associated concentration factor , where is the volume of a bin and is the total volume of the domain; thus . Expressing the bin size, or scale, as some multiple of , and the domain size in units of the integral scale as , we find the domain normalized bin size to be , where we have also used the inertial range relationship . Thus, , or
| (9) |
The normalized PDF for is usually written as a fractional volume , where the important function , called the singularity spectrum (Halsey et al 1986, Chhabra et al 1989, Mandelbrot 1989), plays the role of a dimension for . The prefactor function is only weakly dependent on scale, and can be approximated as (Chhabra et al 1989). The function is discussed more in the next subsection.
We define the PDF as the volume fraction occupied by bins having concentration factor within , with . Transforming variables and their PDFs, we get
| (10) |

The fraction of particles occupying bins within is defined as , and both and have cumulative versions , and . For a stationary, ergodic process, one expects that the fraction of particles having at any given time () is identical to the fraction of time spent in regions of concentration by a typical particle, defined as . Below, this is confirmed numerically.
5.1 Numerical results at low :
5.1.1 PDFs for concentration
Using the methodology of Chhabra et al (1989), we have shown that the spatial distribution of optimally concentrated () particles is a multifractal, and that its singularity spectrum is invariant over more than an order of magnitude from to (HCD99, who actually give Taylor microscale Reynolds numbers = 40 to 140). This -invariance for is seen only when binning is done on some fundamental flow-relative scale such as a multiple of the Kolmogorov scale . The function is found by applying weighted binning techniques to the distribution of interest (Chhabra et al 1989, HCD99), and depends on both and - that is, on the number of integral scales sampled as well as on the binning scale. Careful reassessment of different definitions of the integral scale (see Hinze 1975, chapter 2) has led us to values slightly smaller than those published by HCD99, implying that the computational domain appropriate for our is 9 on a side. Our results for relative to this domain are shown in Figure 3 (HCD99). The sets with error bars are “quenched”, or averaged over samples each in extent. The fact that there is no less than one cell in each sample found at maximum concentration results in for these sets. This can be seen by setting the product of either or by the normalized domain volume equal to unity, after allowing for the fact that the are differential functions of their arguments by multiplying them by or respectively.
Information about higher (less probable) concentrations than are typically found in a volume on a side must come from analyzing a large number of realizations of each sample and determining an “annealed” average, where (eg., Chhabra and Sreenivasan 1991). The annealed version (dashed curve in figure 3), also binned by , is well fit by the function , for 2.0. We have restricted ourselves to binning for the present to preserve good statistics; smaller binning scales sample a deeper cascade and will generate large values with higher probability. The three sets of in Figure 3, as binned over 2, 4, and 8 illustrate the multifractal or “singular” nature of the distribution. For any given , smaller values correspond to larger values (equation 9), and larger values of imply larger . The smaller , or larger for seen for the smaller binning scales implies that, averaged over a bin, smaller binning scales retain large far more commonly than larger binning scales. That is, as the scale is reduced, no asymptotic or well-defined limiting local value is reached. Also shown in Figure 3 is the singularity spectrum for dissipation of turbulent kinetic energy (open symbols), which is scale-independent. The agreement between this spectrum and that for particle density binned at the scale is intriguing. The deviation between our spectra (solid symbols and dashed line) and that for dissipation seen toward the right hand side (large ) is due to incomplete sampling of very low particle density regions in our particle density simulations because of memory limitations on the number of particles we can follow. Dissipation, being a continuously varying function, is not subject to this effect. For this reason, was less well defined than , which, by definition as a particle rather than volume fraction is always fully characterized. In any case, our primary interest is in the zones of high concentration (small ).

As a check on the method (subtle normalization issues are discussed in Chhabra et al 1989), an average , obtained from our calculations at all three values was used to calculate at each of our three values, for comparison with the distributions determined directly from numerical results (HCD99). As shown in figure 4, the single does quite well at predicting at all three , even though they all subtended slightly different numbers of integral scales. For any , increases with and thus R. This may be puzzling after only a quick inspection of equation (10), since is always negative (figure 3). However, for a fixed , increases with (equation 9), and thus also increases (figure 3), so the exponent in equation (10) becomes less negative. Since any function is more sensitive to its exponent (here ) than to its base (here ), equation (10) implies and thus increase with .
5.1.2 Particle time histories
The particle time histories are of interest in their own right, and illustrate how particles experience a fluctuating background concentration as they wander through the fluid. Figure 5 illustrates histories for several randomly chosen particles. The particles are moving at roughly constant space velocity (approximately the velocity of the largest eddies, since they are trapped to nearly all eddies), and repeatedly encounter zones of different density with little noticeable effect on their velocity (their stopping time is much longer than the clump transit time ). In these simulations, where no particle interactions are computed, the particles pass through the dense zones and continue their evolution. The dense zones per se persist for times much longer than the passage time of a single particle (CDH96, She et al 1990). The more numerous, lower density zones are encountered more frequently, and the rare, very high density zones less frequently. This time history, essentially a (convoluted) 1D path through the computational volume, has the same “intermittent” or spiky structure as seen for dissipation (see, eg., Meneveau and Sreenivasan 1987; Chhabra et al 1989).


From simulations such as these, we have validated the ergodic assumption that the fraction (spatially averaged over all particles at several snapshots in time) is equal to the fraction of time spent by a given particle in regions denser than (temporally averaged over extended trajectories for a few particles). The comparison is shown in figure 6. A “random walk” calculation does not accurately reflect this behavior; the particles are not moving randomly through the volume and encountering dense zones with probability given by their volume fraction; rather, particle trajectories are “attracted” to the dense zones, or, probably more physically, repelled from the sparse, complementary eddy zones. This behavior is correctly captured using .
5.2 Predictions for nebula :
The properties of multifractals make it much easier for us to predict nebula properties than merely making extrapolations from values we have studied numerically. In the multifractal context, equation (10), and the - independence of , suggest identification of with the level-independent “rule”, and with the number of steps in the cascade. As increases, the inertial range (or number of eddy bifurcations) between and also increases. The cascade model described by Meneveau and Sreenivasan (1987), mentioned at the beginning of this section, is a specific case of the binomial cascade discussed by Mandelbrot (1989); all provide insight as to how higher result from a deeper cascade with more steps. Mathematically, equations (9-10) show how high values become more likely. If is indeed a -independent, universal function for optimally concentrated () particles, we can then predict PDF’s for any (i.e., any given nebula ) using equation (10).
In addition to our own experiments over an order of magnitude in , several other lines of argument support the assumption of a level-independent and -independent “rule”. Dissipation of and particle concentration are physically connected through their mutual preference for the Kolmogorov scale; also, the shapes of the singularity spectra for dissipation, and for particle concentration binned at close to the Kolmogorov scale, are similar (figure 3; HCD99). The singularity spectrum of dissipation has already been connected to the turbulent cascade process (Meneveau and Sreenivasan 1987). Thus, turbulent concentration is probably also closely related to the turbulent cascade process. The turbulent cascade is known to have -independent properties in the inertial range. For instance, the for dissipation has been shown to be -independent - from numerical work at , including our own, through laboratory experiments with , to experimental studies of the atmospheric boundary layer with (Chhabra et al 1989, Hosogawa and Yamamoto 1990). Furthermore, it has been directly demonstrated from analysis of observations of dissipation in large turbulence that the probability distribution of “partition factors” or “multipliers” is independent of level within the inertial range (Sreenivasan and Stolovitsky 1995). Based on these arguments, we believe and presume that the particle concentration singularity spectrum remains -independent in turbulent cascades with far larger values of than those of our numerical experiments. Given this invariance, we can predict nebula conditions more confidently than from extrapolation alone, as was done by CDH96. We obtain PDF’s at which are much larger than directly accessible values by containing the -dependence purely within . As argued at the beginning of this section, the is associated with a certain and , which we interpret as being the and =2 implicit in our (section 5.1.1). The nebula is then only dependent on and easily determined for any turbulent as . Recalling (section 3),
| (11) |
Also shown in figure 4 are predictions of for four values of nebula , using equations (10) and (11). Based on these predictions, particles spend about 1 - 10% of their time in regions with under nebula conditions at different . All curves in figure 4 assume a minimum mass nebula ( g cm2 at 2.5 AU), but mass enhancement by some factor F would play a role similar to (see also section 3).
6 Implications and discussion
6.1 Regions of moderately high density
For concentration factors leading to at least as large as unity, particle mass loading might start to affect the “partition rules” and change the statistics of the cascade. Nevertheless, several interesting effects can result from concentrations less than this possible limit. If the region in question has an average mass density in solids of (at, say, 400∘K; Pollack et al 1994), and some fraction of this amount is in chondrule-sized particles (recalling that other particle sizes are not susceptible to TC), it is clear that as large as , at least several hundred (for ), remains free of mass loading concerns. If , far larger are allowed. The point is that, depending on , can get quite large without violating the mass loading caveat.
While most of the volume of the nebula is characterized by , Figure 4 shows that chondrules in the nebula spend a significant fraction of their time residing in regions where the particle density is enhanced by a factor of . These results might help us understand why some chondrule types seem to have been heated under unusually oxidizing conditions (eg., Rubin et al 1989), which has been attributed to vaporization of a large ambient density of solids - enhanced by several orders of magnitude over solar - as part of the chondrule formation process (note, however, that it is not universally accepted that the chondrule oxidation state information necessarily implies a large background abundance of oxygen; Grossman 1989).
Several chondrule melting processes - shock waves (Hood and Kring 1996, Connolly and Love 1998) or lightning bolts (Desch and Cuzzi 2000, Desch 2000) are envisioned to occur ubiquitously within the region of the nebula in which we propose TC operates to sort the chondrules after their formation. In fact, Desch and Cuzzi (2000) showed that TC itself is an enabling factor in generation of nebula lightning. They found that the optimal conditions for energetic lightning bolts are found in 1000-km regions with - especially if the nebula were denser than “minimum mass” - . Either lightning or shock waves - heating dense zones where the background density of solids is large (cf. Hood and Horanyi 1993, Hood and Kring 1996, Connolly and Love 1998) - could elevate the local Oxygen abundance by evaporating some part of the solids. However, TC does not concentrate “fine dust” - only chondrule-sized particles - so significant local volatilization of some chondrules, or the surfaces thereof, would be implied. Whether this is consistent with mineralogical signatures which are seen in the survivors would be useful to address in the future.
6.2 Encounters with very dense regions
The scenario of CDH96 suggested in a qualitative way that TC could lead to stable, if low-density, clusters or clumps of chondrules as direct precursors of planetesimals. We delineate the logic of this argument, using the PDF’s derived in section 5, and then discuss the difficulties with the original scenario.
The PDF’s can be combined with the particle velocity through space to calculate the “encounter time” of a chondrule with a region of arbitrary , using a duty cycle argument. The fraction of time spent by a typical chondrule-size particle in clumps with concentration greater than , , where is the time spent traversing a bin with concentration greater than (section 5.1.2). Thus, for bins of dimension and particle velocity , , so , and the encounter rate is . We have verified numerically that, as expected for particles with stopping times much shorter than the overturn time of the largest eddies , is nearly identical to the typical turbulent gas velocity (Völk et al 1980, Markievicz et al 1991).
We may calculate the encounter rate (and time) with a cloud so dense that a particle becomes entrapped with its neighbors and possibly removed from further free circulation. Normally, as seen in figure 5, particles traverse dense regions without incident, because their gas drag stopping time is longer than their transit time (CDH96). An entrapment threshold occurs if interparticle collisions can prevent particles from passing through a cloud; this implies a critical cloud optical depth of unity, defining a critical . For small, dense -sized clumps, , where is the average (unconcentrated) chondrule mass density, at 400K is the fractional mass in solids, is the fraction of solids in chondrules, and and are chondrule mass and radius. Then
| (12) |
In the final expression above, we have substituted the first expression of equation (8) for the product , since the value of this product for optimally concentrated particles is constrained by nebula conditions (section 3). We substituted the general expression for ( 0.5km ), and assumed other nominal parameters at 2.5 AU ( g cm-2, cm/sec).
For nominal, minimum mass nebula parameters, assuming , and using the PDF’s we have in hand (binned at scales), we find that varies between years for to years for . The encounter times are sensitive to nebula parameters adopted and would decrease for smaller binning (eg., by ), or enhanced nebula densities (). This quantifies the length of time chondrules spend freely wandering before encountering a region in which they are certain to undergo collisions. We suggested earlier that such an encounter at removes the chondrule from further circulation by entrapping it with others in the dense cluster. Alternately, such dense zones might merely provide a large increase in the collisional aggregation rate of optimally sized particles. In fact, if chondrules or groups of chondrules undergo collisional aggregation at low relative velocities (and particles of comparable size always have low relative velocities in turbulence; Weidenschilling and Cuzzi 1993), they may form fractal aggregates with mass proportional to radius squared (Weidenschilling and Cuzzi 1993, Beckwith et al 2000). The average density of such aggregates is inversely proportional to their bounding “radius”, so they retain the same stopping time as their individual components (individual chondrules), and can continue to participate in TC.
However, before this line of thought can be pursued much further, mass loading (discussed in the next section) must be assessed. Depending on their linear extent, the optically thick clouds described above can reach a mass density orders of magnitude larger than that of the gas, which would probably invalidate our assumption of no feedback. In general, for a clump of mass density composed of chondrules of radius and density ,
| (13) |
In deriving equation (13) we have expressed the linear size of a cluster as . For km and g cm-3, the particle density exceeds for clusters smaller than km - about for in the normal range for chondrules (figure 1).
6.3 Limitations due to high mass loading:
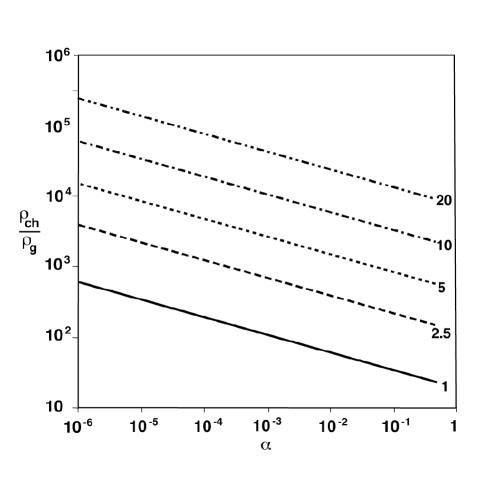
The cascade process model is only valid as long as no new physics emerges at some step in the cascade to change the partition factors, as represented globally by , applicable to subsequent steps in the cascade. However, application of the expressions above for optically thick clusters of scale implies . While these high concentrations literally relate to regions comparable to in size, where there is no turbulence to damp, the cascade that is needed to produce such a cluster must have extended to larger sizes in the surrounding “penumbra” where the particle density, while lower, might still be large enough to damp turbulent motions. We have made some preliminary calculations of from low- numerical simulations having mass loading . Even here, turbulent concentration persists (to ), but the is altered in the sense that high values have a lower probability. For comparison, unloaded simulations at this result in . The magnitude of the mass loading effect is approximately equal and opposite to that of decreasing the bin size from to . Clearly, this effect must be better quantified before more specific predictions of and chondrule accumulation timescales can be made. Even for small , the mass loading regime of questionable validity is not a large one (note that equation (13) above showed that regions of size , or 100-300 km, are probably within the range of validity); however, it is certainly an interesting one. If we further restrict our attention to optimally concentrated particles by combining equations (7 or 8) and (13), we obtain
| (14) |
which shows that regions which are denser and/or have more intense turbulence (higher ), such as may have characterized the very early evolutionary stages of the nebula, are less prone to mass loading difficulties. That is, they provide at lower . Figure 7 shows that conditions at 1AU (gas density g cm-3), with , provide with . Full treatment of a wider parameter space, allowance for mass loading and other binning scales , and connection to hypotheses for chondrule formation (Desch and Cuzzi 2000) and dust rimming (Cuzzi et al 1999, Morfill and Durisen 1998) which are tied to TC, will be treated in subsequent publications.
7 Discussion:
Turbulent concentration promises to provide another tool for our planetesimal construction toolkit. Nominal nebula conditions, including weak turbulence, lead to concentration factors large enough to concentrate chondrule-sized particles to densities greatly exceeding the nominal nebula average. The presence of such dense regions might help us understand some aspects of chondrule formation. Generalization of the physics shows that fluffy aggregates would also be subject to turbulent concentration, but in nebula regions where the gas density is lower and/or the turbulent intensity higher than expected for the terrestrial planet region. If TC is a key aspect of the primary accretion of planetesimals, any chondrules formed or transported to low density, outer solar system regimes might only have escaped incorporation into planetesimals to a greater degree than in the terrestrial planet region. The size distributions produced by turbulent concentration are in very good agreement with those found in primitive chondrites; however, the fact that most primitive meteorites contain ample evidence for abrasion, fragmentation, and other mechanical processes which may well have continued long after the nebula gas vanished and aerodynamic processes became irrelevant, warns us that we should not expect any single process to explain all properties of even “primitive” meteorites.
The spatial distributions of concentrated chondrules under nebula conditions can be predicted using the multifractal properties of turbulent concentration. Various timescales of interest can then be estimated, including the timescale in which a chondrule encounters a cluster so dense that it is entrapped. However, preliminary estimates of timescales for simple accumulation by entrapment in unusually dense clusters are comfortably shorter than nebula lifetimes only for higher values than those which best explain chondrule size-density products.
Mass loading is expected to change the nature of the process at some point in the cascade where the concentrated particle density becomes comparable to, or greater than, that of the gas. Depending on the mass fraction in solid “chondrules”, this might imply concentration factors as small as - or possibly far larger. Mass loading has not yet been quantitatively treated, but it seems it will inevitably increase the encounter timescales by decreasing the abundance of very dense clusters. Perhaps turbulent concentration only augments collisional accumulation for optimally sized particles.
The evolution of dense clusters in the presence of mass loading and the vertical component of solar gravity deserves study (eg. Wang and Maxey 1993). Do clusters retain their identity or disperse? Would they be compacted or dispersed by settling, by collisions with other dense clusters en route to, or within the midplane, or by shock waves in the nebula? Perhaps only clusters formed near the midplane avoid the dispersion due to settling.
Acknowledgements: This research was jointly supported by NASA’s Planetary Geology and Geophysics Program and Origins of Solar Systems Program. We thank John Eaton, Kyle Squires, Pat Cassen, Steve Desch, Peter Goldreich, and K. R. Sreenivasan for helpful conversations. We also thank numerous meteoriticist colleagues for their interest and their patient tutorials - especially Ted Bunch, William Skinner, John Wasson, Harold Connolly, Alan Rubin, and Dotty Woolum. The extensive computations on which much of this research is based were made possible by the capabilities of the National Aerodynamical Simulator (NAS) Program at Ames Research Center; we thank Eugene Tu for extra discretionary time. We thank the Antarctic Meteorite Working Group for making samples of ALH 85033 and other meteorites available. This research has made use of NASA’s Astrophysics Data System Abstract Service.
Bibliography
Balbus, S. A. and J. F. Hawley (1991) Ap. J. 376, 214-233.
Balbus, S. A. and J. F. Hawley (1998) Revs. Mod. Phys., 70, 1
Balbus, S. A., J. F. Hawley, and J. M. Stone (1996) Ap. J. 467, 76-86
Barge, P. and J. Sommeria (1995) Astron. Astrophys. 295, L1-L4
Bell, K. R., P. Cassen, H. Klahr, and Th. Henning (1997); Ap. J. 486, 372-387
Boss, A. (1996) in “Chondrules and the Protoplanetary Disk”, edited by R. H. Hewins, R. H. Jones, and E. R. D. Scott, Cambridge University Press, Cambridge
Bracco, A., P. H. Chavanis, A. Provenzale, and E. A. Spiegel (1999) Phys. Fluids, in press
Cabot, W., V. Canuto, and J. B. Pollack (1987) Icarus 69, 387-422
Cameron, A. G. W. (1978); Moon and Planets 18, 5
Chhabra and Sreenivasan (1991) Phys. Rev. A. 43, 1114-1117
Chhabra, A. B., Meneveau. C., Jensen, V. R. and Sreenivasan K. R. (1989), Physical Review A 40, 5284-5294
Chokshi, A., A. G. G. M. Tielens, and D. Hollenbach (1993) Ap. J. 407, 806-819
Connolly, H. C. and S. Love (1998) Science 280, 62-67
Cuzzi, J. N., A. R. Dobrovolskis, and J. M. Champney (1993) Icarus, 106, 102-134
Cuzzi, J. N., A. R. Dobrovolskis, and R. C. Hogan (1996) in “Chondrules and the Protoplanetary Disk”, edited by R. H. Hewins, R. H. Jones, and E. R. D. Scott, Cambridge University Press, Cambridge; (CDH96)
Cuzzi, J. N. et al (1998) 29th LPSC Abstracts, on CD-ROM (Lunar and Planetary Institute).
Cuzzi, J. N., R. C. Hogan, and J. M. Paque (1999) 30th LPSC Abstracts, on CD-ROM (Lunar and Planetary Institute).
Desch, S. J. (2000) Submitted to Ap. J.
Desch, S. J. and J. N. Cuzzi (2000) Icarus, in press (Protostars and Planets IV special issue)
Dodd, R.T. (1976) E. P. S. L. 30, 281-291
Dominik, C. and A. G. G. M. Tielens (1997)
Dubrulle, B. (1993), Icarus 106, 59-76
Dubrulle, B., M. Sterzik, and G. E. Morfill (1995) Icarus, 114, 237-246
Eaton, J. K. and J. R. Fessler, (1994) Int. J. Multiphase Flow 20, Suppl., 169-209.
Eisenhour, D. (1996) Meteoritics, 31, 243-248
Fessler, J. R., J. D. Kulick, and J. K. Eaton (1994) Phys. Fluids 6, 3742-3749
Frisch, U. and Parisi, G. (1985) in “Turbulence and predictability in Geophysical Fluid Dynamics and Climate dynamics”, M. Ghil, ed. (N. Holland-Amsterdam)
Gammie, C. (1996) Astrophys. J. 457, 355
Goldman, I. and A. Wandel (1994) Astrophys. J. 443, 187-198
Grossman, J., A. E. Rubin, H. Nagahara, and E. A. King (1989) in “Meteorites and the Early Solar System”, 619-659, J. Kerridge, ed; Univ. of Arizona Press
Grossman, J. (1989) in “Meteorites and the Early Solar System”, 619-659, J. Kerridge, ed; Univ. of Arizona Press
Halsey, T. C., M. H. Jensen, L. P. Kadanoff, I. Procaccia, and B. I. Shraiman (1986); Phys. Rev. A. 33, 1141-1151
Hartmann, L., N. Calvet, E. Gullbring, and P. D’Alessio (1998); Accretion and the evolution of T Tauri disks. Astrophys. J. 495, 385-400
Hayashi, C. (1981) Prog. Theor. Phys. Suppl. 70, 35-53
Hewins, R. (1997) Ann. Revs. Earth and Planetary Sci., p 61
Hewins, R., R. H. Jones, and E. R. D. Scott (1996) “Chondrules and the Protoplanetary Disk”, Cambridge University Press, Cambridge
Hinze, J. O. (1975) Turbulence, 2nd Ed. McGraw-Hill, New York, Chapter 3
Hogan, R. C., and J. N. Cuzzi (2000) in preparation
Hogan, R. C., Cuzzi, J. N., and Dobrovolskis, A. R. (1999) Phys Rev E, 60, 1674-1680 (HCD99)
Hood, L. and D. Kring (1996) in “Chondrules and the Protoplanetary Disk”, edited by R. H. Hewins, R. H. Jones, and E. R. D. Scott, Cambridge University Press, Cambridge
Hood, L. and M. Horanyi (1993) Icarus, 106, 179-189
Hosogawa, I. and K. Yamamoto (1990) Phys. Fluids A, 2, 889-892
Hughes, D. W. (1978) EPSL, 38, 391-400
Brearley, A. J. and R. H. Jones (1999) in “Planetary Materials”, Revs. in Mineralogy, 36, Ch. 3
Jones, R. et al (2000) in “Protostars and Planets IV”, V. Mannings, A. Boss, and S. Russell, eds; Univ. of Arizona Press, in press.
Kato and Yoshizawa (1997) Pub. Ast. Soc. Jap. 49, 213-220
Kennard, E. H. (1938) Kinetic theory of gases; McGraw-Hill, New York (1938)
Keubler, K., H. McSween, W. D. Carlson, and D. Hirsch (1999) Icarus, 141, 96-106
Klahr, H. (2000a) in Proceedings of the meeting “Two decades of numerical astrophysics”; in press
Klahr, H. (2000b) in Proceedings of the meeting “Disks, planetesimals and planets”, Tenerife
Klahr, H. and Th. Henning (1997) Icarus, 128, 213-229
Lin, D. N. C. and J. Papaloizou (1985) in “Protostars and Planets II”; D. C. Black and M. S. Matthews, eds, Univ. of Arizona Press
Lynden-Bell D. and J. E. Pringle (1974) MNRAS 168, 603-637
MacPherson, G. J., D. A. Wark, and J. T. Armstrong (1989) in “Meteorites and the Early Solar System”, 746-807, J. Kerridge, ed; Univ. of Arizona Press
MacPherson, G. J., A. M. Davis, and E. K. Zinner (1995) Meteoritics, 24, 297
Mandelbrot, B. (1989) Pure and Appl. Geophys, 131, 5-42
Markievicz, W. J., H. Mizuno, and H. J. Völk (1991) Astron. Astrophys. 242, 286-289
Maxey, M. R. (1987) J. Fluid Mech. 174, 441-465
Meneveau, C. and Sreenivasan, K. R. (1987) Phys. Rev. Lett. 59, 1424-1427
Meneveau, C. and Sreenivasan, K. R. (1991) J. Fluid Mech. 224, 429-484
Metzler, K., A. Bischoff, and D. Stöffler (1992) Geochim. Cosmochim. Acta 56, 2873-2897
Morfill, G. E. and R. H. Durisen (1998) Icarus 134, 180-184
Paque, J. and J. N. Cuzzi (1997) 28th LPSC Abstracts
Paque, J. and J. N. Cuzzi (2000) in preparation
Pollack, J. B, D. Hollenbach, S. Beckwith, D. Simonelli, T. Roush, and W. Fong (1994) Astrophys. J. 421, 615-639
Prinn, R. J. (1990) Ap. J. 348, 725-729
Richard, D. and J.-P. Zahn (1999) Astron. Astrophys. 347, 734-738
Rubin, A. E., B. C. Fegley, and R. Brett (1989) in “Meteorites and the Early Solar System”, J. Kerridge and M. S. Matthews, eds; Univ. of Arizona Press; p. 488-511
Rubin, A. and J. Grossman (1987) Meteoritics 22, 237-251
Shakura, N. I. and R. A. Sunyaev (1973) Astron. Astrophys. 24, 337-355
She, Z.-S., E. Jackson, and S. A. Orszag (1990) Nature, 344, 226
Skinner W. R. and J. M. Leenhouts (1991) 24th L.P.S.C. Abstracts, 1315-1316
Squires, K. and J. K. Eaton (1990) Phys. Fluids A2, 1191-1203
Squires, K. and J. K. Eaton (1991) Phys. Fluids A3, 1169-1178
Sreenivasan, K. R. G. Stolovitsky (1995) J. Stat. Physics 78, 311-333
Stone, J. M. and S. A. Balbus (1996) Ap. J. 464, 364-372
Supulver, K. and D. N. C. Lin (1999) Icarus, submitted
Tanga, P., A. Babiano, B. Dubrulle, and A. Provenzale (1996) Icarus 121, 158-170
Tennekes, H., and Lumley, J. L. (1972) A First Course in Turbulence, MIT Press, Cambridge Mass.
Völk, H. J., F. C. Jones, G. E. Morfill, and S. Röser (1980) Astron. Astrophys. 85, 316-325
Wang, L. and M. R. Maxey (1993) J. Flu. Mech. 256, 27-68
Wasson, J. A. (1996) in “Chondrules and the Protoplanetary Disk”, edited by R. H. Hewins, R. H. Jones, and E. R. D. Scott, Cambridge University Press, Cambridge
Weidenschilling, S. J. (1977) Mon. Not. Roy. Ast. Soc. 180, 57-70
Weidenschilling, S. J. and J. N. Cuzzi (1993) in “Protostars and Planets III”, E. Levy and J. Lunine, eds, Univ. of Az. Press
Wood, J. A. (1998) Astrophys. J. 503, L101-L104