study of an overdensity of X-ray sources around two distant (z0.5) clusters
Abstract
We present results from a X-ray Observatory study of the field X-ray source populations in 4 different observations: two high-redshift (z0.5) clusters of galaxies 3C295 and RXJ003033.2+261819; and two non-cluster fields with similar exposure time. Surprisingly, the 0.5-2 keV source surface densities ( 900-1200 sources deg-2 at a flux limit of 1.5 10-15 erg cm-2s-1) measured in an 8′8′ area surrounding each cluster exceed by a factor of 2 the value expected on the basis of the ROSAT and Chandra logN-logS, with a significance of each, or 3.5 when the 2 fields are combined (i.e. a probability to be a statistical fluctuation of 1% and 0.04%, respectively). The same analysis performed on the non-cluster fields and on the outer chips of the cluster fields does show evidence of such an excess. In both cluster fields, the summed 0.5-10 keV spectrum of the detected objects is well fitted by a power-law with 1.7 similar to AGNs and shows no sign of intrinsic absorption. The few ( 10 out of 35) optical identifications available to date confirm that most of them are, as expected, AGNs but the number of redshifts available is too small to allow conclusions on their nature. We discuss possible interpretations of the overdensity in terms of: a statistical variation of Cosmic Background sources; a concentration of AGNs and/or powerful starburst galaxies associated with the clusters; and gravitational lensing of background QSO’s by the galaxy clusters. All explanations are however difficult to reconcile with the large number of excess sources detected. Deeper X-ray observations and more redshifts measurements are clearly required to settle the issue.
Subject Headings: galaxies: active:clustering:general - X-rays:general
1 Harvard-Smithsonian Center for Astrophysics, 60 Garden St., Cambridge, MA 02138, USA
2 Istituto TeSRE-CNR, Via Gobetti 101, 40131, Bologna, Italy
3 Institute for Astronomy, University of Hawaii, 2680 Woodlawn Drive, Honolulu, HI 96822
4 Osservatorio Astronomico di Bologna, Via Ranzani 1, 40127, Bologna, Italy
5 Osservatorio Astronomico di Roma, Via dell’Osservatorio, I-00044 MontePorzio Catone, Italy
6 SRON, Sorbonnelaan 2, NL-3584 CA Utrecht, The Netherlands
7 School of Physics & Astronomy, University of Birmingham, Birmingham B15 2TT, UK
1. Introduction
Since its launch date on July 23rd, 1999 the X-ray Observatory has performed a number of pointed observations aimed at verifying the satellite functioning and at calibrating the instrument responses. This paper reports the analysis of serendipitous sources detected in three of these observations.
Among the most remarkable characteristics of are its unprecedented sensitivity and spatial resolution (1 arsec) over the entire 0.1-10 keV band (Van Speybroeck, et al. 1997), a factor of 10 better than any previous X-ray mission. This provides an order-of-magnitude advance in detecting faint point sources ( 10–100 times fainter than ROSAT and ASCA at a given exposure time) because of the 100 times reduced background per beam element. On the basis of the ROSAT measurements (Hasinger et al. 1998), at a 0.5-2 keV flux limit of 310-15 erg cm-2 s-1, the source density in observations is expected to be 34030 deg-2, giving 6 sources per chip. This opens new possibilities for detecting many serendipitous X-ray sources even in observations with modest ( few tens ks) exposures. This will lead to the collection of sufficiently large samples to enable detailed study of the logN - logS, the X-ray background, and potentially the spatial distribution of sources to map large-scale structure.
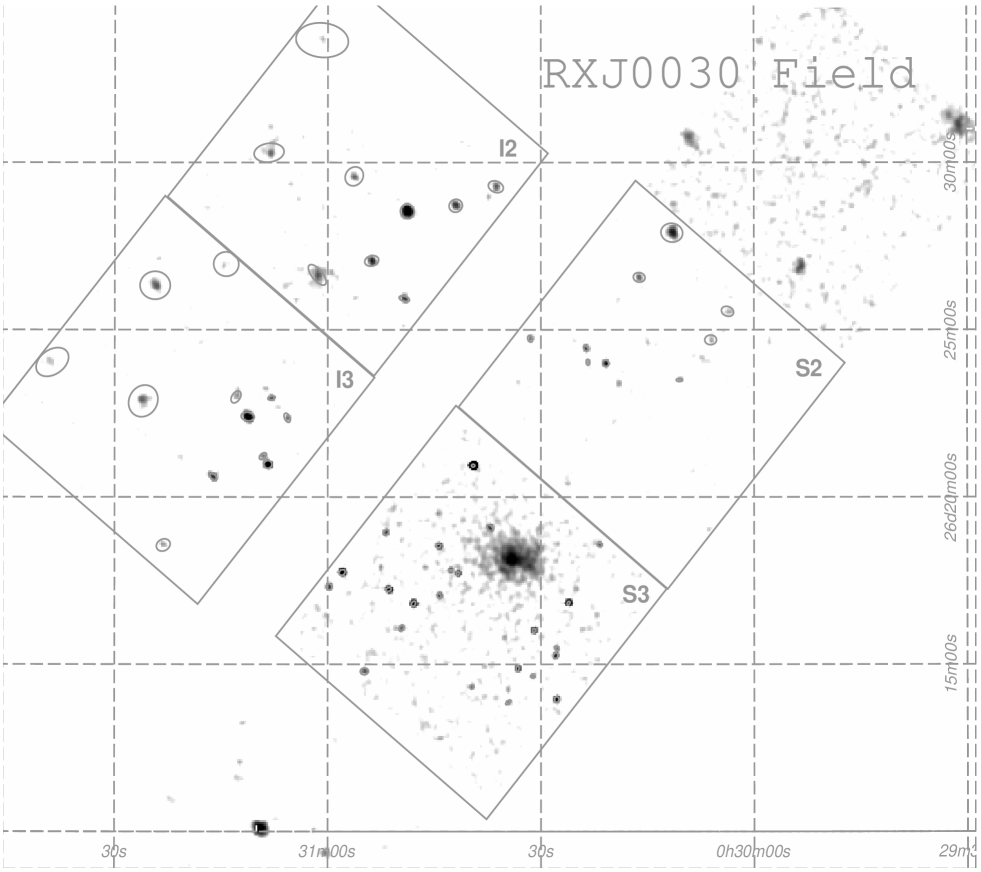
In this paper, we report on the serendipitous sources in Chandra observations of two medium-z clusters RXJ003033.2+261819 (z=0.5, Vikhlinin et al. 1998, “RXJ0030” hereinafter) and 3C295 (z=0.46, Dressler & Gunn 1992) which suggest an excess number of serendipitous X-ray sources compared to a non-cluster field and to the predictions based on the ROSAT and Chandra (0.5-2 keV) logN-logS measurements. The clusters have 0.5-10 keV luminosities of 1044 and 1045 erg s-1 and temperatures of 4 and 4.4 keV, respectively (Forman et al. 2000, in preparation, Harris et al. 2000). We first show (§4.1) the source densities obtained from the on-axis chips of the RXJ0030 and 3C295 fields of view (FOVs), and compare them to densities in the outer chips and to two comparison fields (§4.2 and 4.3): one obtained when pointed away from the radiant of the 1999 Leonid meteor shower (hereafter anti-Leonid) and one obtained from a calibration observation of 3C273. The average X-ray spectral properties and available optical identifications of these sources are given in §5. Possible interpretations of these results are discussed in §6 and conclusions are reported in §7. km s-1 Mpc-1 and are used throughout.
2. Observations and Data Reductions
The Chandra X-ray Observatory (Weisskopf, O’dell & van Speybroeck, 1996) consists of four pairs of concentric Wolter I mirrors reflecting 0.1-10 keV X-rays (VanSpeybroeck, et al. 1997) into one of the four focal plane detectors (ACIS-I/S or HRC-I/S). All the data presented in the following were taken from the public archive (Fabbiano et al. 2000, in preparation, see also http://asc.harvard.edu/cda/). The observations of RXJ0030 and 3C295 were performed with the ACIS-S, with the clusters lying within a few arcsecs of the optical axis location on the back-illuminated (BI) S3 chip. Chips S1-S4, I2 and I3 constitute the entire activated field of view. The anti-Leonid observation was performed with the ACIS-I configuration (i.e. with the focus nearly at the center of four front-illuminated (FI) CCDs, see the “Chandra Proposer’s Observatory Guide” 1999). The observation of 3C273 was performed with a ACIS-S(1-6) configuration. These two observations were chosen from the public archival data as the best available comparison fields because of their long exposures and high Galactic latitudes.
Details of the cleaning and reduction of the data are given in Appendix I. In total, we obtained “good” 0.1-10 keV data from 4 chips for each FOV, each chip having dimensions of 8. A log of the observations is given in Table 1.
3. Analysis: The Source Detections, Counts and Fluxes
3.1. The Source Detections
To localize the serendipitous source candidates in the fields, we applied a source detection algorithm in the Interactive Analysis of Observations (CIAO, Elvis et al. 2000, in preparation) software: (Freeman et al. 2000, Dobrzycki et al. 1999). Source detection is easy with because the background is very uniform and low, even in the vicinity of the clusters, and one can therefore “see” the sources unambiguously. With the conservative threshold applied here (see Appendix II), all sources are indeed visible by eye. Details of the algorithm and the procedure applied for the detections are given in Appendix II.
In the 0.5-2 keV energy band, a total of 53 and 44 point sources/4-chip FOV (clusters excluded) are found in the RXJ0030 and 3C295 fields, respectively. All detected sources were consistent with point sources. More sources are expected in the RXJ0030 field because we have about 50% more usable exposure time. In the hard 2-10 keV energy band, these numbers are reduced to 13 and 5, respectively. If we restrict ourselves to the central S3 chip (where systematic effects are expected to be smaller), we find 23 and 17 sources between 0.5-2 keV, and 6 and 4 sources between 2-10 keV, respectively. These sources are listed in Tables A.1 and A.2. For comparison, we also list the sources detected in the whole 4 chips of the anti-Leonid field and in the ACIS-S3 chip of the 3C273 field (Tables A.3 and A.4).
Figure 1 shows an overlay of the detected sources with the X-ray images between 0.5-2 keV, where the images have been smoothed using a gaussian function with = 1 pixel = 2”. All the detected sources are clearly visible in the images.
3.2. The Source Counts and Fluxes
Source count rates were obtained using the algorithm from regions with typical radii of 3” (on-axis) and 10” (off-axis). The measured counts were first corrected for vignetting and then converted to an emitted, unabsorbed flux. A description of this procedure is given in Appendix III.
Tables A.1 and A.2 report the 0.5-2 keV and 2-10 keV measured fluxes for the detected sources (column 6) and, for sources with known redshifts, the corresponding luminosities. The total 0.5-2 keV flux of the point sources in RXJ0030 (most of which are within a 5 arcmin radius) is 2.2 10-13 ergs cm-2 s-1, 1.6 times larger than the cluster flux over the same energy band. About half of this flux is in the z=0.492 CRSS QSO (source 1 in Table A.1). In 3C295, the point sources sum to 1.6 10-13 erg cm-2 s-1, about one third of the cluster flux.
4. Densities of the Serendipitous Sources
4.1. In the Central Chips (S3)
Here we focus on the results obtained from the central chip (S3) of the RXJ0030 and 3C295 fields, which contain the clusters themselves, and compare them to the ROSAT, ASCA and Chandra logN-logS.
The faintest source in the RXJ0030 field has a flux of 1.310-15 erg cm-2 s-1 (0.5-2 keV) and 10-14 erg cm-2 s-1 (2-10 keV). For 3C295, the faintest has 1.3 10-15 erg cm-2 s-1 and 3.3 10-14 erg cm-2 s-1 between 0.5-2 and 2-10 keV, respectively. All the sources detected at 2-10 keV were also detected in the 0.5-2 keV band.
We find that the minimum number of photon counts of the detected sources increases only very weakly as the off-axis distance increases. This is especially true if one considers only the central chip S3 (where the off-axis distance is confined to 7 arcmin).
At a flux limit of 1.5 10-15 erg cm-2 s-1, a source gives 15 and 10 net counts per detected source in RXJ0030 and 3C295, compared with a background of 3 and 1 counts per source extraction area, respectively. Hence most of the sources should have been detected regardless of position in the FOV. Given the negligible background most of the sources have a signal-to-noise ratio higher than 4 at this flux limit, and we therefore avoid complications due to “Eddington bias”, as shown by Schmitt & Maccacaro (1986).
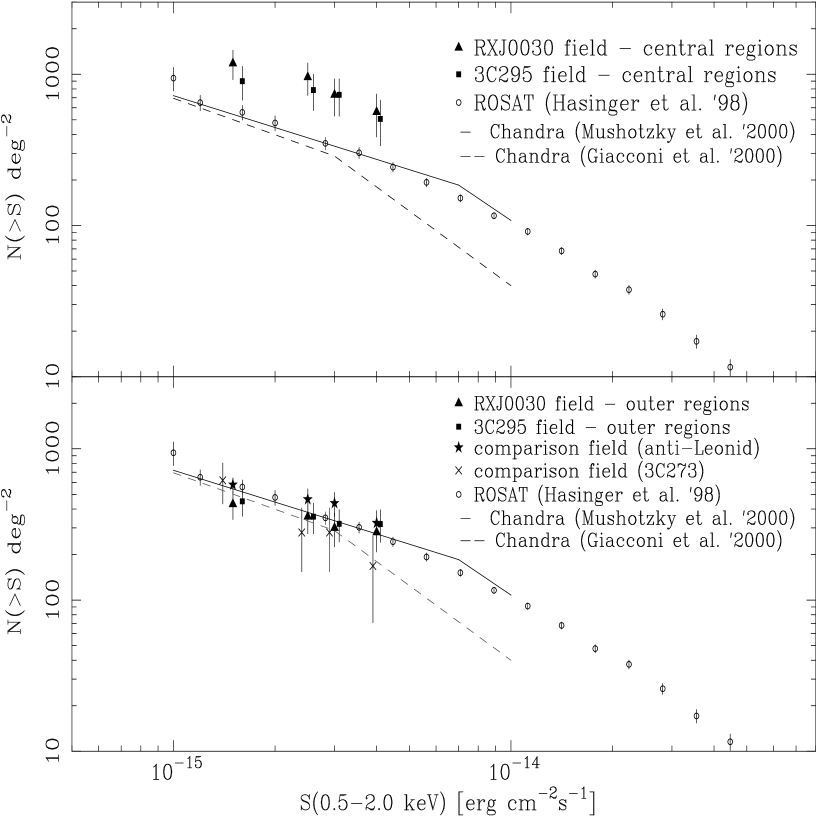
The main results of the present study are given in Table 2 and are shown in Figures 2 and 3. The table reports the source densities per deg2 measured in the central chip (S3) of RXJ0030 and 3C295 for two different flux limits (1.5 and 3 10-15 erg cm-2 s-1) for the 0.5-2 keV detections and for 2 10-14 erg cm-2 s-1 for the 2-10 keV detections. For comparison, we also report in the same table the logN-logS obtained from the ROSAT Lockman Hole deep-field (Hasinger et al. 1998), two recent deep-fields (Mushotzky et al. 2000; Giacconi et al. 2000) and from the two comparison fields. The logN-logS curves (upper panel of Figure 2) show the Table 2 numbers plus those obtained at fluxes of 2.5 and 4 10-15 erg cm-2 s-1. We used the geometric area of 1 chip (64 arcmin2) for RXJ0030, 3C295 and 3C273, and 4 chips (256 arcmin2) for the anti-Leonid field. These are upper-limits on the real area given the uncertainties in instrumental effects (see Appendix II).
It is clear from Table 2a and Figure 2 that the present 0.5-2 keV results strongly suggest an excess number of serendipitous sources in the RXJ0030 and 3C295 fields when compared to ROSAT and Chandra deep-field counts. Assuming the ROSAT value as the true mean source density, the probability of finding a number of sources equal or greater than that observed in RXJ0030 is 1% and 0.4% for fluxes of 3 and 1.510-15 erg cm-2 s-1, respectively. For 3C295, the probabilities are 1% and 8% for the same fluxes.
If the allowed 1 upper envelope on the ROSAT measurements are used instead, the probabilities are about two times higher. At a higher flux limit of 2.510-15 erg cm-2 s-1, the probability is even lower for RXJ0030. Based on measurements of the angular correlation function of X-ray sources derived from a ROSAT PSPC survey by Vikhlinin & Forman (1995), we estimate that the rms fluctuations of the X-ray source density are on average 20-35%. Hence, even if cosmic variance is taken into account (see §6.1.1), the probabilities remain similar. In summary, the excess is significant at the 2 level in both cases, even when the uncertainties in the ROSAT estimates are considered. If the two fields are combined, then the probabilities at 1.5 and 310-15 erg cm-2 s-1 become 0.1% and 0.04%, i.e. a significance of 3 and 3.5 which is larger at higher than lower fluxes.
In the hard energy band, although we reach a factor 2-3 deeper (210-14 erg cm-2 s-1) than the ASCA and BeppoSAX logN-logS (Giommi, Perri & Fiore 2000), the statistics are poorer and the source counts from the four fields are consistent with the Comastri et al. (1999) model for the XRB, the ASCA fluctuations, and the deep-field observations (see Figure 3).
Recently, Brandt et al. (2000) identified some of the 2-8 keV sources in the RXJ0030 field (see also §5.2). They detect 9 sources in the central chip. Five out of 6 of our sources are coincident with their detections and the remaining 4 are below our conservatively chosen threshold. Brandt et al. do not detect our source 2 in Table A.1 because they exclude the chip border. At our hard band flux limit of 210-14 erg cm-2 s-1, their derived source density is consistent with the one presented here.
4.2. In the Outer Chips, and in the anti-Leonid and 3C273 Comparison Fields
Following the procedure explained in §3, we have calculated the 0.5-2 keV logN-logS distribution of the sources detected in the 3 “external” chips of RXJ0030 and 3C295 (2 ACIS-I + 1 ACIS-S chip), in the full anti-Leonid FOV (4 ACIS-I chips) and in the S3 chip of the 3C273 field. These are shown in the lower panel of Figure 2. The results for the anti-Leonid field, the 3C273 field and the source density in the outer regions of the cluster fields are fully consistent with the ROSAT and Chandra logN-logS (note that the Mushotzky et al. results were obtained from an observation performed with the S3 chip, like the present cluster fields). These agreements are important because they demonstrate that the excess of sources measured in the central S3 chips of RXJ0030 and 3C295 (§4.1) are not due to an instrumental effect.
The possibility that the “surplus” sources are caused by some statistical fluctuations due to the enhanced background near the clusters haloes can be rejected. We find no trend for a higher background (computed locally) around the sources nearer to the clusters (see Tables A.1 and A.2) and a similar effect would be expected in the 3C273 field (compare Fig. 1a,b with Fig. 1d), which is not observed.
4.3. Spatial Distribution
We computed the density of the sources as a function of off-axis distance for all fields. For the two cluster fields, this clearly corresponds to the (angular) distance from the cluster centers since they are almost coincident with the optical axis. In this case, we made a conservative choice for the flux limit of 2.510-15 erg cm-2 s-1 between 0.5-2 keV. We used this value instead of 1.5 or 310-15 erg cm-2 s-1 given in Table 2 because we made a trade-off between limiting as much as possible systematic effects at off-axis distance (see §3) and having the largest number of sources. Starting from the center, bins were constructed by adding 100” to its radius until there were 9 sources in each bin. The number of sources/bin were then divided by the area covered by the annuli and the resulting source densities plotted as a function of off-axis distance (Figure 4). At this flux limit, only 5 sources were detected in the 3C273 S3 chip, resulting in a single bin being plotted in Figure 4. This figure suggests, again, that the source densities are higher by a factor 2 near the cluster centers than in the outer regions, while there is no radial dependence in the anti-Leonid comparison field. Moreover, at off-axis distances larger than 200 arcsec (corresponding to 1.4 Mpc at z=0.5 for km s-1 Mpc-1 and ), the source density in all fields is consistent with the ROSAT (Hasinger et al. 1998) and Chandra (Mushotzky et al. 2000; Giacconi et al. 2000) logN-logS.
5. Properties of the Serendipitous Sources
5.1. Summed X-ray Spectra
Here we present the results obtained from the spectral analysis of the co-added spectrum from all the S3 sources in the RXJ0030 and 3C295 central fields (i.e. the average spectra of sources listed in Tables A.1 and A.2). We also present the summed spectrum of all serendipitous sources in the two comparison fields. For both fields, data obtained from the brightest of the sources (the first source in Tables A.1-4) have been excluded from the summed spectra.
A single spectrum has been constructed that includes the sum of all counts extracted from elliptical regions (chosen to match the spatially varying PSF) centered on the detected sources, with minor and major axis typically between about 3 and 7 arsec, chosen to ensure inclusion of more than 90% of the PSF encircled energy, at all energies and off-axis distances. Pulse invariant (PI) response matrices released in October 1999 were used. We used only the data between 0.5-10 keV, where the matrices are best calibrated. The charge transfer inefficiency problems of the FI CCD (for the anti-Leonid field only) are not corrected for; changes can be expected once more calibrations become available. The spectra were fitted using the Sherpa fitting and modeling application included in CIAO. We applied statistics with the Gehrels (1986) approximation of errors in the low counts regime.
A somewhat critical point of this analysis is that spectral deviations due to energy-dependent vignetting could artificially steepen our averaged spectrum since, as discussed in Appendix II, the vignetting is larger at higher energies. In the cluster fields (of which only the central chips were considered for the spectral analysis) and in the 3C273 field, the vignetting should not significantly affect our results since most of the effective area (and therefore counts) is at E4 keV where the vignetting is negligible within 5′. Indeed the spectra constructed from only the off-axis sources (at 5′ off-axis) are consistent with that of the on-axis sources. In the case of the anti-Leonid field, we have limited the spectral analysis to the 24 sources detected within an off-axis distance 7′ for comparison with the other fields.
Background contributes a significant fraction (50%) of the counts at E 4 keV. We extracted background from several (more than 3) large circles of radii 70 arcsec, chosen randomly in regions with no detected point sources and co-added their spectra. We also considered a background chosen from annular regions around each source regions, and again added all the counts into a single spectrum. We found that the two background choices gave best-fit parameters consistent with each other to within 10%. Hereafter, we report the results obtained with the background determined from the large circles since this has better statistics.
Best-fit results are given in Table 3 and are shown in Figure 5. The main result of this analysis is that the summed spectra are consistent with a single power-law model () with no absorption in excess of the Galactic value. The spectra in the RXJ0030 and 3C295 fields () are slightly flatter than the summed spectrum in the anti-Leonid field () but softer than in the 3C273 field (). the steeper spectrum from the anti-Leonid field could be due to a CTI effect that mostly affects the FI chips.
The spectra can also be described by a high-temperature (kT2-4 keV if z=0 and kT4-6 keV if z=0.5) thermal model with poorly constrained abundances (0.1-1 solar) and with values comparable to the single power-law model. The two models are indistinguishable, which is not surprising given the limited statistics. In addition we note that the summed spectra of sources detected only in the soft X-ray band are in all cases consistent with the “total” summed spectra, in agreement with the fact that we detect no “hard X-ray only” sources (§4.1).
5.2. Optical Identifications
We searched for optical counterparts to the S3 X-ray sources in RXJ0030 and 3C295 from the USNO-A2.0 catalog (Monet et al. 1998) which has positional errors arcsec (Deutsch 1999) and reaches a magnitude limit of about 20. We used a search radius of 3 arcsec. For larger radii, the fraction of random matches exceeds 10%. The USNO-A2.0 catalog includes and magnitudes. For ease of comparison with other works, we convert optical magnitudes originally in the band to the band using (Blair & Gilmore 1982), assuming . We apply a correction for extinction using the results of Burstein & Heiles (1978, 1982) and assuming . In addition, magnitudes, redshifts and classifications were obtained from the NED database for 2 objects in RXJ0030 and 5 in 3C295. We also included the recent identifications by Brandt et al. (2000) of 3 additional sources in the field of RXJ0030. Dressler & Gunn (1992) mapped the central (4) regions of 3C295 and obtained photometric redshifts for more than 100 galaxies in that area including 2 of the source counterparts (Table A). In total, we obtain photometric data for 13 sources and redshifts for 10 of these in the RXJ0030 and 3C295 central chips (Tables A.1 and A.2).
Starting from the magnitudes and the derived X-ray (0.5-2 keV) fluxes, we calculate the nominal X-ray to optical slope following Stocke et al. (1991). magnitudes, , redshifts, absolute and classification (if available) of the detected sources are reported in Tables A.1 and A.2.
In RXJ0030, four of the (5) sources with redshifts are forgeround galaxies while the bright CRSS QSO has z=0.492, which makes it a possible cluster member. However, only 5 out of 23 sources have redshifts. Of the 9 sources within 3′ of 3C295, 5 have redshifts: 2 are high-z QSOs, 2 are galaxies at z0.6, and one (row 1 in Table A.2) is a Seyfert 1 associated with the cluster (). The redshifts of the two galaxies have been estimated from optical colors and have relatively large errors (0.1; Thimm et al. 1994) so these two galaxies could be located at the cluster redshift.
Summarising, one source (out of 4 with redshifts) in RXJ0030 and three sources (out of 5 with redshifts) in 3C295 are possibly associated with the clusters. Given the current poor statistics and redshift uncertainties, deeper optical imaging and spectroscopy of more of these objects are needed to classify the excess sources and to determine whether they are associated with the clusters.
6. Discussion
The observations discussed in the present paper strongly suggest a factor 2 overdensity of 0.5-2 keV X-ray sources around two high-z clusters compared to field X-ray sources at a significance level of 2 each, or 3.5 when combined. Given the present statistics, we cannot rule out that we have measured (twice) a statistical fluctuation of the population of field X-ray sources. Clearly, further deeper X-ray observations are required to confirm the reality of the excess. It is however notable that this effect has been found around 2 different clusters (the only two in the archive that are currently public) and at roughly the same significance, making the chance coincidence rather unlikely. Our analysis of the outskirts of the FOVs suggests that the excess of sources disappears at large distance (1.5 Mpc) from the clusters. At least half of these sources must be the sources which produce the XRB (possibly a mixture of QSOs and Seyfert-type AGNs, Hasinger et al. 1998, Schmidt et al. 1998, Comastri et al. 1999). If the remaining “surplus” X-ray sources are associated with the clusters, then their average luminosity is 1042-43 erg s-1 in either the 0.5-2 keV or 2-10 keV bands. The effect merits some discussion.
6.1. On the Nature of the surplus X-ray sources
We shall here consider some possible explanations for the origin of these “surplus” X-ray sources.
6.1.1 Cosmic Variance?
Our view of the Universe now includes a web-like network of large-scale structures which include galaxies, clusters and filaments (Peebles 1993, Peacock 1999). Two-point correlation functions have been able to probe mass clustering on scales 5 Mpc for galaxies (e.g. Small et al. 1999), 10 Mpc for QSOs (Shaver et al. 1984, Kundic 1997, La Franca, Andreani & Cristiani 1998) and 100 Mpc for clusters (see Bahcall 1988 for a review). If X-ray sources are distributed like galaxies, then their surface density will have fluctuations due to the large scale structure. These fluctuations are known as “cosmic variance”. Could cosmic variance produce the observed effect? Few studies have been made in X-rays (see Barcons et al. 2000 for a recent review). Studies of complete samples of X-ray selected AGNs that probe the 1 Mpc scale of interest have only become possible in the last few years (Boyle & Mo 1993) and have found positive clustering signals on intermediate scales (0.5′–10′, Vikhlinin & Forman 1995; correlation length 40-80 Mpc, Carrera et al. 1998) and smaller scales ( 6 1.6 Mpc, Akylas, Georgantopoulos & Plionis 2000). The question here is: Is the present overdensity consistent with a random sample of cosmic variance? The answer is no, since the observed amplitude is 20-30%, i.e. much lower than the factor 2 fluctuations we measure here. Because we are looking at regions which are centered on distant clusters, we have however a highly biased sample. If a filament near a cluster lies mostly normal to the plane of the sky, then a source excess due to AGNs could however be produced near to the clusters. If this is the case, this could well represent the first measurement of large-scale structure of X-ray selected sources.
6.1.2 AGNs/quasars associated with the clusters?
Following Forman et al. (2000, in preparation), we estimate that the virial radii of RXJ0030 and 3C295, corresponding to a mean gas overdensity of 180, is 1 Mpc (i.e. 3′ at z=0.5). It is possible, therefore, that the sources are physically associated with the clusters.
All the objects with optical counterparts have consistent with type 1 AGNs (Elvis et al. 1994). If placed at the clusters’ redshifts all sources, including those with optical counterparts, would have X-ray luminosities of erg s-1 and , again consistent with being bright Seyfert 1 type AGN or low luminosity QSOs.
Supporting the AGN hypothesis are: (a) the shape of the summed spectra which are similar to that commonly seen in Seyfert type 1 galaxies, (b) the large luminosities (few 1042 erg s-1, Table 3) and (c) the of the few X-ray sources with optical counterparts (Tables A.1. and A.2). All three properties are typical of Seyfert galaxies and QSOs making this explanation attractive.
This would be however quite strange because AGN are normally rare in clusters. Although the galaxy environment of AGNs is not well studied (Krolik 1999) in the local Universe, AGNs are known to occur more frequently (5%) in field galaxies than in nearby (z0.1) cluster of galaxies (1%, Osterbrock 1960, Dressler, Thompson & Shectman 1985). There is no strong increase in the number of optically selected AGNs in typical higher-z clusters (e.g. Ellingson et al. 1997, 1998; Dressler et al. 1999).
3C295 and RXJ0030 may not be typical high-z clusters. Dressler & Gunn (1983) and Dressler et al. (1999) measured a frequency of AGNs of 10% in 3C295, i.e. 10 times larger than in other distant clusters (see Table 7 in Dressler et al. 1999). The pioneering X-ray work of Henry et al. (1985) also pointed out that the (X-ray selected) AGN population of 3C295 is larger than in low-redshift clusters. In conclusion, the AGN/quasars hypothesis requires 3C295 and RXJ0030 to be intrinsically unusual.
6.1.3 Powerful starburst galaxies associated with the clusters?
The limited statistics of the spectra of these faint X-ray sources do not allow us to place stringent constraints on the origin of their X-ray emission. The spectra are equally well described by a single power-law model or by a thermal model with kTfew keV (§5.1), consistent with the spectra of nearby starburst galaxies (Ptak et al. 1997, Dahlem, Weaver & Heckman 1998, Cappi et al. 1999). The spatial extents of the X-ray sources compared with the PSF, are consistent with being point like. The most stringent cases (on-axis) place a limit of 2” on the radius of the X-ray emitting region which, at z=0.5, corresponds to a poorly constraining limit of 15 kpc (starbursts have typical dimensions of 2 kpc, e.g. Heckman, Armus & Miley 1990). However, this hypothesis appears to be rather unlikely because the X-ray luminosities associated with the detected X-ray sources would be a factor of 10-100 times larger than usually observed in nearby starburst and normal galaxies (Fabbiano, Kim & Trinchieri 1992, David, Jones & Forman 1992) Moreover, there is no suggestion in the literature for a significant number of starbursts in distant clusters, not any more prevalent than in the field (e.g., Balogh et al. 1999).
Recent Chandra deep-surveys (Hornschemeier et al. 2000; Mushotzky et al. 2000, Fiore et al. 2000) have nevertheless found X-ray bright galaxies at similar redshifts with luminosities as high as a few 1042 erg s-1 that could either be ellipticals or star-forming galaxies. And as discussed in the previous section, 3C295 and RXJ0030 could be unusual. Indeed, the 3C295 cluster was first picked out (Butcher & Oemler 1978) as one of the first clusters discovered to have a larger percentage of blue galaxies than in nearby clusters (“Butcher-Oemler effect”, but see Dressler & Gunn 1983). The colors of the blue galaxies suggest they are probably undergoing star-formation; they may indeed be powerful starbursts in spiral galaxies surrounding the cluster (Dressler & Gunn 1983; Poggianti et al. 1999).
6.1.4 Gravitationally lensed sources?
Most rich clusters produce weakly distorted images of background galaxies/QSOs in the optical band (weak lensing) and occasionally giant arcs (strong lensing). Both 3C295 (Smail et al. 1997) and RXJ0030 (B. McNamara, private communication) show evidence of such effects implying cluster masses of the order of 1014M⊙ each. These large masses are also supported by the large (1300 km s-1) velocity dispersion in 3C295 (Dressler & Gunn 1992). Both clusters may, therefore, have large Einstein angles of up to 1 arcmin, depending on the redshifts of the background sources (e.g. Kochanek 1992). One may naively expect an increased number of serendipitous sources near the clusters arising from the amplification of distant (and fainter) background sources. Optical evidence for such an effect has been claimed by Rodrigues-Williams & Hogan (1994) who report a statistically significant overdensity (by a factor 1.7) of high redshift QSOs in the directions of foreground galaxy clusters. In 3C295, 9 (out of 17) X-ray sources are located in an annulus of radii 1′-3′ from the cluster center (see Fig. 1b), and 4 of these sources (sources n. 3, 5, 8 and 13, Table A.2) have redshifts larger than the cluster’s redshift.
However, the magnification due to gravitational lensing produces two opposing effects on the source number counts (e.g. Croom & Shanks 1999): Individual sources appear brighter by (where is the amplification factor) raising the number detected; but the area of sky lensed is reduced by the same factor . The net effect depends on the slope of the logN-logS curve. At high fluxes where the logN-logS is steep, sources are added to counts; but at faint fluxes, the flatter logN-logS produces a deficit in the source counts (Wu 1994). Refregier & Loeb (1997) predict on average a reduction in the surface density of faint resolved sources at fluxes fainter than about 10-15 erg cm-2 s-1 (0.5-2 keV). An upturn in the logN-logS at very faint fluxes (e.g. 210-16 erg cm-2 s-1) would be needed to create the observed excess.
6.2. “Contamination” of the relation of high-z clusters
Point sources contribute a substantial fraction of the clusters’ fluxes, at least between 0.5-2 keV (see §3.2). Therefore, if this finding applies to a significant fraction of medium-high redshift clusters, past X-ray measurements of luminosities and temperatures of distant clusters obtained with low resolution experiments (see, e.g., the ASCA measurements by Mushotzky & Scharf 1997) have probably been “contaminated” by the surrounding unresolved surplus sources (Note that the contribution from field sources is excluded through normal background subtraction). The present data indicate a possible contamination of the cluster’s fluxes of up to 40% and 15% in RXJ0030 and 3C295, respectively. The effect on the observed relation (e.g. Wu, Xue & Fang, 1999) will depend on the way in which the contamination varies with redshift, with cluster size and on the surplus source spectra. The sources have a summed spectrum of kT5 keV (cluster rest-frame), therefore, at the 0th-order, these would lower the observed temperature of clusters with kT5 keV (i.e. the highest luminosity clusters) but increase that of lower-temperature clusters. As a result, these effects should increase the scattering and possibly modify the shape of the true relation of high-z clusters. Any changes to the relation of clusters would have important consequences for using clusters as cosmological probes (e.g., Henry 2000). More studies using and are required in order to quantify the implications of such an effect.
7. Conclusions
We have presented a study of an overdensity of X-ray sources around two z0.5 clusters (RXJ0030 and 3C295). The observed source density near these clusters appears to be a factor of 2 times larger than expected on the basis of the ROSAT and Chandra logN-logS or by comparison to non-cluster fields and to the outskirts of the cluster FOVs. The radial distribution of the sources suggests that they are indeed concentrated within 200 arcsec of the clusters. The effect is significant (at /cluster or 3.5 when combined) in the 0.5-2 keV energy band, but not in the 2-10 keV band where the statistics are too poor. Deeper X-ray observations are needed to confirm unambiguously this result. For both fields, the summed X-ray spectra of the faint sources are consistent with a power-law spectrum with and no intrinsic absorption. If the sources are at the redshifts of the clusters, their average luminosity is 1042-43 erg s-1 making Seyfert-like AGNs/quasars the most likely counterparts. The number of redshifts currently available is, however, too small to be conclusive.
Possible explanations of the apparent overdensity may be: a statistical variance of cosmic background sources; AGNs/quasars and/or powerful starburst galaxies associated with the clusters; and gravitationally lensed sources. None of these explanations is without problems however. Only follow-up X-ray and optical observations (redshift measurements) will determine the true cause.
References
- (1) “Chandra Proposer’s Observatory Guide”, 1999, version 2.0, March 15, 2000, http://asc.harvard.edu/udocs/docs/docs.html
- (2) Akylas, A., Georgantopoulos, I., & Plionis, M. 2000, MNRAS, in press (astro-ph/9911254)
- (3) Bahcall, N.A. 1988, ARA&A, 26, 631
- Balogh et al. (1999) Balogh, M. L., Morris, S. L., Yee, H. K. C., Carlberg, R. G. and Ellingson, E. 1999, ApJ, 527, 54
- (5) Barcons, X., Carrera, F.J., Ceballos, M.T., & Mateos, S. 2000, Astrophysical Letter and Communication, in press (astro-ph/0001182)
- (6) Blair, M., & Gilmore, G. F. 1982 PASP, 94, 742
- (7) Boyle, B. J. & Mo, H. J. 1993, MNRAS, 260, 925
- Boyle McMahon Wilkes & Elvis (1995) Boyle, B. J., McMahon, R. G., Wilkes, B. J. & Elvis, M. 1995, MNRAS, 272, 462
- (9) Brandt, W.N. et al. 2000, AJ, 119, 2349
- (10) Burstein, D., & Heiles, C. 1978 ApJ, 225, 40
- (11) Burstein, D., & Heiles, C. 1982 AJ, 87, 1165
- Butcher & Oemler (1978) Butcher, H. & Oemler, A. , Jr. 1978, ApJ, 219, 18
- (13) Cagnoni, I., Della Ceca, R., & Maccacaro, T. 1998, ApJ, 493, 54
- Cappi et al. (1999) Cappi, M., et al. 1999, A&A, 350, 777
- (15) Carrera, F.J., Barcons, X., Fabian, A.C., Hasinger, G., Mason, K.O., McMahon, R.G., Mittaz, J.P.D., & Page, M.J. 1998, MNRAS, 299, 229
- Ciliegi et al. (1995) Ciliegi, P., Elvis, M., Wilkes, B. J., Boyle, B. J., McMahon, R. G. & Maccacaro, T. 1995, MNRAS, 277, 1463
- Comastri, Setti, Zamorani and Hasinger (1995) Comastri, A., Setti, G., Zamorani, G. and Hasinger, G. 1995, A&A, 296, 1
- (18) Comastri, A., Fiore, F., Giommi, P., La Franca, F., Elvis, M., Matt, G., Molendi, S., & Perola, G.C. 1999, Advances in Space Research, Proceedings of the 32nd Scientific Assembly of COSPAR, in press (astro-ph/9902060)
- Croom and Shanks (1999) Croom, S. M. and Shanks, T. 1999, MNRAS, 307, L17
- Dahlem, Weaver and Heckman (1998) Dahlem, M., Weaver, K. A. and Heckman, T. M. 1998, ApJS, 118, 401
- David Jones & Forman (1992) David, L. P., Jones, C. & Forman, W. 1992, ApJ, 388, 82
- (22) Della Ceca, R., Braito, V., Cagnoni, I., & Maccacaro, T., 2000, Astrophysical Letters and Communications, in press (astro-ph/9912016)
- (23) Deutsch, E. W. 1999, AJ, 118, 1882
- (24) Dobrzycki, A., Ebeling, H., Glotfelty, K., Freeman, P., Damiani, F., Elvis, M., & Calderwood, T. 1999, “Chandra 1.0 User Guide”, rev.1.0, http://asc.harvard.edu/udocs/docs/docs.html
- (25) Dressler, A., & Gunn, J.E. 1983, ApJ, 270, 7
- (26) Dressler, A., & Gunn, J.E. 1992, ApJS, 78, 1
- (27) Dressler, A., Thompson, I., & Shectman, S. 1985, ApJ, 288, 481
- Dressler et al. (1999) Dressler, A., Smail, I., Poggianti, B. M., Butcher, H., Couch, W. J., Ellis, R. S. and Oemler, A. J. 1999, ApJS, 122, 51
- Elvis et al. (1994) Elvis, M. , et al. 1994, ApJS, 95, 1
- Fabbiano Kim & Trinchieri (1992) Fabbiano, G., Kim, D. -W. & Trinchieri, G. 1992, ApJS, 80, 531
- Ellingson et al. (1997) Ellingson, E., Yee, H. K. C., Abraham, R. G., Morris, S. L., Carlberg, R. G. and Smecker-Hane, T. A. 1997, ApJS, 113, 1
- Ellingson et al. (1998) Ellingson, E., Yee, H. K. C., Abraham, R. G., Morris, S. L. and Carlberg, R. G. 1998, ApJS, 116, 247
- Fiore et al. (2000) Fiore, F. et al. 2000, New Astronomy, 5, 143
- (34) Freeman, P.E., Kashyap, V., Rosner, R., & Lamb, D.Q. 2000, ApJ, submitted
- (35) Gehrels, N. 1986, ApJ, 303, 336
- Gendreau Barcons & Fabian (1998) Gendreau, K. C., Barcons, X. & Fabian, A. C. 1998, MNRAS, 297, 41
- (37) Giacconi, R., et al. 2000, ApJ submitted (astro-ph/0007240)
- (38) Giommi, P., Perri, M., & Fiore, F. 2000, A&A, in press (astro-ph/0006333)
- (39) Harris, D.E., et al., 2000, ApJL, 530, L81.
- (40) Hasinger, G., Burg, R., Giacconi, R., Schmidt, M., Trümper, J., & Zamorani, G. 1998, A&A, 329, 482
- Heckman, Armus and Miley (1990) Heckman, T. M., Armus, L. and Miley, G. K. 1990, ApJS, 74, 833
- (42) Henry, J.P., Lavery, R.J., Clarke, J.T., & Bowyer, S. 1985, AJ, 90, 1425
- Henry (2000) Henry, J. P. 2000, ApJ, 534, 565
- Henriksen & Byrd (1996) Henriksen, M. & Byrd, G. 1996, ApJ, 459, 82
- (45) Hernquist, L. 1989, Nature, 340, 687
- Hewitt & Burbidge (1989) Hewitt, A. & Burbidge, G. 1989, ApJS, 69, 1
- (47) Hornschemeier, A.E., et al. 2000, ApJL, in press (astro-ph/0004260)
- Kochanek (1992) Kochanek, C. S. 1992, ApJ, 397, 381
- Krolik (1999) Krolik, J. H. 1999, Active galactic nuclei : from the central black hole to the galactic environment /Julian H. Krolik. Princeton, N. J. : Princeton University Press, c1999.,
- (50) Kundic, T. 1997, ApJ, 482, 631
- (51) La Franca, F., Andreani, P., & Cristiani, S. 1998, ApJ, 497, 529
- (52) Markevitch, M. 1999, calibration report of Nov., 18th, http://asc.harvard.edu/cal/
- (53) Monet, D., et al. 1998, USNO-A2.0: A Catalog of Astrometric (Washington: US Nav. Obs.)
- (54) Mushotzky, R.F., Cowie, L.L., Barger, A.J., Arnaud, K.A., 2000, Nature, 404, 459
- Mushotzky & Scharf (1997) Mushotzky, R. F. & Scharf, C. A. 1997, ApJ, 482, L13
- (56) Osterbrock, D.E. 1960, ApJ, 132, 325
- (57) Peacock, J.A., 1999, “Cosmological Physics” [Cambridge University Press]
- (58) Peebles, J.E., 1993, “Principles of Physical Cosmology” [Princeton University Press]
- Poggianti et al. (1999) Poggianti, B. M., Smail, I., Dressler, A., Couch, W. J., Barger, A. J., Butcher, H., Ellis, R. S. and Oemler, A. J. 1999, ApJ, 518, 576
- Ptak et al. (1997) Ptak, A., Serlemitsos, P., Yaqoob, T., Mushotzky, R. & Tsuru, T. 1997, AJ, 113, 1286
- Refregier & Loeb (1997) Refregier, A. & Loeb, A. 1997, ApJ, 478, 476
- Rodrigues-Williams and Hogan (1994) Rodrigues-Williams, L. L. and Hogan, C. J. 1994, AJ, 107, 451
- (63) Schechter, P.L. 1976, ApJ, 203, 297
- Schmidt et al. (1998) Schmidt, M. et al. 1998, A&A, 329, 495
- (65) Schmitt, J.H.M.M., & Maccacaro, T., 1986, ApJ, 310, 334
- (66) Shaver, P.A. 1984, A&A, 138, 131
- Smail et al. (1997) Smail, I. , Ellis, R. S., Dressler, A. , Couch, W. J., Oemler, A. , Jr., Sharples, R. M. & Butcher, H. 1997, ApJ, 479, 70
- (68) Small, T.A., Ma, C.-P., Sargent, W.L.W., Hamilton, D. 1999, ApJ, 524, 31
- (69) Stark, A.A., Gammie, C.F., Wilson, R.W., Bally, J., Linke, R.A., Heiles, C., & Hurtwitz, M. 1992, ApJS, 79, 77
- (70) Stocke, J. T., et al. 1991, ApJS, 76, 813
- (71) Thimm, G.J., Röser, H.-J., Hippelein, H., & Meisenheimer, K. 1994, A&A, 285, 785
- (72) VanSpeybroeck, L.P., Jerius, D., Edgar, R.J., Gaetz T.J., & Zhao, P. 1997, Proc. SPIE, 3113, 89.
- (73) Vikhlinin, A., & Forman, W., 1995, ApJ, 455, L109
- (74) Vikhlinin, A., McNamara, B.R., Forman, W., Jones, C., Quintana, H., & Hornstrup, A. 1998, ApJ, 502, 558
- (75) Weisskopf, M.C., O’dell, S.L, & van Speybroeck, L.P., 1996 SPIE, 2805, 2
- Wu (1994) Wu, X. -. 1994, A&A, 286, 748
- Wu, Xue and Fang (1999) Wu, X., Xue, Y. and Fang, L. 1999, ApJ, 524, 22
APPENDIX
I - DATA CLEANING AND REDUCTION
The data from the entire FOVs were cleaned and analyzed using the Interactive Analysis of Observations (CIAO) software (release V1.1, Elvis et al. 2000, in preparation, see also http://asc.harvard.edu/cda/). The data were first filtered to include only the standard event grades 0, 2, 3, 4 and 6, and energies between 0.1–10 keV. All hot pixels and bad columns were removed. Time intervals with large background rate (i.e. larger than 3 over the quiescent value) were removed chip-by-chip yielding different exposures for each chip. The differences were small, 5%, for the 3C295, anti-Leonid and 3C273 fields but were 25% for RXJ0030, where the two BI chips in the RXJ0030 field had 30 ks exposure compared to 40 ks for the FI chips. This larger difference is due to the larger and more variable background flux observed in the BI chips which, being thinner, are less effective in rejecting background high-energy particles (Markevitch 1999). Data from the outer FI S4 chip and the BI S1 chip were excluded from the analysis of RXJ0030 and 3C295 because the effective exposure of S4 was 5 times smaller than for the other chips (indicative of a very noisy background) and because S1 was more than 10 arcmin from the optical axis, which reduces its sensitivity by 20-50% due to vignetting. For the anti-Leonid field, we also excluded the data from the S2 chip because of its large ( 10 arcmin) off-axis distance. For the 3C273 field, we only considered the BI S3 chip, which is sufficient for the scope of the present study. We excluded in this field the area underneath the line emission which is due to exposure during read out.
The 3C273 field provides a comparison for the two cluster fields which is independent of any systematic variations between ccds, since these 3 fields were all observed with the same chip, S3. The larger area covered by the four FI chips in the anti-Leonid observation lowers the statistical uncertainty in the non-cluster number counts and allows a comparison of the sources spatial distribution (see §4.3). The FI chips have significantly lower background flux and a somewhat lower effective area at E1 keV than BI chips. However these effects should not significantly affect the present results because appropriate matrices (constructed with CIAO) were used to account for the different instrument responses and the background level is, in fact, negligible in both FI and BI at the flux limit used here (§4.1).
II - THE SOURCE DETECTIONS
In its simplest form, consists of correlating the image data with wavelet functions in successively larger scale versions of the wavelet, comparing the resulting “correlation maps” to a local background and detecting sources above a given threshold (Dobrzycki et al. 1999, Freeman et al. 2000). We considered only the 0.5-2 keV and 2-10 keV energy bands where is best calibrated, and which allows direct comparison with ROSAT, ASCA and previous Chandra results (see §4.1). The original data were binned by 4, yielding pixels of 2” on a side, in order to obtain 10001000 pixel images (for the whole FOV). The software was run on several scales in order to match the (variable) dimensions of the PSF over the FOV. Aspects of the detection method include: (a) the computation of the correlation maps using a FFT; (b) the computation of a local, exposure-corrected and normalized (i.e. flat-fielded) background in each pixel; (c) its applicability to the low-counts regime of , as it does not require a minimum number of background counts per pixel for accurate computation of source detection thresholds; (d) its applicability to multiscale data (i.e. extended sources); (e) its applicability to the FOVs (i.e the algorithm recognises where the aim point is located); and (f) a full error analysis. As a result, it is substantially more efficient than a sliding-cell technique in detecting weak point sources in crowded fields and extended sources.
We performed several runs of wavdetect, setting the probability of erroneously associating a background fluctuation in a pixel with a detection to 3.4 10-6, 1.010-6, 2.910-7, and 1.010-7. These probabilities correspond approximately to Gaussian equivalent significances of 4.5, 4.7, 5 and 5.2, respectively. ACIS-I simulations and other calculations (Freeman et al. 2000) show that these thresholds produce 3, 1, 0.3 and 0.1 false detections per 4 chips FOV, respectively. We set the threshold to correspond to one expected spurious source (probability of 10-6, 4.7).
The dither pattern creates rapid changes in exposure near the edges of the chips which are not currently accounted for in either source detection algorithm. As a result, this introduces a significant number of spurious detections of extremely faint sources with 6 counts. We therefore introduced an additional selection criterion: that the sources should also have a significance level SN3, where SN (an output of ) is defined as the number of source counts divided by the Gehrels (1986) standard deviation of the number of background counts, in order to be considered as real. We checked and found that none of the excluded sources had a flux larger than the flux limit used in §4.1.
We also checked the results from by comparing them to the (Dobrzycki et al. 1999) output. is a robust sliding-cell algorithm in CIAO which utilizes a sliding-box of variable size according to the position in the FOV and according to a pre-defined encircled energy (for a PSF calculated at a given energy). The background is calculated, locally, in annuli centered on the cells with an area equal to the source area (typical sizes of the boxes were 6–10” per side, on-axis, and 10-15” per side, at 5′ off-axis). We found that, for sources brighter than 15 net counts, the match was better than 90% in both the obtained positions and number of source counts, confirming that the wavelet algorithm is working well.
III - THE SOURCE COUNTS AND FLUXES
Source count rates were obtained using from regions with typical radii of 3” (on-axis) and 10” (off-axis). Comparing the cell regions with the expected dimensions of the PSF at the source positions, we estimate that our extraction regions contain more than 99% of the PSF encircled energy. Background counts were estimated locally for the same area on the basis of the background map produced by (Freeman et al. 2000).
The measured counts were first corrected for vignetting and then converted to an emitted, unabsorbed flux. The vignetting is larger for photons with E 4 keV and, at those energies, the effective area is reduced by 40% at 10 arcmin. We applied a correction for the effective area off-axis using the pre-flight calibration. However, this correction was typically not large, since our detections are dominated by photons with E keV (see Fig. 5). The vignetting 10′ off axis drops to for photon energies of keV, where Chandra’s effective area peaks. The correction we applied is based on Fig. 4.3 of the “Chandra Proposer’s Observatory Guide” (1999) that we approximate using a linear function of the form:
where is the vignetting correction factor (to be multiplied to all the counts) and is the off-axis distance in arcmin.
For the conversion from counts to flux, a power-law spectrum with photon index =2 and =1.7 was assumed for the sources detected between 0.5-2 keV and 2-10 keV, respectively. We assumed Galactic absorption columns of 3.91, 1.33, 2.45 and 1.8 1020 cm-2 along the line of sight of the RXJ0030, 3C295, anti-Leonid and 3C273 fields, respectively (Stark et al. 1992). These spectral models were chosen to allow a direct comparison with the ROSAT PSPC and ASCA results (Hasinger et al. 1998, Della Ceca et al. 2000). These assumed spectra are consistent with the summed spectra obtained in §4.2. Moreover in these energy bands, the fluxes are only weakly dependent on the spectral slope and the Galactic value adopted (e.g. a =0.2 gives a flux of less than 5%). Systematic instrumental errors in the absolute effective area and energy scale are conservatively below 10%-20% at all the energies considered here (N. Schultz, private communication). Small changes can be expected once refined calibrations become available.
Table 1 Log of Observations
| Obs. Id | Obs. Mode | Exposure∗ | Nominal Pointing | ||
| (s) | RA(2000) | DEC(2000) | |||
| Cluster Fields | |||||
| RXJ0030 | 1190 | ACIS-S, 4 chips | 15375 | 00:30:40 | +26:18:00 |
| 1226 | ACIS-S, 4 chips | 14746 | |||
| merged | ACIS-S, 4 chips | 30121 | |||
| 3C295 | 578 | ACIS-S, 4 chips | 18280 | 14:11:10 | +52:13:01 |
| Comparison Fields | |||||
| anti-Leonid | 1479 | ACIS-I, 4 chips | 20580 | 22:13:12 | 22:10:41 |
| 3C273 | 1712 | ACIS-S, 1 chip(S3) | 22800 | 12:29:06 | +02:03:14 |
∗ Exposure time obtained for the on-axis chips (ACIS-S3 for RXJ0030, 3C295 and 3C273, and ACIS-I3 for anti-Leonid)
Table 2a Number of Sources Detected between 0.5-2 keV
| RXJ0030(S3) | 3C295(S3) | ROSATa/Chandrab/Chandrac | anti-Leonid(I0-3)d | 3C273(S3) | |
|---|---|---|---|---|---|
| Flimit=3 10-15 erg cm-2 s-1 | |||||
| 13 3.6 | 13 3.6 | 7.7 1.4 | 5 2.2 | ||
| 731 202 | 731 202 | 33631/335/288 | 43678 | 280 126 | |
| Flimit = 1.5 10-15 erg cm-2 s-1 | |||||
| 21 4.6 | 16 4 | 10.51.6 | 11 3.3 | ||
| 1181 259 | 900225 | 60070/544/502 | 57864 | 619 187 | |
Table 2b Number of Sources Detected between 2-10 keV
| RXJ0030(S3) | 3C295(S3) | ASCA/modele | anti-Leonid(I0-3)d | 3C273(S3) | |
| Flimit = 2 10-14 erg cm-2 s-1 | |||||
| 4 2 | 4 2 | 1.20.5 | 4 2 | ||
| 225 112 | 225 112 | 120/120 | 7031 | 225 112 | |
a ROSAT PSPC values and statistical errors obtained from Hasinger et al. (1998)
b Chandra “best-fit” values obtained from Mushotzky et al. (2000)
c Chandra “best-fit” values obtained from Giacconi et al. (2000)
d sources were detected in the 4 ACIS-I chips and normalized for 1 single chip (for comparison with RXJ0030, 3C295 and 3C273).
e Linear extrapolation of measured ASCA values from Della Ceca et al. (2000) and expected value from theoretical model of Comastri et al. (1999).
NOTE: Errors on the numbers are the square root of N.
Table 3: Best-fits of summed∗ spectra - Single power-law models
| Field | |||
|---|---|---|---|
| ( cm-2) | |||
| RXJ0030 | 3.9 | 1.72 | 27.5 (39) |
| 3C295 | 1.33 | 1.79 | 21.3 (30) |
| anti-Leonid | 2.45 | 2.28 | 34.7 (42) |
| 3C273 | 1.80 | 1.24 | 32.9 (36) |
∗ Computed with 22 sources in RXJ0030, 16 in 3C295, 24 in the anti-Leonid fields, and 12 in 3C273 (see §5.1).
Note: Intervals are at 90% confidence for one interesting parameter.
1a
![[Uncaptioned image]](/html/astro-ph/0009199/assets/x2.png)
1b
![[Uncaptioned image]](/html/astro-ph/0009199/assets/x3.png)
1c
![[Uncaptioned image]](/html/astro-ph/0009199/assets/x4.png)
1d


![[Uncaptioned image]](/html/astro-ph/0009199/assets/x8.png)
![[Uncaptioned image]](/html/astro-ph/0009199/assets/x9.png)
0.5truecm
![[Uncaptioned image]](/html/astro-ph/0009199/assets/x10.png)
![[Uncaptioned image]](/html/astro-ph/0009199/assets/x11.png)
Added spectra of all the serendipitous sources (cluster and/or brightest sources excluded) in the RXJ0030, 3C295, anti-Leonid, and 3C273 fields: best-fit spectra modelled with a single power-law as given in Table 3. Data were binned in order to have a S/N3 in each energy bin.
Table A - 1: list of point sources detected between 0.5-2 keV and 2-10 keV
in the RXJ0030 field – ACIS-S3 central chip (target cluster excluded) RXJ0030 field row raa (2000) deca (2000) Net Counts Bgd Counts Flux z class Ref.d 10-15cgs (′) 1042erg/s (0.5-2 keV) 1 00:30:39.5 +26:20:56.4 1023.49 32.47 6.76 0.03 112.58 3.57 3.0 17.3 1.62 0.492 134.2 -25.2 QSO 1 2 00:30:57.9 +26:17:44.8 120.54 11.49 4.01 0.02 13.26 1.26 5.0 - 3 00:30:47.9 +26:16:48.6 96.23 10.17 4.85 0.02 10.59 1.12 3.0 18.4 1.85 0.246 2.9 -22.6 Sey2 2 4 00:30:51.4 +26:17:14.3 84.14 9.63 5.54 0.03 9.26 1.06 3.6 19.7 1.66 0.129 0.7 -19.6 gal? 3 5 00:30:26.1 +26:16:49.7 83.06 9.36 3.20 0.02 9.14 1.03 2.6 19.2 1.76 0.269 3.0 -21.9 QSO 3 6 00:30:27.8 +26:13:60.0 49.97 7.50 3.41 0.02 5.50 0.82 4.6 19.8 1.79 - 7 00:30:27.9 +26:15:15.2 38.33 6.67 4.77 0.02 4.22 0.73 3.4 - 8 00:30:41.7 +26:17:42.7 38.04 6.44 3.69 0.02 4.18 0.71 1.3 - 9 00:30:33.3 +26:14:52.4 37.59 6.50 3.42 0.02 4.14 0.71 3.3 19.3 1.86 0.247 1.1 -21.3 gal. 3 10 00:30:44.4 +26:18:32.6 37.45 6.43 3.71 0.02 4.12 0.71 2.0 - 11 00:30:31.0 +26:16:00.6 35.43 6.24 2.98 0.02 3.90 0.69 2.4 - 12 00:30:59.8 +26:17:18.9 34.80 6.30 2.34 0.02 3.83 0.69 5.5 - 13 00:30:54.8 +26:14:47.5 28.81 6.02 4.94 0.02 3.17 0.66 5.4 - 14 00:30:37.2 +26:19:04.4 25.79 5.68 6.91 0.03 2.84 0.62 1.1 - 15 00:30:51.8 +26:18:56.6 25.34 5.47 3.51 0.02 2.79 0.60 3.7 - 16 00:30:21.7 +26:18:34.4 23.93 5.24 2.72 0.02 2.63 0.58 3.3 - 17 00:30:44.3 +26:17:02.7 23.62 5.23 3.56 0.02 2.60 0.58 2.1 20.2 1.81 - 18 00:30:49.6 +26:16:05.1 19.93 4.96 3.73 0.02 2.19 0.55 3.7 - 19 00:30:42.7 +26:17:48.6 19.60 4.68 2.33 0.02 2.16 0.51 1.5 - 20 00:30:39.7 +26:14:19.5 18.15 4.64 2.51 0.02 2.00 0.51 3.9 19.1 2.03 - 21 00:30:27.8 +26:15:28.9 14.61 4.23 2.76 0.02 1.61 0.47 3.2 - 22 00:30:34.6 +26:13:51.9 13.46 4.18 3.11 0.02 1.48 0.46 4.3 - 23 00:30:31.2 +26:14:38.3 11.84 3.87 2.54 0.02 1.30 0.43 3.6 - (2-10 keV) 1 00:30:39.5 +26:20:56.2 596.50 25.10 19.01 0.05 417.55 17.57 497.7 4 00:30:51.4 +26:17:14.8 37.38 7.23 12.81 0.04 26.16 5.06 34.4 3 00:30:47.9 +26:16:48.9 32.51 6.86 13.19 0.04 22.76 4.80 6.3 11 00:30:31.0 +26:16:00.5 28.10 6.40 12.23 0.04 19.67 4.48 - 2 00:30:57.8 +26:17:44.8 16.44 4.96 6.45 0.03 11.51 3.47 - 5 00:30:26.2 +26:16:49.6 14.60 4.65 6.61 0.03 10.22 3.26 13.5
Table A - 2: list of point sources detected between 0.5-2 keV and 2-10 keV
in the 3C295 field – ACIS-S3 central chip (target cluster excluded)
3C295 Field
row
raa (2000)
deca (2000)
Net Counts
Bgd Counts
Flux
z
class
Ref.d
10-15cgs
(′)
1042erg/s
(0.5-2 keV)
1
14:11:23.4
+52:13:31.4
360.33 19.04
3.50 0.02
55.85 2.95
1.5
19.8
1.34
0.47
58.6
-22.6
Sey1
4
2
14:11:04.1
+52:17:56.0
121.50 11.59
2.56 0.02
18.83 1.80
6.3
18.6
1.73
-
-23.6
3
14:11:19.5
+52:14:00.0
112.82 10.85
4.50 0.02
17.49 1.68
1.9
22.0
1.20
1.29
172.0
-22.8
QSO
5
4
14:11:24.8
+52:19:23.9
82.36 9.65
2.11 0.02
12.77 1.50
7.4
-
5
14:11:27.4
+52:11:31.2
51.48 7.38
3.25 0.02
7.98 1.14
1.4
20.1
1.62
0.59
13.9
-22.8
Sbc
6
6
14:10:59.5
+52:11:52.8
51.15 7.31
1.06 0.01
7.93 1.13
3.1
-
7
14:11:30.8
+52:14:23.4
35.40 6.12
1.31 0.01
5.49 0.95
2.9
13.7
2.68
-
-28.5
star?
8
14:11:13.7
+52:13:40.4
33.12 5.92
1.92 0.02
5.13 0.92
1.8
21.2
1.53
2.08
147.0
-24.8
QSO
4
9
14:11:09.0
+52:16:45.1
30.34 5.79
1.28 0.01
4.70 0.90
4.9
-
10
14:10:57.4
+52:11:30.0
24.73 5.16
1.01 0.01
3.83 0.80
3.5
-
11
14:11:14.5
+52:16:10.9
22.44 5.00
1.48 0.01
3.48 0.78
4.2
-
12
14:11:20.7
+52:14:11.5
22.06 4.93
2.08 0.02
3.42 0.76
2.1
-
13
14:11:29.2
+52:13:32.5
20.11 4.72
2.02 0.02
3.12 0.73
2.1
21.5
1.56
0.66
7.0
-21.7
Scd
6
14
14:11:26.3
+52:18:47.8
16.33 4.36
1.01 0.01
2.53 0.68
6.8
-
15
14:11:19.8
+52:15:46.3
12.28 3.73
1.13 0.01
1.90 0.58
3.7
-
16
14:11:33.1
+52:11:02.6
10.93 3.51
1.20 0.01
1.69 0.54
2.4
-
17
14:11:27.0
+52:14:14.0
8.24 3.20
1.87 0.01
1.28 0.50
2.4
-
(2-10 keV)
1
14:11:23.4
+52:13:31.2
80.04 9.14
3.69 0.02
91.2 10.4
98.5
2
14:11:04.1
+52:17:55.8
45.95 7.87
10.49 0.04
52.4 9
-
5
14:11:27.4
+52:11:31.3
30.31 5.80
3.53 0.02
34.6 6.6
60.6
3
14:11:19.4
+52:14:00.4
29.40 5.93
5.69 0.03
33.5 6.8
329.1
a Position uncertainties are estimated to be within 2”
b , as defined in Stocke et al., 1991
c z=0.5 and z=0.46 are assumed for RXJ0030 and 3C295 respectively, unless the redshift is available from the literature.
d References: (1) Ciliegi et al. 1995, (2) Boyle et al. 1995, (3) Brandt et al. 2000, (4) Dressler & Gunn 1992, (5) Hewitt & Burbidge 1989, (6) Thimm et al. 1994.
Table A - 3: list of point sources detected between 0.5-2 keV and 2-10 keV
in the anti-Leonid field - whole FOV (4 chips)
anti-Leonid (4 chips)
row
raa (2000)
deca (2000)
Net Counts
Bgd Counts
Flux
10-15cgs
(′)
(0.5-2 keV)
1
22:13:52.4
-22:15:56.2
333.20 19.86
5.38 0.03
82.97 4.95
11.0
2
22:13:23.2
-22:07:24.5
257.09 16.37
1.20 0.01
64.02 4.08
6.2
3
22:12:57.5
-22:21:35.5
213.74 16.10
4.92 0.02
53.22 4.01
4.8
4
22:13:13.1
-22:04:25.5
109.38 10.90
1.18 0.01
27.23 2.71
4.5
5
22:12:49.1
-22:11:32.2
74.91 9.01
0.93 0.01
18.65 2.24
4.1
6
22:12:55.8
-22:10:04.6
72.03 8.69
0.67 0.01
17.94 2.16
5.5
7
22:12:40.1
-22:07:48.1
51.28 7.61
0.83 0.01
12.77 1.90
3.8
8
22:13:26.2
-22:05:50.5
49.22 7.39
1.87 0.01
12.26 1.84
2.3
9
22:12:25.1
-22:07:28.5
43.80 7.50
3.62 0.02
10.91 1.87
2.4
10
22:13:28.7
-22:11:51.6
34.99 6.08
0.43 0.01
8.71 1.51
1.4
11
22:13:19.5
-22:08:36.0
31.99 5.72
0.37 0.01
7.97 1.42
5.9
12
22:13:33.1
-22:10:03.8
27.81 5.48
0.64 0.01
6.92 1.36
1.4
13
22:12:43.4
-22:18:38.1
24.44 5.45
0.95 0.01
6.09 1.36
3.1
14
22:12:51.5
-22:13:48.7
24.07 5.16
0.65 0.01
5.99 1.29
5.3
15
22:12:54.2
-22:19:05.3
23.68 5.49
2.30 0.02
5.90 1.37
4.6
16
22:13:25.9
-22:16:44.6
22.24 5.03
0.73 0.01
5.54 1.25
3.2
17
22:13:37.9
-22:08:29.3
22.14 4.95
0.49 0.01
5.51 1.23
4.8
18
22:12:58.1
-22:13:59.9
21.72 4.85
0.49 0.01
5.41 1.21
3.1
19
22:12:47.7
-22:17:49.8
19.10 4.96
2.23 0.02
4.76 1.24
3.3
20
22:13:27.6
-22:14:24.6
16.62 4.26
0.42 0.01
4.14 1.06
5.1
21
22:13:41.0
-22:15:10.1
16.06 4.32
0.61 0.01
4.00 1.08
1.2
22
22:13:04.5
-22:14:36.6
15.44 4.08
0.35 0.01
3.84 1.02
3.9
23
22:13:00.5
-22:08:32.9
14.00 3.85
0.39 0.01
3.49 0.96
4.8
24
22:13:30.2
-22:03:20.3
13.76 4.01
0.64 0.01
3.43 1.00
6.1
25
22:13:12.6
-22:08:52.5
13.62 3.72
0.32 0.01
3.39 0.93
5.6
26
22:13:29.0
-22:07:55.5
13.30 3.78
0.33 0.01
3.31 0.94
8.0
27
22:12:54.5
-22:08:01.4
13.24 3.80
0.44 0.01
3.30 0.95
8.6
28
22:13:03.7
-22:08:04.2
12.89 3.69
0.40 0.01
3.21 0.92
8.0
29
22:12:57.5
-22:19:15.9
12.55 4.12
2.00 0.02
3.13 1.02
8.3
30
22:13:20.6
-22:11:31.0
11.83 3.50
0.28 0.01
2.95 0.87
8.2
31
22:13:07.9
-22:15:25.9
10.30 3.36
0.32 0.01
2.56 0.84
5.5
32
22:12:38.1
-22:06:34.9
9.72 3.56
1.37 0.01
2.42 0.89
7.3
33
22:13:08.1
-22:07:22.9
8.89 3.07
0.33 0.01
2.21 0.77
7.2
34
22:13:06.5
-22:07:26.5
7.83 2.90
0.37 0.01
1.95 0.72
9.9
35
22:13:49.1
-22:11:12.2
7.57 2.97
0.25 0.01
1.88 0.74
9.6
36
22:13:45.6
-22:11:57.0
7.35 2.94
0.38 0.01
1.83 0.73
1.1
37
22:13:20.3
-22:03:24.7
7.22 2.90
0.42 0.01
1.80 0.72
1.1
38
22:13:06.9
-22:05:56.7
6.96 2.78
0.37 0.01
1.73 0.69
3.3
39
22:13:20.8
-22:07:40.8
6.79 2.72
0.39 0.01
1.69 0.68
9.8
40
22:13:18.4
-22:10:20.5
6.75 2.63
0.21 0.00
1.68 0.66
8.9
(2-10 keV)
2
22:13:23.2
-22:07:24.3
58.91 7.97
2.22 0.02
7.19 0.97
3
22:12:57.4
-22:21:34.7
58.48 9.44
14.46 0.04
7.13 1.15
4
22:13:13.0
-22:04:25.4
43.04 7.04
2.93 0.02
5.25 0.86
40
22:13:18.4
-22:10:20.6
36.33 6.13
1.46 0.01
4.43 0.75
5
22:12:49.1
-22:11:32.8
30.31 5.95
2.65 0.02
3.70 0.73
12
22:13:33.1
-22:10:03.1
15.04 4.35
2.75 0.02
1.83 0.53
23
22:12:54.6
-22:08:00.9
14.51 4.08
1.23 0.01
1.77 0.50
6
22:12:57.4
-22:21:34.7
12.70 3.89
1.78 0.01
1.55 0.47
Table A - 4: list of point sources detected between 0.5-2 keV and 2-10 keV
in the 3C273 field – ACIS-S3 central chip
3C273 Field (S3)
row
raa (2000)
deca (2000)
Net Counts
Bgd Counts
Flux
10-15cgs
(′)
(0.5-2 keV)
1b
12:29:07.0
+02:03:07.9
1095 109
402 0.22
1336 12.9
1.1
2
12:28:59.5
+02:10:50.9
119.71 11.84
7.64 0.03
14.60 1.44
7.1
3
12:29:15.4
+02:05:29.5
99.75 10.35
4.12 0.02
12.17 1.26
3.4
4
12:29:07.2
+02:04:00.8
31.52 6.32
9.05 0.03
3.85 0.77
0.9
5
12:29:08.5
+02:05:53.9
30.10 5.72
2.25 0.02
3.67 0.70
2.4
6
12:29:14.5
+02:01:21.2
18.06 4.75
3.59 0.02
2.20 0.58
3.8
7
12:28:59.3
+02:05:28.3
17.57 4.60
3.49 0.02
2.14 0.56
1.9
8
12:29:02.2
+02:05:24.9
16.53 4.46
3.42 0.02
2.02 0.54
1.6
9
12:28:52.2
+02:05:13.2
16.49 4.47
2.92 0.02
2.01 0.55
3.1
10
12:29:11.1
+02:05:31.0
15.29 4.30
2.92 0.02
1.87 0.52
2.5
11
12:28:52.2
+02:05:13.2
14.11 4.24
2.70 0.02
1.72 0.52
5.2
12
12:29:17.4
+02:08:31.6
11.81 4.15
3.99 0.02
1.44 0.51
5.9
13
12:29:18.0
+02:06:10.8
9.93 3.62
2.51 0.02
1.21 0.44
4.3
(2-10 keV)
1b
12:29:07.5
+02:03:08.1
4299 68.1
251 0.17
4084 63.4
4
12:29:07.3
+02:04:01.7
60.18 8.88
20.01 0.05
57.17 8.44
3
12:29:15.4
+02:05:30.0
35.04 6.35
3.98 0.02
33.28 6.03
-
12:29:11.7
+02:03:13.3
26.98 6.30
12.24 0.04
25.63 5.98
2
12:28:58.6
+02:10:53.1
10.55 3.95
3.37 0.02
10.02 3.75
a Position uncertainties are estimated to be within 2”
b Source (3C273) affected by pile-up, so values should be regarded as only indicative.