Maximum Disk Mass Models for Spiral Galaxies
Abstract
We present axisymmetric maximum disk mass models for a sample of 74 spiral galaxies taken from the southern sky Fabry-Perot Tully-Fisher survey (Schommer et al. 1993). The sample contains galaxies spanning a large range of morphologies and having rotation widths from 180 to 680 . For each galaxy we have an -band image and a two dimensional H velocity field. We decompose the disk and bulge by fitting models directly to the -band image. This method utilizes both the distinct surface brightness profiles and shapes of the projected disk and bulge in the galaxy images. The luminosity profiles and rotation curves are derived using consistent centers, position angles, and inclinations derived from the photometry and velocity maps. The distribution of mass is modeled as a sum of disk and bulge components with distinct, constant mass-to-light ratios. No dark matter halo is included in the fits.
The models reproduce the overall structure of the rotation curves in the majority of galaxies, providing good fits to galaxies which exhibit pronounced structural differences in their surface brightness profiles. 75% of galaxies for which the rotation curve is measured to R23.5 or beyond are well fit by a mass-traces-light model for the entire region within R23.5. The models for about 20% of the galaxies do not fit well; the failure of most of these models is traced directly to non-axisymmetric structures, primarily bars but also strong spiral arms. The median -band M/L of the disk plus bulge is in solar units, consistent with normal stellar populations. These results require either that the mass of dark matter within the optical disk of spiral galaxies is small, or that its distribution is very precisely coupled to the distribution of luminous matter.
Accepted to the Astronomical Journal
1 Introduction
Extended H I rotation curves provide deeply compelling evidence for a dark matter component that dominates the total mass of spiral galaxies. However, the fraction of luminous to dark matter (L/D) within the optical disk (within the 25 mag/arcsec2 -band, 23.5 mag/arcsec2 -band isophote) is very poorly known. Typically, extended rotation curves have no distinct features which might reflect the end of the luminous disk (Bahcall & Casertano 1985). As a consequence, they provide virtually no constraint on L/D within the optical disk. Mass models in which the dark component dominates the inner mass distribution generally fit the rotation curves within the optical disk as well as models with a negligible dark component (van Albada & Sancisi 1986, Lake & Feinswog 1989).
The mass and luminosity of spiral galaxies are, however, very strongly connected. Spiral galaxies exhibit a very tight, one parameter relation between rotational velocity and luminosity, the Tully-Fisher (TF) relation (Tully & Fisher 1977, see Jacoby et al. 1992 for a review). The total mass-to-light ratio (M/L) within the optical disk is remarkably uniform among all spirals (Rubin 1985, Roberts & Haynes 1994) including low surface brightness spirals (Sprayberry et al. 1995). Indeed, the typical value of M/L (we derive here (M/L)I = 2.40.9) is consistent with that expected from normal stellar populations (Larson & Tinsley 1978, Bruzual & Charlot 1993, Worthey 1994), with no dark matter. Optical rotation curves are not, in general, flat and featureless. They span a range of shapes from linearly rising to falling with radius (Rubin 1985) and also display smaller scale “bumps and wiggles” (Freeman 1992). Mass models fitted to rotation curves within the optical disk rarely require dark matter halos to yield good fits (Kalnajs 1983, Kent 1986, Buchhorn 1992). These models generally reproduce the large scale features and sometimes reproduce the smaller scale “bumps and wiggles” in the optical rotation curves.
Dynamical arguments suggest that the inner regions of spirals cannot be dominated by dark matter. Within the optical radius, a dark matter halo with an average projected surface mass density greater than that of the disk would act to suppress common instabilities such as bars and 2-arm spiral structure (Athanassoula et al. 1987). The existence of lopsided modes, which appear in many disk galaxies (Rix & Zaritsky 1995), may require even lower halo mass densities. A bulge or thick disk also act to stabilize the disk, further lowering the allowed dark matter density. It is possible to contsruct a model disk galaxy with an almost flat rotation curve which is stable with no dark matter (Sellwood & Evans 2000). This reverses the disk-stability argument Ostriker & Peebles (1973), which is often used to support the need for a massive dark matter halo within the optical radius. Of course, spherical halo mass outside the optical radius has no effect on disk stability. A stellar bar would also interact with a massive halo through dynamical friction. For large dark matter densities this interaction acts to rapidly slow the pattern rotation speed of the bar (Weinberg 1985, Debattista & Sellwood 2000) far below that expected in real galaxies (Sellwood & Wilkinson 1993), or measured in any galaxy (Merrifield & Kuijken 1995, Gerssen, Kuijken & Merrifield 1999)
Simulations of galaxy formation through dissipationless collapse of matter yield strongly triaxial halos (Dubinski & Carlberg 1991, Warren et al. 1992) , which produce non–axisymmetric disks if the halo dominates the inner mass density. Adding a dissipational gaseous component to these simulations leads to rounder, but still triaxial halos (Katz & Gunn 1991, Dubinski 1994). The intrinsic ellipticity and non–circular motions of these disks would produce large scatter in the TF relation (Franx & de Zeeuw 1992) which is not observed. This limits either the halo triaxiality to less than that predicted by any of the formation models, or the mass of dark matter within the optical disk. The shapes of the gravitational potentials of dark matter halos for two galaxies have been determined through dynamical models of a polar ring (Sackett et al. 1994) and the flaring of H I gas (Olling 1996). Both of these studies suggest that halos have very flat mass distributions, with axis ratios between 0.1 and 0.3, and thus resemble a disk more closely than a sphere.
The various evidence discussed above strongly suggest that the luminous component contains a dynamically significant fraction () of the mass in the inner regions of spiral galaxies. However, most rotation curves (see Casertano & van Gorkom 1991) for two possible counter examples) show no significant change in the transition between this inner region and the outer, dark matter dominated region. The disk and halo must somehow conspire to hide this transition (van Albada & Sancisi 1986). Moreover, because of the low scatter in the TF relation and in M/Ls, the disk-halo conspiracy must act consistently among all spiral galaxies to couple tightly the evolutionary history and the present structure of luminous disks and dark halos. This is extremely surprising, because after the initial collapse the evolution of the halo and disk proceed on different scales and through different and complex physical processes which are linked only through a weak gravitational coupling.
All of the above considerations led van Albada and Sancisi (1986) to advance the maximum disk hypothesis. Under this hypothesis, the mass of the luminous disk in a spiral galaxy is assumed to be as large as possible, consistent with the galaxy’s rotation curve. The mass contribution of the dark matter halo is therefore assumed negligible in the inner parts of spirals.
A maximal disk does not eliminate the disk-halo conspiracy, in a sense, it makes it more puzzling because it minimizes the overlap in the distribution of dark and luminous matter. However, it does make the tight correlation between mass and luminosity in the inner parts of spirals more plausible.
Not all lines of evidence support the maximum disk hypothesis. Kuijken & Gilmore (1991) quote a local Galactic surface mass density, derived from the velocity dispersion of K dwarfs, which is 30% higher than that of “identified” matter. Cosmological N-body simulations of hierarchical universes yield halos which are not well approximated by isothermal spheres with cores (Dubinski & Carlberg 1991, Warren et al. 1992, Navarro et al. 1996). The mass density profiles of these simulated halos have slowly changing logarithmic slopes and continue to rise all the way into the centers. The central mass concentration of these simulated halos would seem to be inconsistent with a maximum disk.
In this work we model the luminous mass distribution for a sample of 74 spiral galaxies. Our aim is to test the maximum disk hypothesis by analyzing how well features in the rotation curve are reproduced by the mass models. We therefore do not include a dark halo in the fits, but rather evaluate the quality of the fits under the strict maximum disk hypothesis. We extract surface brightness profiles for the disk and bulge from -band images of normal spiral galaxies and derive optical H rotation curves from Fabry-Perot velocity maps with two spatial dimensions. The optical radius is defined as the radius to the extinction corrected 23.5 mag arcsec-2 isophote in . The Fabry-Perot maps provide high signal-to-noise rotation curves, and enable us to average over local kinematic features. We fit axisymmetric mass models to optical rotation curves assuming constant, but distinct, mass-to-light ratios for the disk and bulge. The two dimensional information provided by the photometric images and velocity maps allows us to assess the importance of nonaxisymmetric features. This will be fully explored in a future paper.
2 The data/sample
Our sample consists of 74 field and cluster spirals in the vicinity of the Hydra-Centaurus cluster. For each galaxy in the sample we have an -band image and a two dimensional H velocity map. Sixty–one galaxies are taken from Schommer et al. (1993) (SBWM). The observations and preliminary reductions of the data for these galaxies are described there. Observations and reductions for 13 additional galaxies are presented in this paper. The sample includes galaxies which are members of the clusters: Antlia(6), Hydra(12), Centaurus(16), and Klemola 27 (5) (see Table 1).
-band CCD images were taken on March 15, 1994 with the CTIO 0.9m telescope at the Cassegrain focus. The detector was a TEK 1024 with a scale of 0.39″/pixel. The exposure time for each image was 10 minutes. Typical seeing was 1.5″. The images were bias subtracted and flatfielded with twilight skyflats using IRAF111IRAF is distributed by NOAO, which is operated by AURA Inc., under contract to the NSF.. A large fraction of the SBWM images were taken with a TI 800800 CCD which had large, 1.5%, flatfield errors. The errors were large scale and primarily near the edges of the field which made precise sky estimation difficult and created significant distortions at low surface brightness. An illumination correction was constructed for the TI images by combining all 40 -band images from the run. For each image the galaxy and stars were removed and the remaining pixels were scaled by the sky level. The resultant image was smoothed over a scale of 20 pixels. The corrected images are flat to 0.2%.
All the images were calibrated using Graham standards (Graham 1982). The instrumental magnitudes of the standards were determined using DAOPHOT II (Stetson 1987). DAOPHOT was also used to automatically locate cosmic rays and stars in the galaxy images. Stars and cosmic rays were distinguished using the DAOPHOT sharpness parameter. The cosmic rays were removed by replacing affected pixels with the biweight of surrounding pixels (the biweight is an robust estimate of the mode of a distribution which is optimized for small samples (see Beers et al. 1990). The stars were removed by flagging pixels in a circular aperture centered on each star.
H spectroscopy for each galaxy was obtained in April 1993 with the CTIO 1.5m telescope and the Rutgers Fabry-Perot imaging spectrophotometer. A TEK 512 CCD with a 1.09″/pixel scale was used. The observations for each galaxy consist of 8 to 15 images with a 110 FWHM bandpass (2.4 Å at H), spaced at 1 Å intervals to sample the H emission line. Wavelengths were calibrated during the day. Calibration drifts during the night were monitored by taking exposures of a neon lamp every hour. The maximum drift rate was 0.1 Å/hr. The images were bias subtracted and flatfielded, with dome flats taken near the wavelength of each image, using IRAF. Typical seeing was 1.5″.
Transparency and instrumental throughput variations were measured by performing photometry on stars common to all the images for each galaxy using DAOPHOT. Cosmic rays were removed using the procedure described above. The images were convolved with a Gaussian to compensate for variations in seeing. The stellar positions were used to establish transformations and the images were shifted to a common coordinate system. The sky in each frame was determined in an annulus centered on the galaxy. There was generally no observable wavelength dependent structure in the the sky over the small 6 Å gradient across Fabry-Perot field of view at the observed wavelengths. The series of images yields, at each pixel, a short segment of the spectrum around H. The spectra have been fitted with Voigt profiles (Humliček 1979) to yield maps of the velocity, velocity dispersion, H intensity, continuum intensity, and their respective uncertainties. The kinematic data extends to a median of 4 disk scale lengths or 1.1 R23.5 in . We used stars in each of the images to find relative astrometric corrections between the photometric and kinematic images.
3 Spiral Galaxy Models
We derive axisymmetric mass models of spiral galaxies assuming that the radial mass distribution follows the radial luminosity distribution with constant M/L. The assumption of constant M/L requires that extinction and population gradients be small across the luminous disk, which may not be an adequate representation of real galaxies. de Jong (1995) finds significant color gradients in the profiles of a large sample of spiral galaxies. His analysis attributes these gradients primarily to changes in stellar populations, with younger, more metal poor stars at large radii. This would tend to lower the stellar M/L at large radii and, therefore, decrease the radius at which the “missing mass” becomes important. de Jong’s models predict that (M/L)I can change by a factor of 1.5 from the inner to outer parts of spirals. However, his models predict a scatter of 1.5 mag in the -band Tully-Fisher and a smaller scatter in color bands redder than . Neither of these predictions are in agreement with observations. The large scatter is not observed and an analysis of the TF relation shows larger scatter both at visible color bands (Bothun & Mould 1987) and in the near infra-red (Bernstein et al. 1994) than at . These issues clearly need to be resolved, but in the absence of specific predictions for variable M/L we adopt a constant M/L for our models.
We assume that luminous parts of spiral galaxies are composed of two principal components: a flat disk and a rounder bulge. Each component is characterized by a distinct spatial and kinematic stellar distribution, and stellar population. In addition, the disk harbors the cold gas. Our models are based on a two component, disk and bulge, photometric decomposition. To derive the mass distribution we assume that each component has a separate, constant M/L. In real galaxies, the disk and bulge can be further divided into subcomponents such as the thin and thick disk, and nucleus; these are not considered here. The thick and thin disks in external galaxies have been distinguished only in edge-on projections (Burstein 1979) and the nuclei are not resolved in our data.
Spiral galaxies are approximately axisymmetric; the axisymmetry is broken by bars and spiral structure. Our models assume strict axisymmetry. The surface brightness profiles and the rotation curves for each galaxy are derived with a fixed and consistent center, position angle and inclination which we derive from both the photometry and the kinematic data. The difference in the projected disk and bulge axis ratios is taken into account in the disk-bulge decomposition. In this analysis there is no radial dependence of the geometric parameters. Such a dependence is often implicit in isophotal or kinematic tilted-ring analysis.
Our goal is to examine how well maximum disk models reproduce the mass distribution in a large and diverse sample of spiral galaxies. Individual models with halos could be constructed but would be poorly constrained by our data.
In sections 3.1 and 3.2 we present our photometric and kinematic models. The 2-D nature of our data set allows us to derive independent geometric parameters from both the photometric images and the kinematic maps (SBWM). In section 3.3 we combine these results to derive a luminosity distribution and rotation curve with consistent geometric parameters. In section 4.3 we present the mass models.
3.1 Photometric Models
The goal of the photometric models is to separate the disk and bulge and deduce their radial luminosity distributions. The two primary features we use to distinguish the disk from the bulge in an image are the difference in the radial surface brightness profile and the axis ratio of the isophotes.
The surface brightness profiles of most spiral galaxies are exponential over some fraction of the disk (Freeman 1970). Approximately 40% of spirals, however, deviate strongly from purely exponential disks. These spirals, designated as type II by Freeman, have profiles that are flat or slowly rising toward the center and have a steeper exponential outer profile. The profiles of type I galaxies more closely follow the canonical exponential disk. The profiles of disk galaxies often also exhibit smaller scale deviations. In order to model fully the radial structure of the disk these features must be included. We use an exponential component for the disk in our disk-bulge decomposition, but the final model for the disk is taken as the radially binned surface brightness profile of the galaxy after subtracting the bulge model.
The bulges of spiral galaxies are three-dimensional structures. This leads to the difference in axis ratios of the disk and bulge isophotes in the projected image of an inclined spiral. The isophotes of the bulge are typically not circular, and thus bulges are typically not spherical.
3.1.1 Disk-Bulge Decomposition
There have been two strategies for performing disk-bulge decompositions. One has been to first perform an isophotal analysis; the resulting radial luminosity profile is fitted with an exponential disk and a bulge model (Schombert & Bothun 1987) such as the law (de Vaucouleurs 1948) or Plummer model. The second method, due to Kent (1986), uses the geometric properties of the disk and bulge.
The profiles derived from isophotal fits are functions of up to five variables at each isophote: semi-major axis, ellipticity, position angle and center coordinates. The dependence on the last four variables, while included in the fits, is often not presented. This dependence leads to distortions in the radial luminosity profile which are not in the underlying radial light distribution. The geometric parameters can be distorted locally by bright star forming regions. Unavoidably, the the parameters have a radial dependence that follows a bar and/or spiral arms. The isophotes are not well approximated by ellipses in the region where the surface brightness changes from bulge dominated to disk dominated. An elliptical isophote fitter makes a compromise fit which biases the true radial profile. For example, in a highly inclined galaxy with a compact nearly spherical bulge, the surface brightness of the bulge projects to large galactic radii along the minor axis. An elliptical isophote fitter will produce a profile in which the bulge seems to extend to larger radii. This will bias bulge models such as the or Plummer model which have strong tails. Byun & Freeman (1995) present a systematic study of these effects in model galaxies.
The method of disk-bulge decomposition developed by Kent uses the different radial scaling properties of the disk and bulge profiles along the major and minor axes. The method relies on the different axis ratios of disk and bulge isophotes and the assumption of axial symmetry. The disadvantage of this method is that it uses information only near the major and minor axis and is, therefore, sensitive to non-axisymmetric structure in these regions.
Our method combines the best properties of these two methods by using the full two-dimensional information in the galaxy image. We fit two-components, a disk and a bulge model, to the image of the galaxy. We assume that the underlying distribution of light in spiral galaxies is axisymmetric, with a thin disk and an oblate spheroidal bulge with constant axis ratio. Under this assumption the projected isophotes of the model disk are ellipses with constant axis ratio, position angle and center. The projected isophotes of the model bulge are ellipses with the same position angle and center as the disk but a different, larger, axis ratio. We exploit the exponential form of the disk but do not constrain ourselves to a more specific functional form for the bulge. For the bulge we use a series expansion of Gaussians (Bendinelli 1991) which we have generalized to model oblate distributions. At large radii the surface brightness of this bulge model is always negligible compared to the disk.
The disk and bulge are separated in three steps: (1) an exponential disk model is fitted to and subtracted from the image, (2) the bulge model is fitted to the resultant image, and (3) the bulge model is subtracted from the original image leaving an image of the disk. The exponential disk of step 1 is fitted in a region well away from the bulge and extrapolated into the central bulge dominated region. The extrapolation is carried out in different ways for type I and type II disks (see below). The purpose of fitting the exponential disk model is to derive a global inclination, position angle, and scale length and to provide a reasonable extrapolation of the disk into the central bulge dominated region for the purpose of isolating the bulge light.
For type I disks the galaxy image is divided into two regions; the disk dominated region and the central bulge dominated region. The disk dominated region is defined as an elliptical annulus centered on the galaxy: the inner edge of this annulus has axis ratio of the bulge isophotes and the outer edge has the axis ratio of the disk isophotes. The semi-major axis of the inner edge of the annulus is set sufficiently far from the center that the bulge is negligible compared to the exponential disk. The bulge dominated region is defined as an elliptical disk centered on the galaxy with the axis ratio of the bulge isophotes. The semi-major axis of each division is determined from a plot of the surface brightness binned in elliptical annuli with the approximate axis ratio of the disk. We fit a projected exponential disk to the image of the galaxy in the disk dominated region:
| (1) |
where is central surface brightness, is the disk scale length, and is the length of the semi-major axis of a ellipse of constant surface brightness for the disk. In general
| (2) |
where is defined in terms of the axis ratio, , is the distance from the galaxy center as measured on the sky and is the position angle of the major axis. For a flat disk the inclination is given by .
The exponential disk is subtracted from the galaxy image and a bulge model is fitted in the bulge dominated region. The bulge model is a series of Gaussians:
| (3) |
where is the total light in each component, is the scale length of the Gaussian component and is the length of the semi-major axis of an ellipse of constant surface brightness for the bulge. Each Gaussian has a common center and axis ratio. The position angle is fixed at the value derived for the disk, as required by the assumption of axisymmetry. Bulges are fitted with between 1 and 6 Gaussian components. We use the maximum number of components that gives a unique and stable fit. If we add additional components we find either that: multiple components converge to the same scale length, with each of these components contributing a fraction of the intensity, or that the scale length of an additional component diverges and the intensity is reduced to the point that the component contributes a negligible constant offset. We have found that many of the standard fitting laws for the bulges of spiral galaxies such as de Vaucouleurs or Plummer models are inadequate representations of real bulge images. The bulge model is subtracted from the original galaxy image, and the residual image is binned in elliptical annuli to arrive at the final disk model. To avoid truncation features and to integrate total magnitudes we extrapolate the disk model to large radii using the parameters of the exponential disk.
For type II galaxies we divide the galaxy into 3 regions: the outer disk region, the inner disk region and the central bulge region. We fit an exponential disk in the outer region to derive the ellipticity and position angle. We then fit an exponential disk in the inner disk region with its own intensity and scale length, but with the ellipticity and position angle fixed at the value derived from the outer disk. Because the surface brightness is nearly constant in this region, the shapes of the isophotes are not well defined and the light distribution contains no information about the position angle or inclination of the galaxy. We subtract the inner disk model from the image and the bulge model is fitted in the central region as described above. The bulge model is subtracted from the original galaxy image and the residual image is binned in elliptical annuli to arrive at the final disk model. The disk model is extrapolated to large radii using the parameter of the exponential disk derived in the outer region.
The disk-bulge decomposition is not generally iterated, except to adjust the border of division between the disk and bulge regions. The disk model near the center is a reasonable, but arbitrary, extrapolation. Attempts to make small improvements in the solution through iteration depend on the details of the assumed disk extrapolation. The advantages of our method are that it does not start with built–in biases of the isophotal surface brightness profile, and it sets additional, geometric, constraints on the disk–bulge decomposition and therefore exploits the available 2-D information.
3.1.2 3-D luminosity distribution
The three dimensional luminosity distribution of the disk is trivially related to the projected distribution. Assuming no internal extinction , where r is the distance from the center of the galaxy and is the Dirac delta function. The surface brightness decreases by a factor of in the deprojection.
Under our assumptions the two-dimensional elliptical bulge surface brightness distribution can be uniquely de-projected to the three-dimensional spheroidal luminosity distribution via Abel’s integral equations (Stark 1977). A two-dimensional elliptical Gaussian distribution de-projects to a three-dimensional spheroidal Gaussian distribution.
| (4) |
where is the deprojected semi-major axis of the spheroid,
| (5) |
The ellipticity of the spheroid,
| (6) |
follows directly from the galaxy inclination and the axis ratio of the bulge projected on the sky.
3.1.3 Photometric Corrections
The luminosity profiles are corrected for internal extinction, , and Galactic extinction, . Corrections for internal extinction by dust generally give the total fraction of light absorbed within the galaxy. The surface brightnesses of galaxies in this sample are derived by assuming the extinction is uniform over the luminous disk. The problem is, however, considerably more complex. The actual distribution of dust in galaxies is not well known and scattering may be as important as absorption in the I-band. Furthermore, multi-color photometry of spiral galaxies by de Jong (1995) suggests that radial color gradients may be due primarily to population gradients.
We adopt given by Giovanelli et al. (1994). Similar results are found by Han (1992), Bernstein et al. (1994), and Willick et al. (1995). Galactic extinction, in the -band, is taken from Burstein & Heiles (1978). Reddening between and is assumed to be E(B-I)=0.45. The median value of Galactic extinction for this sample is 0.12 mag.
3.2 Kinematic Models
We derive rotation curves from two-dimensional Fabry-Perot H radial velocity fields. We assume that the H-emitting gas is in an axisymmetric rotating thin disk. In polar coordinates the model, projected on the sky, is given by
| (7) |
where is the inclination, is the position angle of the projected major axis, is the circular velocity profile and is the systemic velocity. The disk center is an implicit pair of parameters in the model. The term in brackets is equal to the cosine of azimuthal angle in the plane of the galaxy measured from the major axis.
The parameters of the kinematic model are derived by fitting to the 2-D data in concentric elliptical annuli using a Levenburg-Marquardt minimization technique (Press et al. 1992). The covariance matrix at the minimum is used to estimate the errors in the parameters. The errors in the kinematic center are generally larger that those of the photometric center. The primary reason for this is that the kinematic center is poorly constrained along the minor axis and couples to the systemic velocity along the major axis. The center was therefore fixed by the centroid of the continuum distribution. In each annulus we fitted , and . The global kinematic position angle and inclination are the average, weighted by the estimated errors, of these parameters from each ellipsoid. The final rotation curve is extracted with all of the geometric parameters fixed. The rotation velocity is estimated independently on each side of the minor axis.
3.3 Geometric Parameters
The photometric and kinematic models yield independent estimates of the major axis position angle and the inclination. We merge these results and rederive the models using consistent parameters.
The position angle is generally better constrained by the kinematic models. A distinct line of nodes delineates the position angle in the velocity map, while the photometric position angle depends on the average distribution of luminosity around an annulus. The photometric position angle is therefore more easily biased by global non-axisymmetric features such as spiral arms.
The inclination, however is more poorly constrained by the kinematic model for many galaxies. For rising rotation curves the slope of the rotation curve and the inclination are degenerate parameters. In the extreme case of a rigid rotator the degeneracy between the rotation profile and inclination is complete and there is no independent kinematic information on the inclination. SBWM found some galaxies with large deviations between the photometric and kinematic inclinations. The deviations are primarily for galaxies with rising rotation curves.
We therefore determine the position angle from the kinematic model and the inclination from the photometric model. The models are then iterated with the position angle fixed in the photometric model and the inclination fixed in the kinematic model. The final values of the geometric parameters are fixed and used consistently in both the photometric and kinematic models. The values are tabulated in Table 1.
3.4 Galaxy parameters
In Table 1 we list the photometric and kinematic parameters for galaxies in the sample. After fixing the geometric parameters of the models, we derive values of the central surface brightness () and scale length () for the disk. Dust extinction and projection effects are included in the models. We quote in the outer parts of the disk. For Freeman type II galaxies, therefore, the central surface brightness and scale length are not directly related quantities. The radius of the 23.5 mag arcsec-2 isophote (R23.5) is measured directly from the photometric profiles and, therefore, is also corrected for dust extinction (assuming the dust acts uniformly over the disk) and projection effects. The magnitudes for each galaxy are derived by integrating the disk profile and adding the total bulge luminosity. We quote total magnitudes integrated to infinity. We calculate the ratio of the total luminosity bulge to that of the disk (B/D).
We define the velocity width, used in the Tully-Fisher relation, to be twice the rotation speed, measured by a weighted average of the rotation curve points where the rotation curve becomes flat. For rotation curves which are still rising we define the width to be twice the maximum rotation speed.
3.5 Mass Models
We assume that the mass distribution of a spiral galaxy follows the de-projected luminosity distribution with constant M/Ls for each component. For the disk, we use a Fourier transform method for computing the rotation curve of a flat axisymmetric mass distribution given by Kalnajs (1965):
| (8) |
where and
| (9) |
| (10) |
where is the Gamma function and .
For a spheroidal mass distribution the rotation curve in the symmetry plane is given by Binney & Tremaine (1987).
| (11) |
For a Gaussian distribution this integral reduces to a degenerate hypergeometric series in two variables.
No dark halo is included. We also do not include a gas component. H I may contribute approximately 10% of the mass within the optical radius of late type spirals (Broeils & van Woerden 1994) and thus further lower the allowed mass of the luminous component. H I gas disks in spiral galaxies have longer scale lengths than the stellar disks and therefore contribute to the mass distribution primarily at larger radii where the rotation velocity due to the stellar disk begins to fall off.
4 Results
The model rotation curves of the bulge and disk are fitted to the kinematic data by adjusting the M/L of each component; the best fit is derived by minimizing . For most galaxies this results in a fit that nowhere significantly exceeds the data. For galaxies which would require a halo to get an acceptable fit we limit the radius of the fit so that the model rotation curve does not exceed the rotation curve data and evaluate the quality of the fit out to this radius.
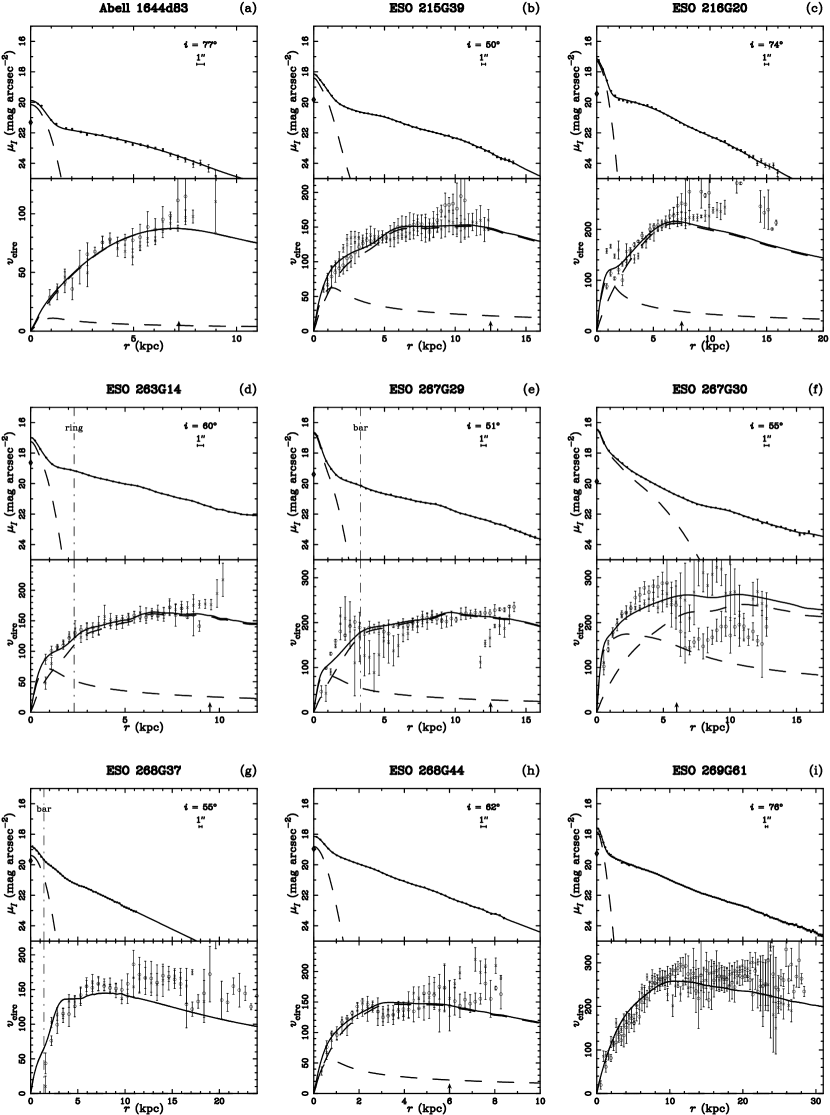
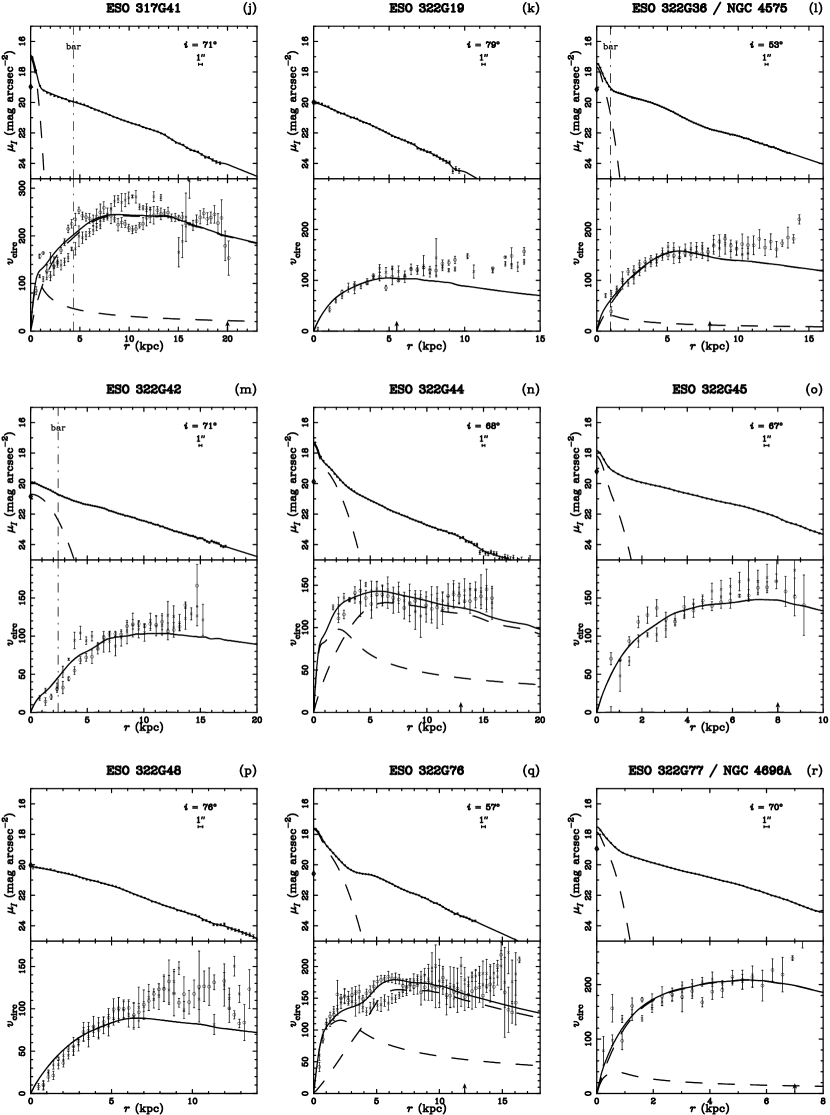
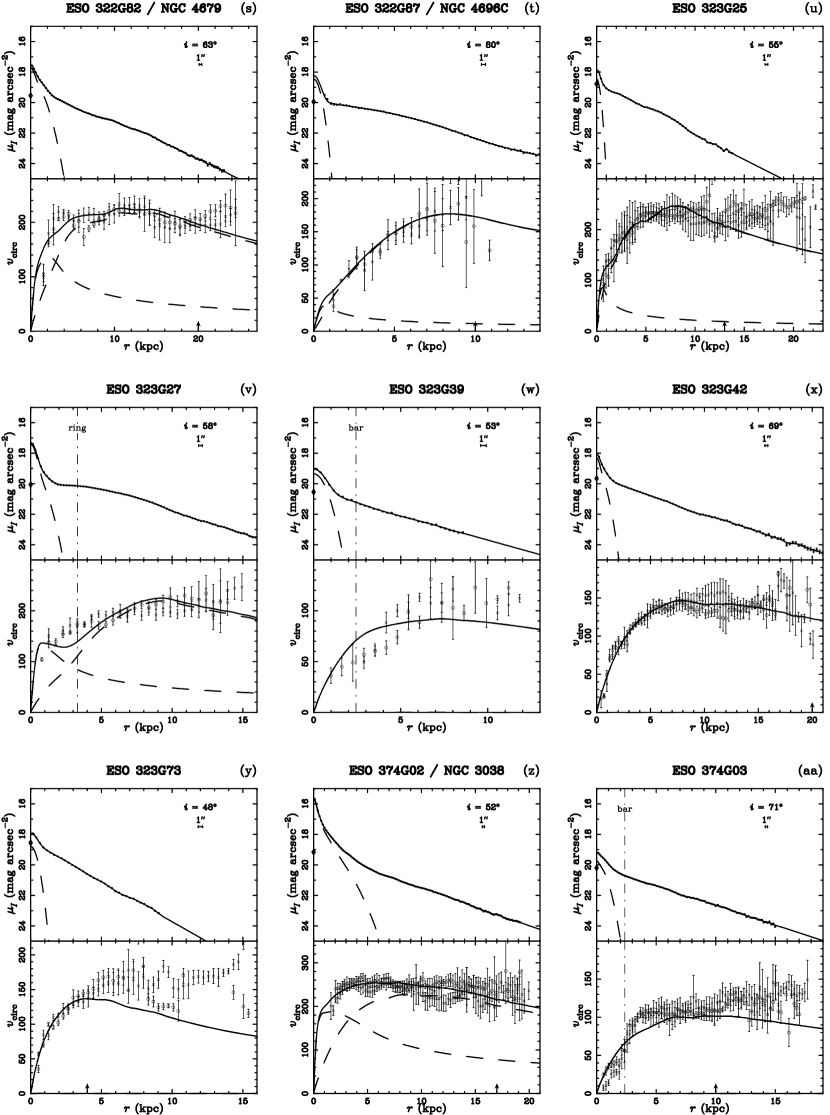
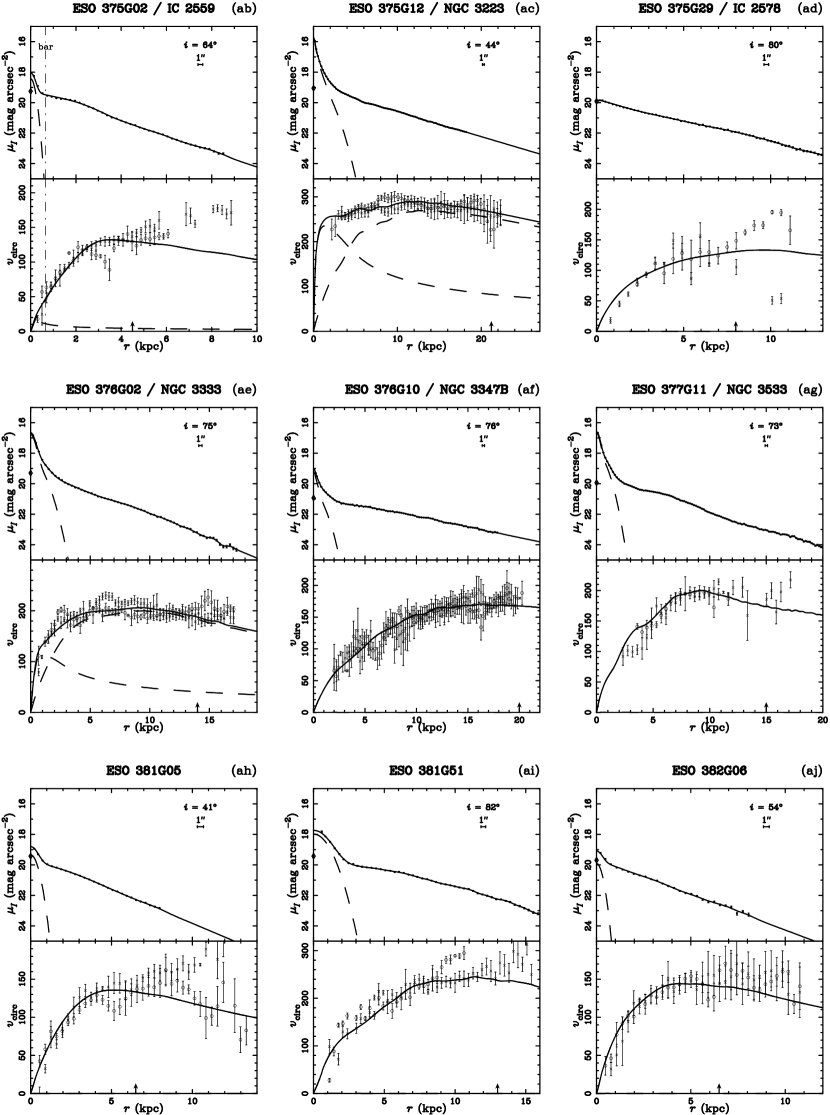
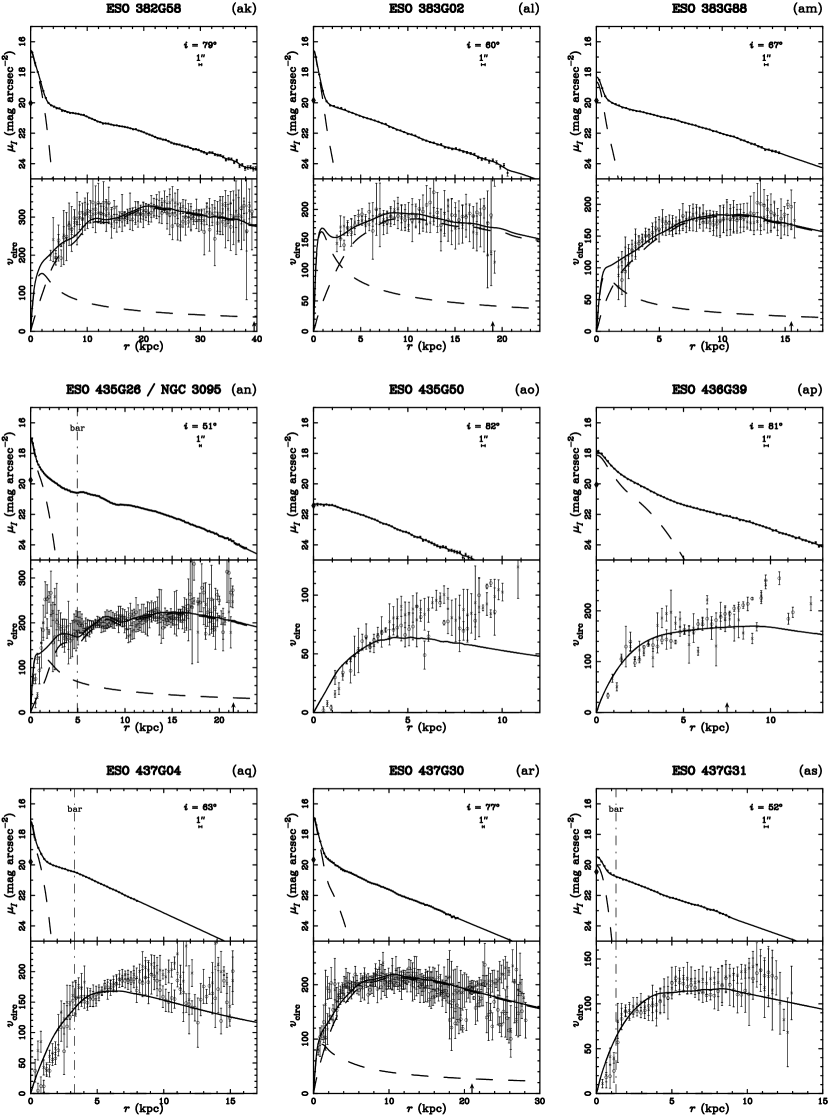
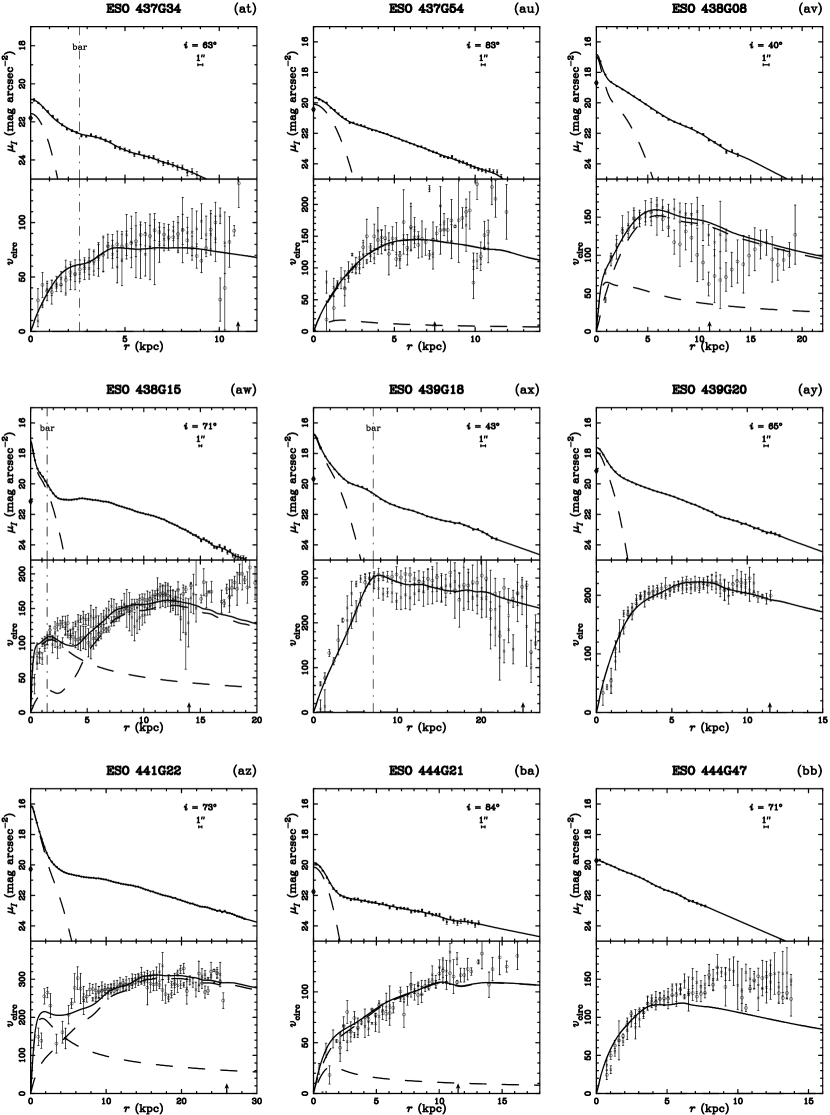
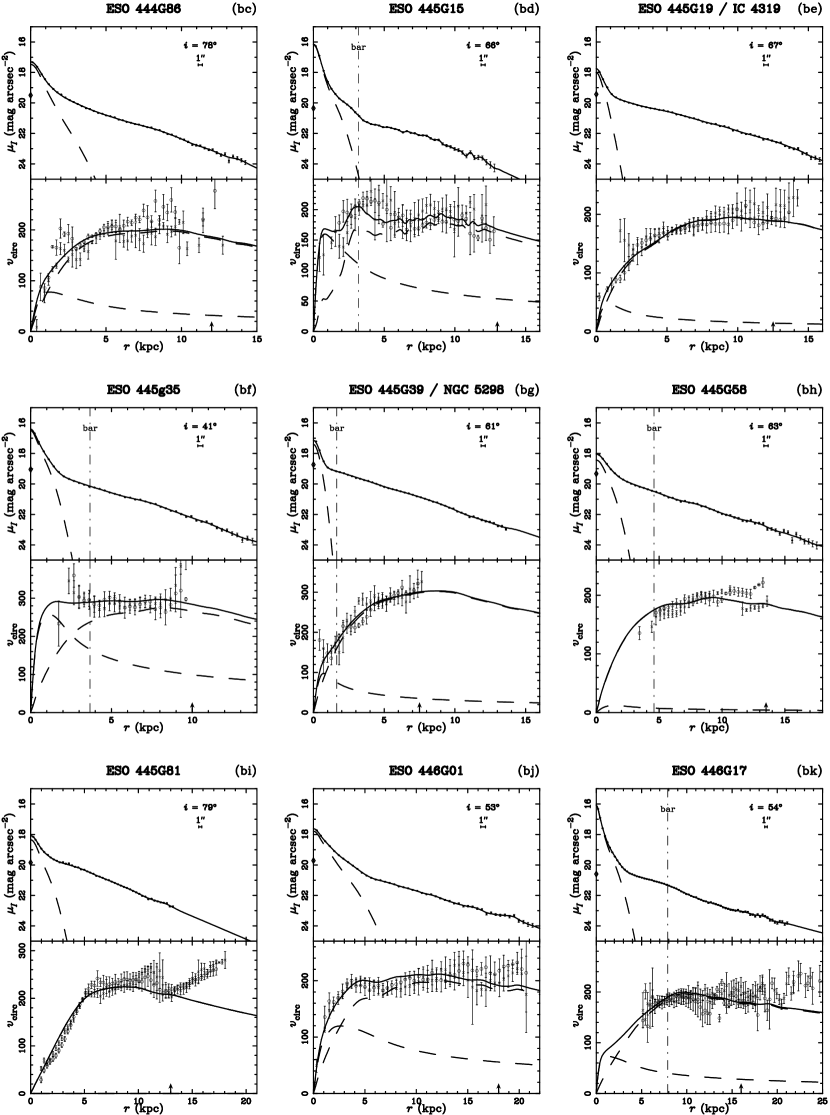
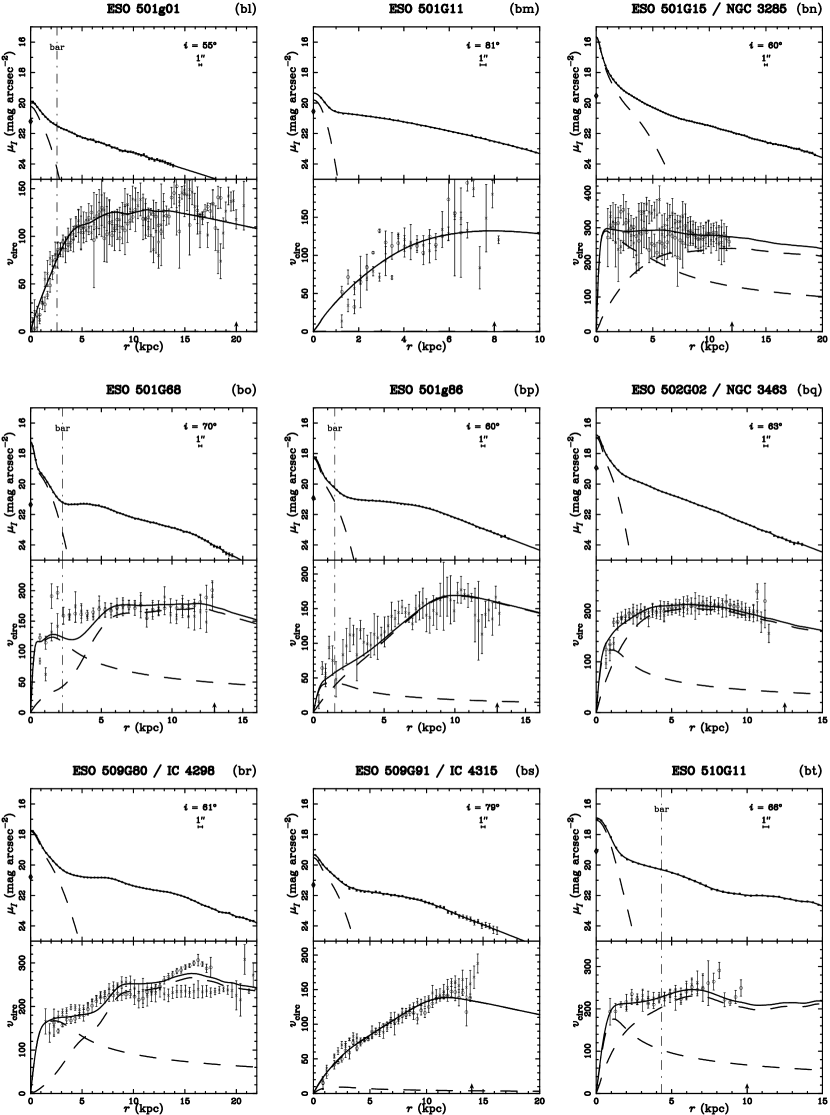
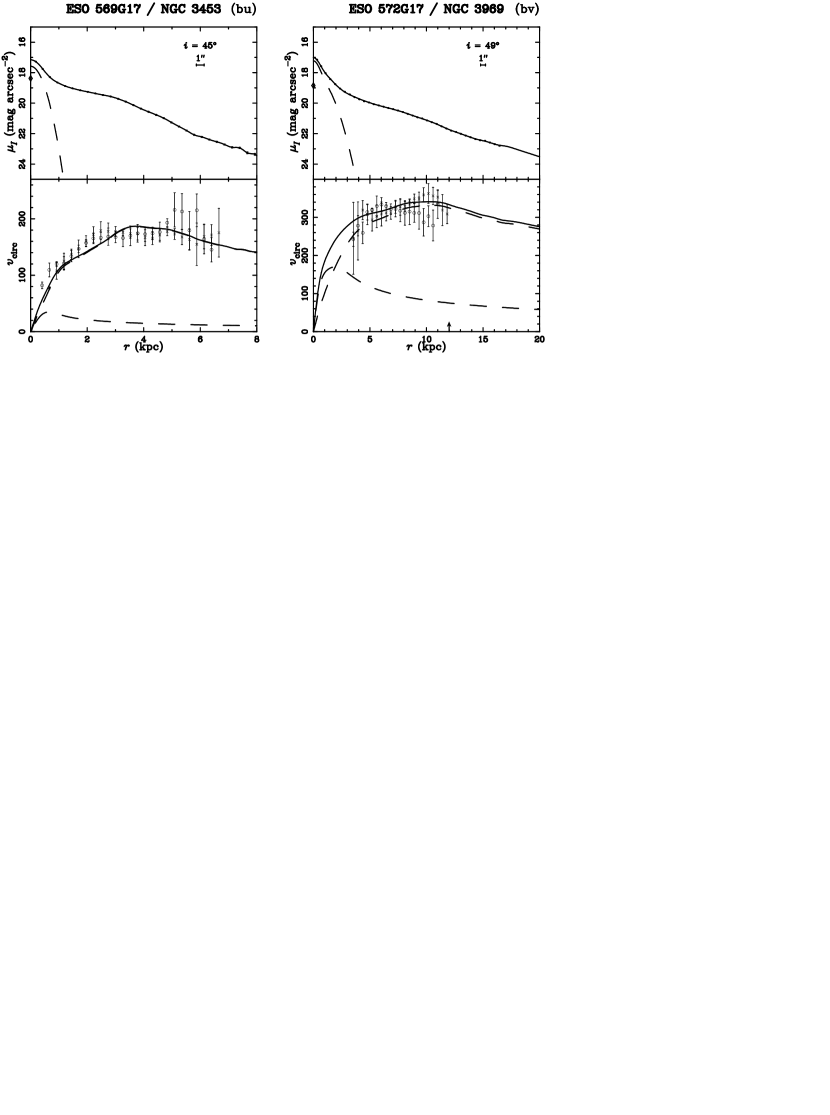
In Fig. 1 we present the models. The upper panel for each galaxy shows the face-on surface brightness profile. The contribution of the bulge is indicated by the dashed lines. The central surface brightness of the disk is marked with a diamond. The lower panel shows the rotation curve and the fitted mass model. The rotation speed for the side receding with respect to the center is marked with crosses and that for the the approaching side is marked with open circles. The rotation curves for the model bulge and disk are traced with dashed lines. The full model rotation curve is equal to the disk and bulge models summed in quadrature and is indicated by an unbroken line. In addition, the radii of prominent features, such as bars or rings, are marked with a vertical dot-dashed line. A scale bar in arcsec and the inclination are given to gauge the effect of seeing.
4.1 Morphology of Surface Brightness Profiles
In addition to the relative brightness of the disk and bulge, the surface brightness profiles of spirals can be classified by the morphology of their disks. Two common assumptions are that spiral galaxies have an exponential disk and that they have a universal constant central surface brightness (Freeman’s Law 1970). The discovery of low surface brightness galaxies (Bothun et al. 1991, Schombert et al. 1992, McGaugh et al. 1995) most clearly indicates that spiral galaxies fail the second assumption. The surface brightness profiles of disks are also not strictly exponential. The most prominent distinction in disk profiles is between Freeman types I and II, described in section 3.1 Galaxy disks also frequently exhibit less extreme deviations from a pure exponential, such as a point of inflection where the scale length changes.
One statement of Freeman’s Law is that the ratio of the optical disk radius to the exponential scale length, R23.5/rd, is a constant. In Fig. 2 we plot R23.5/rd vs. the central surface brightness. The tight correlation for exponential (i.e. type I) disks follows trivially from the definition of the optical radius and the the wide distribution of central surface brightnesses in our sample. More significantly, R23.5/rd correlates with absolute magnitude (Fig. 3). We test the significance of this correlation with the Spearman rank-order correlation coefficient (Press et al. 1992). The correlation coefficient is . The probability that there is no correlation is 0.01. The low luminosity galaxies have lower central surface brightness and relatively flatter surface brightness profiles over the optical disk as indicated by a larger R23.5/rd. This leads to model disk rotation curves which rise more slowly for low luminosity galaxies than those for high luminosity galaxies.
4.2 Morphology of Rotation Curves
Within the optical radius spiral galaxy rotation curves are not generally flat, but span a range of morphologies, from rising linearly to falling with radius (Rubin 1985, Persic & Salucci 1995). These authors also show that the shape of the rotation curves correlate with luminosity; low luminosity, small rotation velocity galaxies have rotation curves that are rising while high luminosity, large rotation velocity galaxies have falling rotation curves.
An examination of the rotation curves in this sample suggests such a trend, but a large range of rotation curve shapes is found at every scale of rotational velocity. At high maximum rotation velocities (300 ): ESO 374G02 (Fig. 1z) is falling, ESO 375G12 (Fig. 1ac) is flat, ESO 269G61 (Fig. 1i) rises over 0.4R23.5 before flattening, and ESO 381G51 (Fig. 1ai) rises over the entire optical radius. At low maximum rotation velocities (100 ): ESO 374G03 (Fig. 1aa) is flat past 0.25R23.5, ESO 322G19 (Fig. 1k) is flat past 0.5R23.5, Abell 1644d83 (Fig. 1a) rises over the entire optical radius. The rotation curve of ESO 441G21 (Fig. 1ba) also rises to about 100 over the optical radius but does so almost linearly.
4.3 Model Fits
In spite of the variety of surface brightness profile and rotation curve morphologies, maximum disk models with constant M/Ls provide good fits to optical rotation curves for a majority of the galaxies in our sample. The overall structure of the rotation curves is reproduced by the models. The models fit the data for rotation curves that are rising linearly or with a curve, that are flat or falling, or that have strong inflection points. The galaxies with good fits span a range of velocity widths (2) from 180 for Abell 1644d83 (Fig. 1a) to 680 for ESO 572G17 (Fig. 1bv). For most of the galaxies no halo is required for the models to fit the data within the optical radius or to the last measured point.
Fig. 4 shows the distribution of the ratio of the maximum radius out to which the mass models provide a good fit to the optical radius; Rfit/R23.5. The histogram is shaded for models which provide a good fit out to the last measured point of the rotation curve. 75% of galaxies for which the rotation curve is measured to R23.5 or beyond are well fit by a mass-traces-light model for the entire region within R23.5. For 21% of the galaxies the models provide poor fits due to strong bars or spiral arms, these cases are assigned Rfit/R23.5= 0 in the histogram. The existence of strong non-axisymmetric structures suggests that there should be less dark matter in these galaxies. These cases are discussed below in section 4.4.
For Freeman type I spiral galaxies, a thin exponential disk mass distribution has a rotation curve which reaches maximum at 2.15 disk scale lengths and falls slowly thereafter, dropping 10% by 3.75 disk scale-lengths. Despite the apparent restriction of this shape, a wide range of optical rotation curve shapes can be successfully modeled because of the variation of the number of disk scale lengths within the optical radius among galaxies and the addition of a bulge component.
Few galaxies have the canonical flat rotation curve across the entire optical disk. ESO 375G12 (Fig. 1ac) and ESO 376G02 (Fig. 1ae) are two examples of galaxies with good fits that do. The optical radii in these galaxies span 4.2 and 3.8 disk scale-lengths, respectively. The model rotation curve for ESO 375G12 begins to fall at the optical radius, but unfortunately, the rotation curve data for ESO 375G12 extend to only 3.3 disk scale lengths. ESO 376G02 shows slight evidence of dark matter, but only near the optical radius. The rotation curve for ESO 374G02 (Fig. 1z) has a gentle linear falloff over most of the optical radius and the model provides an excellent fit over this entire range. The optical radius of ESO 374G02 extends over 4.1 disk scale lengths. These galaxies have prominent bulges. The flatness of the rotation curves is achieved though a combination of the bulge and disk rotation curves.
ESO 383G88 (Fig. 1am) and ESO 323g42 (Fig. 1x) have less prominent bulges. The rotation curves of these galaxies rise less dramatically than those for the flat rotation curves above, but do flatten at larger radii. The optical radius of these spirals extend to 3.2 and 3.7 disk scale-lengths, respectively, and the models reproduce the turnover in the rotation curves.
The optical disks of ESO 376G10 (Fig. 1af) and ESO 501g01 (Fig. 1bl) extend to only 2.0 and 2.2 disk scale-lengths, respectively. These galaxies also have small bulges. The rotation curves reflect this morphology; they rise with a curve over most of the optical disk, reaching maximum near the optical radius. The rotation curve for ESO 501g01 extends significantly past the optical disk to 4.1 scale lengths. The model rotation curve does not fall significantly below the data over this entire range.
Freeman type II disks, which are distinguished by a flat inner surface brightness profile, are modeled with a constant inner mass density. This leads to rotation curves which are linearly rising over the constant density region. The radius of the turnover varies from 20 to 60% of the optical radius for the galaxies in our sample. Examples include: ESO 445G81, 0.22R23.5 (Fig. 1bi); ESO 375G02, 0.23R23.5 (Fig. 1ae); ESO 216G20, 0.31R23.5 (Fig. 1c); ESO 501G86, 0.55R23.5 (Fig. 1bp); and ESO 509G91, 0.62R23.5 (Fig. 1bs). The size of the linearly rising region in the rotation curve varies accordingly.
ESO 381G51 (Fig. 1ai), ESO 435G26 (Fig. 1an), ESO 438G15 (Fig. 1aw) and ESO 501g11 (Fig. 1bm) also have flat surface brightness profiles near their centers; however in these cases the profiles roll off slowly approaching an exponential asymptotically near the edge of the optical disk. The rotation curves in these cases rise slowly, with a curve matched by those of the models. ESO 435G26 has a strong bar and the fit within the bar radius is not good.
4.4 Nonaxisymmetric Structure
A fraction, about 20%, of the fits fail in the inner regions; major structures in the model and/or rotation curve do not match up. These bad fits occur well within the optical disk and are not likely due to a dominant dark matter component. The galaxies which have the poorest fitting mass models often have strong non-axisymmetric structures in the form of bars or strong spiral arm structure. These structures affect both the surface brightness profile and the rotation curve. The strong non-axisymmetric gas motions induced by a bar distort the measured rotation curve within the bar radius as noted for ESO 435G26. Strong spiral structure can affect the shape of the surface brightness profiles and induce large non-axisymmetric motions as well as bias the determination of inclination and major-axis position angle.
ESO 268g37 (Fig. 1g) and ESO 374g03 (Fig. 1aa) both have bars along the major axis and very strong spiral structure. ESO 323g39 (Fig. 1w) has a bar along the minor axis and strong spiral ams. ESO 323g25 (Fig. 1u) has very strong grand design spiral arms. The inclination of this galaxy, combined with the pitch angle and position angle of the spiral arms conspire in such a way that the arms closely follow the ellipticity of the disk from 5 to 10 kpc. The large structure seen in the model at these radii is due to this chance alignment. This effect is also seen in ESO 322g36 (Fig. 1l) and ESO 569G17 (Fig. 1bu) which also have strong spiral structure.
A detailed analysis of the effect of strong non-axisymmetric structures will be presented in future paper. However, if a dark matter halo dominates the mass within the optical radius of these galaxies, it should act to stabilize the disk against these non-axisymmetric modes. It is difficult, therefore, to attribute the poor fit of these models to a large dark-to-luminous mass fraction.
4.5 Small-Scale Structure
Mass models for spiral galaxies sometimes, but not always, reveal a correlation between small scale “bumps and wiggles” in the surface brightness profile and the rotation curve (Kent 1986, Freeman 1992). We find that in the two dimensional maps the residuals in the photometry and the residual kinematic motions are highly correlated. How these structures show up in one dimensional, radial, surface brightness profiles and rotation curves depends strongly on how the data is sampled. The “bumps and wiggles” correlation is therefore most probably due to local perturbations, such as spiral arms and spiral arm streaming motions, rather than the global mass distribution.
4.6 Mass-to-Light ratios
The median -band M/L (disk plus bulge) for our sample of galaxies is in solar units with an rms scatter of 0.9. This accords well with the M/L predicted from stellar population synthesis models. If we exclude the galaxies with the worst fits the median M/L rises to . Worthey (1994) estimates that a normal stellar population which forms in a single burst will have an initial -band M/L of about 1 in solar units and will increase to about 5 over a time of 15 Gyr. His models have an M/L of 2.4 at an age of 6 Gyr, and an M/L of 2.7 at 8 Gyr. Spiral galaxies are composed of stellar populations that span a range of ages and their M/L depends on the number of stars formed in each generation. A typical spiral might be about 10 Gyr old and form most of its stars over the first 4 Gyr.
The theoretical M/Ls are highly dependent on the assumed mass function for the stellar population and the details of the star formation history. Thus the agreement of our M/Ls with theory, although noteworthy, is not in itself overwhelming evidence for the maximum disk hypothesis. The light comes primarily from a small population of bright, high mass stars, while the most of the mass is in a large population of faint, low mass stars.
Current star formation rates vary with Hubble type, with lower rates in early type spirals. M/Ls increase over time as the stellar population fades, and therefore M/Ls should also vary with type, with higher M/Ls in early types. Such a correlation was found by Rubin (1985) and Kent (1986) for M/Ls in the -band. In the -band this correlation is expected to be considerably weaker, and indeed it is not strong in our data (Fig.5). The stellar population models predict a rate of evolution of M/Ls in -band that is a factor of two less than that in -band for a given generation of stars. Also, the scatter in our M/Ls for a given type is large.
The plot of M/L versus axial ratio (Fig. 6) is flat which gives us confidence that the assumed internal extinction law is correct and confirms the work of Han (1992), Giovanelli et al. (1994), Bernstein et al. (1994) and Willick et al. (1995). The good agreement of the values of M/L with the stellar population models also indicate that internal extinction cannot be grossly higher, as claimed by Valentijn (1990).
The scatter in the M/Ls in our sample is 37%. One of the primary sources of error is uncertainty in the distance; measured M/Ls are inversely proportional to the assumed distance. The sample is concentrated in the great attractor region (Dressler et al. 1987), which is dominated by the Hydra-Centaurus supercluster. The clusters are likely to have large peculiar velocities. Galaxies in the vicinity of the Centaurus cluster have a median M/L of and galaxies near Hydra have a median M/L of . The Centaurus cluster is composed of two major sub-clusters (Lucey et al. 1986) and the Hydra cluster is also thought to have substructure (Fitchett & Merritt 1988). The galaxies which are members of these clusters may therefore have especially large peculiar velocities. Fig. 7 gives the distribution of M/Ls for the sample. Smooth Hubble flow is, unfortunately, not a precise approximation for estimating the distances to the galaxies in this sample. The large scale peculiar motions may contribute 25% or more to the error budget (Bothun et al. 1992, Mathewson et al. 1992, da Costa et al. 1996). This can also be seen in the TF relation for this sample.
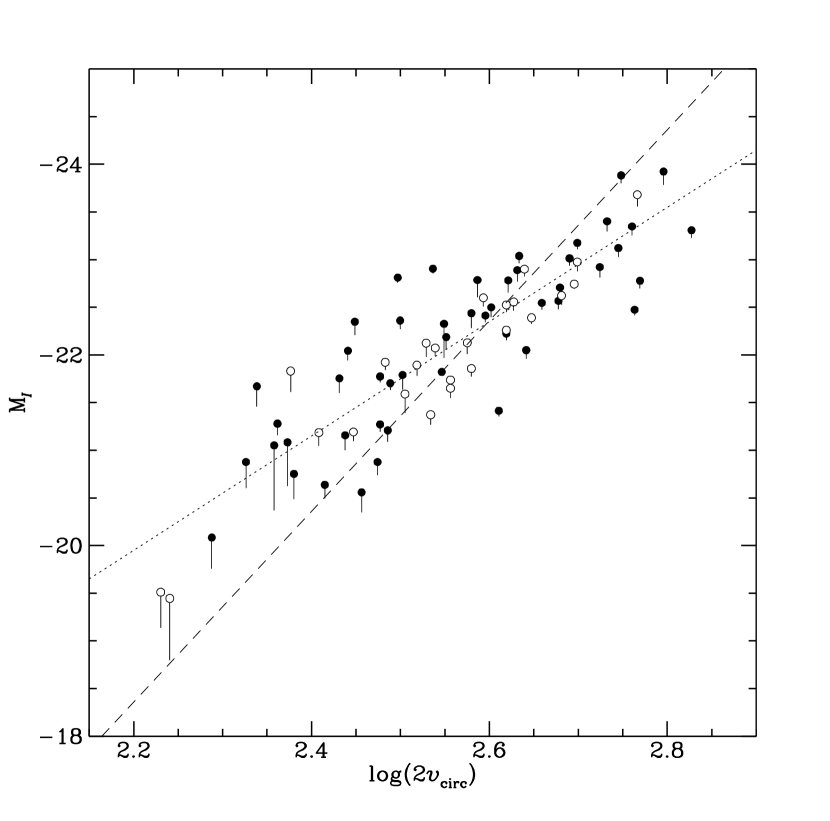
Figure 8 shows the TF relation for the galaxies in our sample assuming Hubble flow distances. We plot the total magnitude with closed symbols for Freeman type I and open symbols for type II galaxies. We also indicate the R23.5 isophotal magnitude at the end of the line connected to each symbol. The length of the line indicates the extrapolation from the isophotal to total magnitude. The fainter galaxies clearly require a larger extrapolation; this is because the fainter galaxies have lower central surface brightness as noted above.
If the slope of the TF relation is assumed to be near 6 and we consider the total magnitudes (Mathewson 1992, Bernstein et al. 1994) then the scatter around the TF line is 0.46 mag. The zero point of the relation is fixed so that the average deviation from the TF line is zero (this assumes no bulk flow for the sample). If the deviations from the TF line are attributed solely to peculiar motions, the error in the Hubble flow distances has a scatter of 24%. If the slope of the TF relation is assumed to be 10 and we consider isophotal magnitudes (SBWM, Peletier & Willner 1993) then the scatter about the TF relation is 0.75 mag which implies deviations from the Hubble flow distances of 40%.
5 Conclusions
We find that spiral galaxy mass models which assume the maximum disk hypothesis yield good rotation curve fits within the optical radius, for a variety of spirals with distinct surface brightness and rotation curve morphologies. 75% of galaxies for which the rotation curve is measured to R23.5 or beyond are well fit by a mass-traces-light model for the entire region within R23.5. It is particularly striking that spirals with very different disk surface brightness profiles, generically distinguished by Freeman types I and II, are well modeled under the maximum disk hypothesis.
Freeman type II galaxies constitute a significant fraction of spiral galaxies which fail to meet the canonical assumption that all spirals have an exponential disk. This has certainly contributed to the large discrepancy in disk scale lengths published by different authors for the same galaxies (Knapen & van der Kruit 1992). Type II galaxies can be further characterized by the size of the inner flat region and turnover rate. They span a large range of velocity widths and show no correlation with type. They generally break the correlation of rotation curve shape to absolute magnitude found by Rubin (1985) and Persic & Salucci (1995).
Galaxies for which our models fail to give good fits in the inner regions, % of the sample, generally have strong features, particularly bars but also strong spiral arms, which break the assumption of axisymmetry. Smaller scale deviations in the surface brightness profiles and rotation curves, “bumps and wiggles”, can also often be traced to nonaxisymmetric features.
These results show that, within the optical regions of most spiral galaxies, the radial mass distribution is tightly coupled to the luminosity distribution. This is a much stronger constraint than that due to global correlations such as the TF relation. It implies that either the mass of dark matter must be small within the optical radius or that the distribution of dark matter must be precisely coupled to the distribution of luminous matter. A dark halo which is independent of, and unresponsive to the luminous disk cannot dominate the mass within the optical radius. A fraction of the derived luminous mass could be traded for halo mass, but the luminous mass traces the overall features of so many and various rotation curves that this fraction could not reasonably be too large.
Persic and Salucci (1995) have constructed synthetic rotation curves by averaging over 500 optical rotation curves from Mathewson et al. (1992). They fit each synthetic rotation curve with model rotation curves for an isothermal halo and an exponential disk in which the scale length is fixed relative to the optical radius. They conclude that spirals galaxies with rotation velocities of 150 are over 40% dark matter within the optical radius, and that galaxies with rotation velocities of 100 are over 75% dark matter. The assumptions which lead to this conclusion are that all spirals galaxies have the same R23.5/rd and that all spirals of a given luminosity have the same rotation curve shape. Our results strongly suggest that both of these assumptions are too simplifying and call their results into question. We find that R23.5/rd is larger in low rotation velocity galaxies. This leads to more slowly rising rotation curves. Relaxing only this assumption considerably weakens their dark matter constraints.
Cosmological N-body simulations of hierarchical universes suggest a universal halo profile for mass scales from ranging from dwarf galaxies to rich clusters of galaxies (Navarro et al. 1996). The halo profiles are centrally concentrated and for spiral galaxies they dominate the mass distribution at all radii. In the cold-dark matter models of Navarro et al. , a galaxy with a maximum rotation velocity of 300 is 72% dark matter within the optical radius, a galaxy with a maximum rotation velocity of 200 is 90% dark matter, and a galaxy with a maximum rotation velocity of 100 is 96% dark matter. Our results show that optical rotation curves in real galaxies exhibit a variety of shapes and that these shapes are well modeled by the luminous distribution of matter. It is difficult to reconcile our results with a universal rotation curve in which the central attraction primarily due to a dark matter halo.
The success of the maximum disk hypothesis in modeling the mass distribution in the inner parts of spiral galaxies implies that either the mass of dark matter has to be small or that its projected distribution must follow precisely that of the luminous matter out to nearly the optical radius.
References
- (1)
- (2) Athanassoula, E., Bosma, A., & Papaioannou, S. 1987, A&A, 179, 23
- (3) Bahcall, J.N., & Casertano, S. 1985, ApJ, 293, 7L
- (4) Bahcall, J.N., Flynn, C., & Gould, A. 1992, ApJ, 389, 234
- (5) Beers, T.C., Flynn, K., & Gebhardt, K. 1990, AJ, 100, 32
- (6) Bendinelli, O. 1991, ApJ, 366, 599
- (7) Bernstein, G.M., Guhathakurta, P., Raychaudhury, S., Giovanelli, R., Haynes, M.,P., Herter, T., & Vogt, N.P. 1994, AJ, 107, 1962
- (8) Binney, J., & Tremaine, S. 1987, Galactic Dynamics (Princeton Univ. Press, Princeton)
- (9) Bothun, G.D., & Mould, J.R. 1987, ApJ, 313, 629
- (10) Bothun, G.D., Impey, C.D. & Malin, D.F. 1991, ApJ, 376, 404
- (11) Bothun, G.D., Schommer, R.A., Williams, T.B., Mould, J.R., & Huchra, J.P. 1992, ApJ, 388, 253
- (12)
- (13) Broeils, A.H 1992, Ph.D Thesis, University of Groningen
- (14) Broeils, A.H., & van Woerden, H. 1994, A&AS, 107, 129
- (15) Bruzual A.G., & Charlot, S. 1993, ApJ, 405, 538
- (16) Buchhorn, M. 1992, Ph.D. Thesis, Australian National University
- (17) Burstein, D., & Heiles, C. 1978, ApJ, 225, 40
- (18) Burstein, D. 1979, ApJ, 234, 829
- (19) Burstein, D., & Rubin, V. 1985, ApJ, 297, 423
- (20) Byun, Y.I., & Freeman, K.C. 1995, ApJ, 448, 563
- (21) Casertano, S., & van Gorkom, J.H. 1991, AJ, 101, 1231
- (22) da Costa, L.N., Freudling, W., Wegner, G., Giovanelli, R. Haynes, M.P., & Salzer, J.J. 1996, ApJ, 468, 5L
- (23) Debattista, V.P. & Sellwood, J.A. 2000, astro-ph/0006275
- (24) de Jong, R.S. 1995, Ph.D Thesis, University of Groningen
- (25) de Vaucouleurs, G.H. 1948, Ann. d’Astrophys., 11, 247
- (26) de Vaucouleurs, G.H. 1991, Third reference catalogue of bright galaxies (Springer-Verlag, New York)
- (27) Dressler, A., Faber, S.M., Burstein, D., Davies, R.L., Lynden-Bell, D., Terlevich, R.J., & Wegner, G. 1987, ApJ, 313, 37L
- (28) Dubinski, J., & Carlberg, R. 1991, ApJ, 378, 496
- (29) Dubinski, J. 1994, ApJ, 431, 617
- (30) Fitchett, M., & Merritt, D. 1988, ApJ, 335, 18
- (31) Franx, M., & de Zeeuw, T. 1992, ApJ, 392, 47
- (32) Freeman, K.C., 1970, ApJ, 160, 811
- (33) Freeman, K.C., 1992, in Physics of Nearby Galaxies Nature or Nurture?, ed. T.X. Thuan, C. Balkawski, & J.T.T. Van (Editions Frontieres), 201
- (34) Gerssen, J., Kuijken, K. & Merrifield, M.R. 1999, MNRAS, 306, 926
- (35) Giovanelli, R., Haynes, M., Salzer, J., Wegner, G., da Costa, L., & Freudling, W. 1994, AJ, 107, 2036
- (36) Graham, J.A. 1982, PASP, 94, 244
- (37) Han, M. 1992, ApJ, 391, 617
- (38) Humliček, J. 1979, J.Quant.Spect.Radiat.Transfer 21, 309
- (39) Jacoby, G. H., Branch, D., Ciardullo, R., Davies, R. L., Harris, W. E., Pierce, M. J., Pritchet, C. J., Tonry, J. L., & Welch, D. L. 1992, PASP, 104, 599
- (40) Kalnajs, A.J. 1965, Ph.D. Thesis, Harvard University
- (41) Kalnajs, A.J. 1983, in Internal Kinematics and Dynamics of Disk Galaxies, IAU Symposium No. 100, ed. E. Athanassoula (Reidel, Dordrecht), 87
- (42) Katz, N., & Gunn, J.E. 1991, ApJ, 377, 365
- (43) Kent, S.M., 1986, AJ, 91, 1301
- (44) Knapen, J.H., & van der Kruit, P.C. 1992, A&A, 248, 57
- (45) Kuijken, K., & Gilmore, G. 1991, ApJ, 367, L9
- (46) Lake, G., & Feinswog, L. 1989, AJ, 98, 166
- (47) Larson, R.B., & Tinsley, B.M. 1978, ApJ, 219, 46L
- (48) Lucey, J.R., Currie, M.J., & Dickens, R.J. 1986, MNRAS, 222, 427
- (49) Mathewson, D.S., Ford V.L., & Buchhorn M. 1992, ApJS, 81, 413
- (50) Merrifield M.R., & Kuijken, K. 1995, MNRAS, 274, 933
- (51) McGaugh, S.S. Bothun, G.D., & Schombert, J.M. 1995, AJ, 100, 573
- (52) Navarro, J.F., Frenk, C.S., & White, S.D.M. 1996, ApJ, 462, 563
- (53) Olling R.P. 1996, AJ, 112, 481
- (54) Ostriker, J.P., & Peebles, P.J.E. 1973, ApJ, 186, 467
- (55) Peletier, R.F., & Willner, S.P. 1993, ApJ, 418, 626
- (56) Persic, M., Salucci, P., & Stel, F. 1995, MNRAS, 281, 27
- (57) Press, W.H., Flannery, B.P., Teukolsky, S.A. & Vetterling W.T. 1992, Numerical Recipes (Cambridge University press)
- (58) Rix, H.-W., & Zaritsky D. 1995, ApJ, 447, 82
- (59) Roberts, M.S., & Haynes, M.P. 1994, ARA&A, 32, 115
- (60) Rubin, V.C., Burstein, D., Ford, W.K., JR., & Thonnard, N. 1985, ApJ, 289, 81
- (61) Sackett, P.D., Rix, H.-W., Jarvis, B.J., & Freeman, K.C. 1994, ApJ, 436, 629
- (62) Schombert, J.M., & Bothun, G.D. 1987, AJ, 93, 60
- (63) Schombert, J.M., Bothun, G.D., Schneider, S.E., & McGaugh, S.S. 1992, AJ, 103, 1107
- (64) Schommer, R. A., Bothun, G.D., Williams, T. B., & Mould, J.R. 1993, AJ, 105, 97 (SBWM)
- (65) Sellwood, J.A., & Wilkinson A. 1993, Rep. Prog. Phys., 56, 173
- (66) Sellwood, J.A., & Evans, N.W. 2000, astro-ph/0006198
- (67) Sprayberry, D., Bernstein, G.M., Impey, C.D., & Bothun, G.D. 1995, ApJ, 483, 72
- (68) Stark, A. A. 1977, ApJ, 213, 368
- (69) Stetson, P.B. 1987, PASP, 99, 191
- (70) Tully, R.B., & Fisher, J.R. 1977, A&A, 54, 661
- (71) Valentijn, E. 1990, Nature, 346, 153V
- (72) van Albada, G.D., & Sancisi, R. 1986, Phil. Trans. Roy. Soc. Lon. A, 320, 447
- (73) Warren, M.S., Quinn, P.J., Salmon, J.K., & Zurek, W.H. 1992, ApJ, 399, 405
- (74) Weinberg, M.D. 1985, MNRAS, 213, 451
- (75) Willick, J.A., Courteau, S., Faber, S.M., Burstein, D., & Dekel, A. 1995, ApJ, 446, 12
- (76) Worthey, G. 1994, ApJS, 95, 107
| galaxy | clust | D | Htype | Ftype | mI | R23.5 | rd | B/D | log(2) | M/LD | M/LB | M/L | |||
|---|---|---|---|---|---|---|---|---|---|---|---|---|---|---|---|
| Mpc | RC3 | mag | mag/ | kpc | kpc | ° | ° | ||||||||
| (1) | (2) | (3) | (4) | (5) | (6) | (7) | (8) | (9) | (10) | (11) | (12) | (13) | (14) | (15) | (16) |
| a1644d83 (a) | 79.62 | 10 | I | 14.42 | 21.23 | 7.32 | 3.64 | 0.06 | 77 | 278 | 2.29 | 3.00 | 0.15 | 2.84 | |
| e215g39 (b) | 61.29 | 5 | II | 12.01 | 19.74 | 12.92 | 4.20 | 0.08 | 50 | 29 | 2.48 | 2.16 | 0.81 | 2.06 | |
| e216g20 (c) | 77.85 | 10 | II | 12.07 | 19.35 | 13.46 | 2.90 | 0.09 | 74 | 306 | 2.65 | 2.42 | 0.83 | 2.29 | |
| e263g14 (d) | 69.83 | 3 | I | 11.32 | 18.54 | 15.93 | 3.60 | 0.04 | 60 | 289 | 2.54 | 0.92 | 0.63 | 0.91 | |
| e267g29 (e) | 76.23 | 2 | I | 11.84 | 19.31 | 15.86 | 4.31 | 0.12 | 51 | 313 | 2.66 | 2.94 | 0.48 | 2.68 | |
| e267g30 (f) | 75.92 | 3 | I | 11.48 | 19.77 | 16.40 | 4.98 | 0.62 | 55 | 294 | 2.72 | 4.32 | 1.14 | 3.10 | |
| e268g37 (g) | Cen | 68.50 | 5 | I | 12.39 | 19.65 | 12.50 | 3.43 | 0.08 | 55 | 120 | 2.50 | 2.33 | 0.00 | 2.17 |
| e268g44 (h) | Cen | 49.95 | 3 | I | 12.22 | 18.87 | 8.38 | 1.91 | 0.04 | 62 | 244 | 2.48 | 2.04 | 1.54 | 2.02 |
| e269g61 (i) | 69.40 | 3 | I | 10.81 | 19.17 | 24.00 | 5.97 | 0.03 | 76 | 253 | 2.74 | 2.59 | 0.00 | 2.51 | |
| e317g41 (j) | 81.17 | 2 | I | 11.53 | 18.89 | 17.66 | 4.19 | 0.03 | 71 | 105 | 2.69 | 2.43 | 1.09 | 2.39 | |
| e322g19 (k) | Cen | 45.23 | 6 | I | 12.64 | 19.90 | 8.10 | 2.47 | 0.00 | 79 | 300 | 2.41 | 2.06 | 0.00 | 2.06 |
| e322g36 (l) | Cen | 43.51 | 4 | I | 10.83 | 19.06 | 14.19 | 3.50 | 0.04 | 53 | 104 | 2.50 | 1.28 | 0.22 | 1.24 |
| e322g42 (m) | Cen | 55.99 | 5 | II | 11.91 | 20.76 | 14.57 | 4.65 | 0.05 | 71 | 42 | 2.38 | 1.47 | 0.00 | 1.39 |
| e322g44 (n) | Cen | 52.88 | 5 | I | 11.57 | 19.79 | 12.53 | 3.71 | 0.32 | 68 | 89 | 2.44 | 1.69 | 0.76 | 1.46 |
| e322g45 (o) | Cen | 44.19 | 5 | I | 11.52 | 19.12 | 10.36 | 2.85 | 0.03 | 67 | 308 | 2.52 | 1.73 | 0.00 | 1.69 |
| e322g48 (p) | Cen | 60.91 | 3 | I | 12.59 | 19.94 | 10.56 | 2.87 | 0.00 | 76 | 36 | 2.36 | 0.99 | 0.00 | 0.99 |
| e322g76 (q) | Cen | 64.28 | 4 | II | 11.97 | 20.50 | 12.22 | 2.91 | 0.30 | 57 | 259 | 2.54 | 2.34 | 1.27 | 2.09 |
| e322g77 (r) | Cen | 38.19 | 3 | I | 11.49 | 18.84 | 8.57 | 1.71 | 0.04 | 70 | 172 | 2.61 | 3.61 | 0.57 | 3.49 |
| e322g82 (s) | Cen | 65.84 | 5 | I | 11.05 | 19.46 | 19.16 | 5.34 | 0.11 | 63 | 8 | 2.63 | 2.28 | 1.43 | 2.20 |
| e322g87 (t) | Cen | 52.13 | 3 | II | 11.47 | 19.87 | 14.11 | 4.52 | 0.02 | 80 | 138 | 2.53 | 2.40 | 0.60 | 2.37 |
| e323g25 (u) | Cen | 59.76 | 4 | I | 11.34 | 18.69 | 14.27 | 3.31 | 0.01 | 55 | 283 | 2.66 | 2.61 | 2.75 | 2.61 |
| e323g27 (v) | Cen | 54.90 | 5 | II | 11.14 | 19.98 | 15.85 | 3.76 | 0.05 | 58 | 275 | 2.63 | 2.53 | 2.54 | 2.53 |
| e323g39 (w) | Cen | 69.90 | 10 | I | 13.35 | 20.46 | 9.35 | 3.42 | 0.07 | 53 | 265 | 2.33 | 2.02 | 0.00 | 1.89 |
| e323g42 (x) | Cen | 59.73 | 10 | I | 11.53 | 19.57 | 16.61 | 4.44 | 0.03 | 69 | 79 | 2.45 | 1.71 | 0.00 | 1.66 |
| e323g73 (y) | 69.63 | 10 | I | 12.44 | 18.46 | 9.47 | 2.06 | 0.02 | 48 | 358 | 2.51 | 1.13 | 0.00 | 1.10 | |
| e374g02 (z) | Antlia | 41.42 | 3 | I | 9.91 | 19.08 | 18.08 | 4.42 | 0.45 | 52 | 303 | 2.71 | 2.63 | 1.00 | 2.12 |
| e374g03 (aa) | Antlia | 43.22 | 6 | I | 11.51 | 20.11 | 13.20 | 4.25 | 0.03 | 71 | 149 | 2.34 | 1.45 | 0.00 | 1.41 |
| e375g02 (ab) | Antlia | 43.75 | 3 | II | 12.01 | 19.17 | 8.65 | 2.15 | 0.01 | 64 | 20 | 2.45 | 1.73 | 0.13 | 1.72 |
| e375g12 (ac) | Antlia | 42.86 | 3 | I | 9.28 | 18.97 | 27.64 | 6.66 | 0.12 | 44 | 309 | 2.75 | 2.19 | 2.18 | 2.19 |
| e375g29 (ad) | 56.12 | 5 | I | 11.99 | 19.83 | 13.15 | 3.54 | 0.00 | 80 | 321 | 2.43 | 1.95 | 0.00 | 1.95 | |
| e376g02 (ae) | 59.44 | 4 | II | 11.35 | 19.21 | 14.68 | 3.87 | 0.16 | 75 | 159 | 2.62 | 2.48 | 0.92 | 2.26 | |
| e376g10 (af) | 46.21 | 8 | I | 11.00 | 20.85 | 19.53 | 8.12 | 0.02 | 76 | 93 | 2.55 | 3.92 | 0.00 | 3.86 | |
| e377g11 (ag) | 46.01 | 2 | II | 10.72 | 19.85 | 17.35 | 3.51 | 0.12 | 73 | 58 | 2.59 | 2.40 | 0.00 | 2.14 | |
| e381g05 (ah) | 79.56 | 10 | I | 13.30 | 19.35 | 9.33 | 2.42 | 0.02 | 41 | 299 | 2.49 | 2.25 | 0.00 | 2.19 | |
| e381g51 (ai) | 70.72 | 3 | II | 11.44 | 19.34 | 15.18 | 2.71 | 0.12 | 82 | 58 | 2.70 | 2.92 | 0.00 | 2.61 | |
| e382g06 (aj) | 65.44 | 10 | I | 13.20 | 19.60 | 8.51 | 2.33 | 0.01 | 54 | 86 | 2.47 | 3.28 | 0.00 | 3.25 | |
| e382g58 (ak) | 106.20 | 4 | I | 11.21 | 19.94 | 32.75 | 9.42 | 0.12 | 79 | 153 | 2.80 | 4.32 | 0.79 | 3.93 |
| galaxy | clust | D | Htype | Ftype | mI | R23.5 | rd | B/D | log(2) | M/LD | M/LB | M/L | |||
|---|---|---|---|---|---|---|---|---|---|---|---|---|---|---|---|
| Mpc | RC3 | mag | mag/ | kpc | kpc | ° | ° | ||||||||
| (1) | (2) | (3) | (4) | (5) | (6) | (7) | (8) | (9) | (10) | (11) | (12) | (13) | (14) | (15) | (16) |
| e383g02 (al) | 85.40 | 5 | I | 12.22 | 19.76 | 16.82 | 4.87 | 0.10 | 60 | 213 | 2.58 | 2.86 | 2.29 | 2.81 | |
| e383g88 (am) | 59.51 | 4 | I | 11.69 | 19.78 | 15.25 | 4.77 | 0.02 | 67 | 274 | 2.55 | 2.75 | 4.00 | 2.77 | |
| e435g26 (an) | Antlia | 40.32 | 5 | II | 10.13 | 19.67 | 20.33 | 3.65 | 0.06 | 51 | 117 | 2.64 | 2.76 | 1.71 | 2.71 |
| e435g50 (ao) | Antlia | 40.60 | 5 | II | 13.53 | 21.34 | 5.55 | 2.23 | 0.00 | 82 | 70 | 2.26 | 2.08 | 0.00 | 2.08 |
| e436g39 (ar) | Hydra | 51.25 | 4 | II | 11.81 | 19.97 | 11.39 | 2.32 | 0.29 | 81 | 82 | 2.56 | 3.62 | 0.00 | 2.80 |
| e437g04 (aq) | Hydra | 48.10 | 4 | II | 11.76 | 19.72 | 10.84 | 2.80 | 0.06 | 63 | 320 | 2.56 | 2.65 | 0.00 | 2.49 |
| e437g30 (ar) | Hydra | 54.24 | 4 | I | 10.89 | 19.57 | 19.05 | 5.28 | 0.12 | 77 | 124 | 2.62 | 3.06 | 0.65 | 2.81 |
| e437g31 (as) | Hydra | 56.17 | 7 | I | 12.99 | 20.37 | 8.89 | 3.12 | 0.02 | 52 | 334 | 2.38 | 3.22 | 0.00 | 3.17 |
| e437g34 (at) | Hydra | 54.83 | 3 | II | 14.25 | 21.73 | 5.32 | 2.91 | 0.04 | 63 | 77 | 2.24 | 4.58 | 0.00 | 4.42 |
| e437g54 (au) | Hydra | 50.15 | 3 | I | 12.94 | 20.35 | 8.24 | 2.84 | 0.11 | 83 | 49 | 2.46 | 5.60 | 0.24 | 5.05 |
| e438g08 (av) | 124.3 | 10 | I | 12.66 | 18.60 | 14.27 | 3.15 | 0.18 | 40 | 89 | 2.50 | 0.90 | 0.40 | 0.82 | |
| e438g15 (aw) | 49.96 | 4 | II | 11.38 | 21.06 | 15.16 | 2.87 | 0.10 | 71 | 215 | 2.53 | 2.14 | 2.31 | 2.15 | |
| e439g18 (ax) | 122.20 | 4 | I | 12.09 | 19.59 | 20.99 | 5.90 | 0.30 | 43 | 276 | 2.76 | 4.15 | 0.00 | 3.20 | |
| e439g20 (ay) | 59.84 | 4 | I | 11.84 | 19.06 | 12.28 | 3.02 | 0.08 | 65 | 281 | 2.64 | 3.46 | 0.00 | 3.21 | |
| e441g22 (az) | 90.40 | 4 | II | 11.10 | 20.19 | 27.97 | 7.50 | 0.21 | 73 | 176 | 2.77 | 4.26 | 1.07 | 3.70 | |
| e444g21 (ba) | 60.68 | 10 | I | 12.86 | 21.67 | 10.97 | 6.44 | 0.05 | 84 | 64 | 2.36 | 4.50 | 0.57 | 4.32 | |
| e444g47 (bb) | 62.40 | 6 | I | 12.82 | 19.63 | 9.51 | 2.71 | 0.00 | 71 | 22 | 2.44 | 1.92 | 0.00 | 1.92 | |
| e444g86 (bc) | K27 | 58.18 | 10 | II | 11.56 | 19.41 | 12.93 | 3.55 | 0.20 | 78 | 252 | 2.62 | 2.86 | 0.51 | 2.46 |
| e445g15 (bd) | K27 | 60.34 | 10 | II | 12.05 | 20.26 | 11.12 | 2.51 | 0.52 | 66 | 56 | 2.58 | 4.02 | 1.14 | 3.04 |
| e445g19 (be) | K27 | 66.05 | 4 | I | 11.69 | 19.35 | 15.10 | 4.32 | 0.03 | 67 | 70 | 2.60 | 2.37 | 0.51 | 2.32 |
| e445g35 (bf) | K27 | 68.02 | 3 | I | 11.69 | 18.96 | 13.27 | 3.38 | 0.20 | 42 | 175 | 2.76 | 4.27 | 3.44 | 4.13 |
| e445g39 (bf) | 61.59 | 3 | I | 11.17 | 18.65 | 15.48 | 3.58 | 0.03 | 61 | 64 | 2.78 | 3.74 | 1.49 | 3.68 | |
| e445g58 (bh) | K27 | 70.78 | 4 | I | 11.75 | 19.24 | 15.96 | 4.05 | 0.06 | 63 | 330 | 2.60 | 2.42 | 0.03 | 2.29 |
| e445g81 (bi) | 61.12 | 4 | II | 11.36 | 19.76 | 15.80 | 3.60 | 0.07 | 79 | 3 | 2.67 | 2.74 | 0.00 | 2.55 | |
| e446g01 (bj) | 98.34 | 4 | I | 12.07 | 19.63 | 18.96 | 5.27 | 0.28 | 53 | 323 | 2.63 | 2.83 | 1.01 | 2.43 | |
| e446g17 (bk) | 58.52 | 3 | I | 11.05 | 20.51 | 18.87 | 6.87 | 0.30 | 54 | 148 | 2.60 | 3.11 | 0.24 | 2.45 | |
| e501g01 (bl) | Hydra | 55.57 | 7 | I | 12.64 | 21.12 | 11.00 | 5.06 | 0.06 | 55 | 334 | 2.39 | 4.81 | 0.00 | 4.54 |
| e501g11 (bm) | Hydra | 54.94 | 7 | II | 12.51 | 20.46 | 10.37 | 2.46 | 0.01 | 81 | 94 | 2.41 | 2.61 | 0.00 | 2.57 |
| e501g15 (bn) | Hydra | 49.43 | 1 | I | 10.35 | 19.44 | 19.66 | 5.24 | 0.36 | 60 | 111 | 2.75 | 3.46 | 2.47 | 3.19 |
| e501g68 (bo) | Hydra | 45.77 | 10 | II | 11.93 | 21.27 | 12.01 | 3.99 | 0.19 | 70 | 18 | 2.54 | 4.95 | 3.28 | 4.69 |
| e501g86 (bp) | Hydra | 54.28 | 4 | II | 11.78 | 20.84 | 13.67 | 3.07 | 0.08 | 60 | 201 | 2.52 | 2.75 | 0.49 | 2.59 |
| e502g02 (bq) | Hydra | 56.91 | 3 | I | 11.55 | 18.85 | 12.42 | 2.90 | 0.13 | 63 | 73 | 2.64 | 2.61 | 1.31 | 2.46 |
| e509g80 (br) | 92.86 | 4 | II | 11.86 | 20.70 | 20.29 | 4.36 | 0.14 | 61 | 171 | 2.70 | 3.95 | 2.38 | 3.75 | |
| e509g91 (bs) | 72.29 | 6 | II | 12.70 | 21.23 | 13.61 | 3.68 | 0.09 | 79 | 131 | 2.46 | 2.96 | 0.04 | 2.71 | |
| e510g11 (bt) | 81.13 | 1 | I | 11.84 | 19.01 | 17.65 | 3.52 | 0.13 | 66 | 64 | 2.68 | 3.02 | 1.88 | 2.89 | |
| e569g17 (bu) | 57.77 | 3 | I | 11.99 | 18.29 | 8.03 | 1.69 | 0.05 | 45 | 171 | 2.55 | 1.48 | 0.19 | 1.41 | |
| e572g17 (bv) | 93.44 | 0 | I | 11.55 | 18.76 | 19.22 | 4.56 | 0.12 | 48 | 59 | 2.83 | 3.71 | 1.76 | 3.51 |
Table 1 Notes
-
Column 1–
ESO-Uppsala Catalog number for galaxies in the sample. The codes for Figs. 1 are also given.
-
Column 2–
Cluster membership. Cen=Centaurus.
-
Column 3–
Distance in megaparsecs assuming Hubble flow with respect to the cosmic microwave background frame, and H∘= 75 Mpc-1.
-
Column 4–
Hubble type in RC3 (de Vaucouleurs 1991).
-
Column 5–
Freeman type.
-
Column 6–
Total -band magnitude.
-
Column 7–
Disk central surface brightness in .
-
Column 8–
Major axis radius of the = 23.5 mag arcsec-2 isophote in kpc.
-
Column 9–
Exponential disk scale length. We quote the scale length of the outer disk for Freeman type II galaxies.
-
Column 10–
Bulge to Disk luminosity ratio.
-
Column 11–
Inclination.
-
Column 12–
Major axis position angle measured North through East.
-
Column 13–
log of the circular rotation velocity width in .
-
Column 14–
-band M/L of the disk in solar units.
-
Column 15–
-band M/L of the bulge in solar units.
-
Column 16–
-band M/L of the disk plus bulge in solar units.