2. Department of Physics and Astronomy, Macalester College, St. Paul, MN 55101, USA
3. The Department of Pure and Applied Physics, The Queen’s University of Belfast, Belfast BT7 1NN, N. Ireland
4. ING Telescopes, Apartado de Correos 368, Santa Cruz De La Palma, 38780, Canary Islands, Spain.
Chemical abundances in the inner 5 kpc of the Galactic disk
Abstract
High-resolution, high signal-to-noise spectral data are presented for four young B-type stars lying towards the Galactic Centre. Determination of their atmospheric parameters from their absorption line profiles, and photometric measurement of the continua indicate that they are massive objects lying slightly out of the plane, and were probably born in the disk between 2.55 kpc from the Centre. We have carried out a detailed absolute and differential line-by-line abundance analyses of the four stars compared to two stars with very similar atmospheric parameters in the solar neighbourhood. The stars appear to be rich in all the well sampled chemical elements (C, N, Si, Mg, S, Al), except for oxygen. Oxygen abundances derived in the atmospheres of these four stars are very similar to that in the solar neighbourhood. If the photospheric composition of these young stars is reflective of the gaseous ISM in the inner Galaxy, then the values derived for the enhanced metals are in excellent agreement with the extrapolation of the Galactic abundance gradients previously derived by Rolleston et al. (2000) and others. However, the data for oxygen suggests that the inner Galaxy may not be richer than normal in this element, and the physical reasons for such a scenario are unclear.
Key Words.:
B-stars - stars:atmospheres - stars:abundances - Galaxy:evolution - Galaxy:center - Galaxy:abundances1 Introduction
The current metallicity of the Galactic disk represents a fossil record of chemical enrichment since the birth of the Milky Way and during its subsequent evolution. As stars continually enrich the interstellar medium with their nucleosynthetic products, the metallicity of the disk increases over time. By investigating the relative abundance of chemical elements as a function of time and position within the Galaxy, it is possible to constrain models of Galaxy formation and evolution.
Much work has been done on tracking the chemical evolution of the solar neighbourhood as a function of time using age-metallicity relations and element abundance ratios in cool F and G-type stars. The seminal work by Edvardsson et al. (Edv93 (1993)) showed the potential of using samples of nearby stars with an age spread to trace the temporal evolution of the disk and the halo, and such work has been extended by, for example, Fuhrmann (fuhr98 (1998)) and Israelian et al. (isr98 (1998)). These types of metallicity ratios have been modelled by many authors (e.g. Carraro et al. 1998, Pilyugin & Edmunds 1996 and references therein), in order to constrain our Galaxy’s history. The photospheric abundances of massive stars (viz. stars with ZAMS 10 M⊙) do not have the potential to provide us with temporal information as they are by nature short-lived objects (with typical lifetimes of the order of 10-50 Myrs). However, their high intrinsic luminosities mean that we can spectroscopically observe them at large distances from the solar neighbourhood; OB-type main-sequence stars are typically 8m visually brighter than early G-type dwarfs. Their photospheres are representative of the interstellar material from which they were born due to their relative youth. Hence, we can spatially and radially sample the metallicity of the Galactic disk by determining abundances in distant, luminous blue stars. The radial variation of different elements provides a further key constraint on the formation and evolutionary mechanisms of the Galactic disk (Matteucci & Francois Mat89 (1989), Matteucci & Chiappini Mat99 (1999), Prantzos & Aubert Pra95 (1995), Portinari & Chiosi por99 (1999), Pagel & Tautvaišinė pag95 (1995)).
These models require further observational constraints to restrict the possible influence of their many free parameters such as initial mass function, gas fraction variations, star formation rates, infall and outflow rates and metallicity dependent stellar yields. Previous work has shown that the metallicity of the Galactic disk decreases as Galactocentric distance increases. This metallicity gradient has been reproduced quantitatively using a number of different methods. For example, extensive studies of optical emission lines in H ii regions by Shaver et al. (Sha83 (1983)) and Fich & Silkey (Fic91 (1991)) have derived an oxygen abundance gradient of dex kpc-1; within the region kpc (where refers to Galactocentric distance throughout this paper). Good agreement was also found by Maciel & Köppen (Mac94 (1994)) and Maciel & Quireza (Mac99 (1999)) from PN studies, and by Afflerbach et al. (Aff97 (1997)) in a study of ultra-compact H ii regions. Several studies of B-type main-sequence stars throughout the disk had given discrepant results, and a much shallower gradient than that derived from the nebular studies (e.g Fitzsimmons et al. Fit92 (1992), and references therein). However Smartt & Rolleston (Sma97 (1997)), in a consistent re-analysis of an extensive data-set of B-type stars covering kpc, showed that previous B-type star studies produced spurious gradient determinations, and derived an oxygen abundance gradient of dex kpc-1 in excellent agreement with the nebular studies. As a follow up to this, Rolleston et al. (roll2000 (2000); hereafter RSDR) carried out a more detailed and exhaustive survey of the large data-set gathered by the group at Queen’s University and have confirmed this result, while also producing abundance ratios of different elements along the disk. Further work by Gummersbach et al. (Gum98 (1998)) also indicates that the nebular and stellar results are in agreement within the errors of measurement.
However, most studies of the chemical composition of the Galactic disk have concentrated on the solar neighbourhood, and the anti-centre direction. Optical extinction rises steeply in the direction toward the Galactic Centre, and restricts the optical observation of disk stars more than a few kiloparsecs away. In the anti-centre direction we have previously probed out to 18 kpc, experiencing A3 (Smartt et al. Sma96 (1996)), but have only managed to observe open clusters towards the Centre approximately 23 kpc away (RSDR) with a reddening of A2. The metallicity within the solar Galactic radius is poorly sampled, with only a few IR studies available. Rudolph et al. (Rud97 (1997)) and Afflerbach et al. (Aff97 (1997)) have used similar observational methods for far-IR emission lines in H ii regions (of differing sizes) as ISM abundance probes. This far-IR technique has allowed observation of some inner Galactic regions. These studies suggest that the abundance gradients for both nitrogen and sulphur do tend to increase towards the Galactic Centre, but both indicate that their oxygen abundance derivations may suffer some uncertainties (see Section 5.1). Carr et al. (carr2000 (2000)) have achieved a first determination of stellar abundances (in an M-type supergiant) directly at the Galactic Centre in the spectacular star forming region within the central few hundred parsecs. They find an Fe abundance close to that of the solar neighbourhood, which at first may seems surprising given the wealth of evidence of a strong abundance gradient in the Milky Way (and also in other spirals). However as we discuss in Section 4, this region may be unrelated to the starforming Galactic disk ( kpc) as a whole, and its evolution may have proceeded independently.
The metallicity of the inner disk therefore has not been investigated in any great detail, and lacks information on a variety of elemental abundances. Spectra of B-type stars provide the potential to sample many more chemical elements than is possible through emission line studies. As discussed above, massive B-type main-sequence stars are excellent probes of the current interstellar medium and sample particularly well the -processed elements (O, Mg, and Si) as well as C and N (Smartt et al. 1996). This paper describes observations of metal-rich massive stars lying towards the Galactic Centre together with detailed model atmosphere and abundance analyses. This allows the comparison of abundance ratios in this interesting regime with those in the rest of the disk, as a key probe of the evolution of our Galaxy.
2 Observational Data
The main difficulty in optically probing the inner regions of the Galactic disk is of course the high extinction encountered. This section describes how we identified targets for optical photometry and spectroscopy which are in regions of low extinction, but which have probably originated in the inner disk region.
2.1 Selection of targets in regions of low extinctions towards the Galactic centre
The catalogue of Reed (reed93 (1993)) provides a database of published UBV photoelectric photometry for objects in the Stephenson and Sanduleak catalogue Luminous Stars in the Southern Milky Way (step71 (1983)). This catalogue is a fairly complete record of OB-type stars and A- & F-type supergiants and giants within 10∘ of the galactic plane and with longitude limits , down to a limiting photographic magnitude of approximately 12.5. In order to identify OB-type stars near the Galactic Centre, which also have moderate Galactic latitudes and hence suffer from low extinction, stars from the Reed catalogue were selected which satisfied all of the criteria listed below:–
-
1.
Stars within ; hence restricting the sample to objects towards the Galactic Centre.
-
2.
Stars which are more than 4∘ above or below the plane; in order to limit the effects of interstellar extinction.
-
3.
Stars which are fainter than V = 11.0, to sample the more distant objects.
-
4.
Stars with a colour factor between 0.90 Q 0.66; appropriate for early B-type stars;
where . -
5.
Stars with a B–V of less than 0.5 which implies a reddening of (for early B-type intrinsic colours).
The combination of these criteria should produce targets which are potentially normal early B-type dwarfs (or near main-sequence objects) lying within 4 kpc of the Galactic Centre and twelve such stars were found.
The database of Reed & Beatty (reed95 (1995)) contains published spectral types for a subset of the objects in Reed (reed93 (1993)). However, the fainter objects of the earlier study (which were the most promising distant B-type stellar candidates) did not have an entry in Reed & Beatty (1995). As a result we had to rely on colours as a primary selector.
2.2 Spectroscopic data
The spectroscopic data presented in this paper were taken on two different runs. All twelve candidates were observed at the Anglo-Australian Telescope in August 1994 at intermediate resolution. The RGO spectrograph along with the 1200B diffraction grating, 82 cm camera and the TEK 1K CCD were used to give a resolution of approximately 0.7 Å (FWHM). Two grating positions were employed with central wavelengths of 4020 Å and 4580 Å, each giving a wavelength coverage of 240 Å. The primary motivation of these observations was to identify normal stars for further, higher resolution observations at a higher signal-to-noise ratio, and to provide reliable H i profiles for the stars which did turn out to be normal. Six of the stars observed appeared to be normal main-sequence early-type B-stars. However one of these was a fast rotator with a lack of metal line features, while another appeared to be a double-lined spectroscopic binary (composed of two early-type components) with the metal lines severely blended. The nature of the other six peculiar stars is discussed in Venn et al. (ven98 (1998)). The four apparently normal stars (see Table 1) were further observed with the ESO 3.6m telescope using the CASPEC échelle spectrograph during July 1995. The central wavelength was 4500 Å with a wavelength coverage of near 1300 Å (3920 – 5240Å) at a resolution of 0.1 Å.
| Star | SpT | V | B-V | U-B | ||
|---|---|---|---|---|---|---|
| LS5130 | B2 IV | 12.09 | 0.24 | 0.53 | 21.12 | 5.63 |
| LS4419 | B2 IV | 11.08 | 0.08 | 0.65 | 351.78 | 5.88 |
| LS4784 | B2 IV | 11.55 | 0.09 | 0.60 | 1.70 | 6.12 |
| LS5127 | B3 II-III | 11.96 | 0.15 | 0.55 | 16.13 | 7.34 |
During both observing programmes the observational routine was similar. Each star was observed long enough to accumulate sufficient counts in the continuum to yield a minimum signal-to-noise ratio of 70, and in most cases more than 100. The observations were split into exposures of 1200 – 1500 s to minimize the impact of cosmic-ray contamination and were bracketed by observations of Cu-Ar and/or Cu-Ne wavelength calibration lamps. Flat-field exposures and bias frames were generally taken at both the beginning and the end of the night.
The single order spectra were reduced using the starlink package figaro (Shortridge et al. short97 (1997)) as discussed in Smartt et al. (Sma96 (1996)), where further details can be found. The échelle data were reduced using the Image Reduction and Analysis Facility (iraf), using standard techniques. When in one dimensional format, all the spectra were transferred for further analysis to the starlink program dipso (Howarth et al. How98 (1998)). Normalization was achieved by carefully selecting continuum regions free from absorption lines, and fitting low order (of degree 3 or 4) polynomials through the noise. Equivalent widths for the metal lines and non-diffuse lines of neutral helium were measured by the non-linear least square fitting of single or multiple Gaussian profiles to the normalised spectra. Each line is assigned an error estimate reflecting the reliability of the equivalent width measurement, viz. a: error less than 10%, b: error less than 20%, c: error greater than 20%. These were assigned by considering the numerical error returned by the dipso line fitting computation and the qualitative accuracy of the profile fit. The hydrogen and diffuse helium lines were not measured in this manner, but the normalised profiles were extracted directly for comparison with Galactic standards and with theoretical profiles. The equivalent width measurements for each star can be found in Appendix A (available electronically).
2.3 Photometric Data
Strömgren photometry of the four B-type LS stars was obtained in service mode using the People’s photometer on the SAAO 0.5-m telescope. Details of the instrumental set-up can be found in Kilkenny et al. (kil88 (1988)) – and the resultant photoelectric aperture photometry is listed in Table 2. Additionally, we attempted to obtain Strömgren CCD data (as a consistency check) on the ESO 1.5-m Danish Telescope in July 1998. For two of the stars (viz. LS4419 and LS5127) we did indeed obtain good quality observations during photometric conditions. However, the data for the other two stars was compromised by high cirrus. Initial CCD reductions were performed using the iraf ccdred package (Massey mas92 (1992)), while subsequent digital aperture and point-spread function photometry was undertaken using tasks within the iraf package daophot (Davis dav94 (1994)). Further details of these methods can be found in Mooney et al. (moo00 (2000)).
In Table 2 we list the individual photometric indices as derived from the SAAO observations. Typical uncertainies in the SAAO photoelectric photometry are 0.01 and 0.005 magnitudes in colours and the individual passbands respectively. The Strömgren reddening free [] index should be accurate to 0.03 magnitudes. The ESO CCD dataset comprised four independent observations per filter per field containing each of the LS stars. Photometric errors were estimated using two methods. First, each set of instrumental magnitudes were independently transformed to the standard system of and (), , indicies. These were used to deduce mean values and associated standard errors of the mean. Secondly, values of the arithmetic mean and standard error were deduced for the independent sets of instrumental measurements. The mean values were transformed to the standard magnitude and colour indicies, while the associated photometric uncertainties were deduced by propagating the standard error of the mean values through the transformation equations.
For LS4419, both these methods inferred a photometric accuracy of 0.006 magnitudes in and 0.011 magnitudes in the colour (). The reddening free [] index should be accurate to magnitudes. Thus, it is not surprising that we find excellent agreement between the SAAO and ESO photometry for LS4419. Photometric uncertainties are somewhat larger for the ESO data obtained for LS5127, viz. 0.015, 0.035 and 0.15 magnitudes in , colour and [] index respectively. For this star, the SAAO data should be the more reliable. However, it should be noted that the SAAO and ESO measurements agree within the photometric errors – which in turn lead to similar estimates of the stellar effective temperature (see Sect. 3).
| Star | [] | [] (SAAO) | [] (ESO) | ||||
|---|---|---|---|---|---|---|---|
| LS5130 | 12.038 | 0.264 | 0.025 | 0.182 | 0.129 | 0.248 | – |
| LS4419 | 11.089 | 0.115 | 0.032 | 0.105 | 0.082 | 0.220 | 0.204 |
| LS4784 | 11.519 | 0.157 | 0.035 | 0.122 | 0.091 | 0.261 | – |
| LS5127 | 11.883 | 0.193 | 0.023 | 0.233 | 0.194 | 0.364 | 0.456 |
| Peg | 2.84 | 0.106 | 0.093 | 0.116 | 0.137 | 0.255 | |
| Her | 3.80 | 0.064 | 0.078 | 0.294 | 0.307 | 0.423 | |
3 Model atmosphere and abundance analyses
The methods employed to derive stellar atmospheric parameters are similar to those described in Smartt et al. (1996) and Rolleston et al. (1997). All results are based on the ATLAS9 grid of line-blanketed model atmospheres of Kurucz (Kur91 (1991)). LTE line formation codes were used to derive line profiles leading to determinations of atmospheric parameters and chemical compositions.
| Star | [He] | v | |||
|---|---|---|---|---|---|
| (K) | (cgs) | (kms-1) | dex | (kms-1) | |
| LS5130 | 21200 | 3.5 | 5 | 11.05 0.20 | 35 |
| LS4419 | 22100 | 3.7 | 7 | 10.92 0.10 | 80 |
| LS4784 | 20900 | 3.9 | 5 | 10.92 0.15 | 93 |
| LS5127 | 17900 | 3.2 | 7 | 10.87 0.13 | 120 |
| Peg | 21000 | 3.8 | 5 | 10.87 0.09 | 5 |
| Her | 17700 | 3.9 | 5 | 10.78 0.08 | 10 |
| Species | LS5130 | Peg | Differential | Nearby | Other solar | Solar | |
|---|---|---|---|---|---|---|---|
| B-stars1 | neighbourhood | ||||||
| C ii | 8.47 0.31 (11) | 8.22 0.31 (9) | +0.23 0.15 (9) | 8.20 | 8.13c | 8.55 | |
| N ii | 7.96 0.22 (25) | 7.79 0.24 (19) | +0.15 0.13 (19) | 7.81 | 7.94d | 7.97 | |
| O ii | 8.69 0.19 (43) | 8.72 0.32 (81) | 0.06 0.16 (35) | 8.68 | 8.70c | 8.87 | |
| Mg ii | 7.64 (1) | 7.22 (1) | +0.42 (1) | 7.38a | – | 7.58 | |
| Al iii | 6.30 0.09 (4) | 6.14 0.05 (3) | +0.13 0.10 (3) | 6.45 | – | 6.47 | |
| Si ii | 6.85 0.14 (4) | 6.50 0.10 (4) | +0.34 0.04 (4) | 7.28a | – | 7.55 | |
| Si iii | 7.66 0.19 (5) | 7.29 0.20 (5) | +0.36 0.24 (5) | 7.28a | – | 7.55 | |
| S ii | 7.39 0.21 (2) | 6.96 0.24 (15) | +0.38 0.02 (2) | 7.21 | 7.12d | 7.21 | |
| S iii | 7.29 (1) | 7.06 0.41 (9) | +0.23 (1) | 7.21 | 7.12d | 7.21 | |
| Ar ii | 7.03 0.61 (3) | 6.75 0.46 (3) | +0.28 0.15 (3) | – | 6.58 | ||
| Fe iii | 6.53 0.96 (3) | 6.39 0.82 (3) | +0.13 0.18 (3) | 7.36a | – | 7.51 |
-
1.
All typical B-type stellar values are taken from Gies & Lambert (1992), apart from
a: Kilian (Kil94 (1994)) - 2.
- 3.
As a first attempt to constrain the effective temperatures () of the four LS stars, which were all of spectral type B2/B3, we used the ionization balance of the two stages of silicon; the Si ii lines at 4128 Å and 4130 Å, and the Si iii triplet at 4552–4574Å. This method has been previously employed to analyse the bright standard Pegasi (HR39), and is known to produce anomalous and unsatisfactory results (Ryans et al. 1996, Gies & Lambert 1992, Peters 1976). Absolute abundances (derived using this temperature diagnostic) of N ii, O ii, Mg ii, and S iii show systematic underabundances of around 0.4 dex with respect to normal B-type stellar values. Further, and more critically, large discrepancies then exist between the abundances derived from other ionization equilibria (C ii/C iii, S ii/S iii, and Si iii/Si iv) when using this Si ii/Si iii temperature balance. Using Strömgren photometry as an alternative effective temperature indicator produces more satisfactory results; typically, a value systematically 3000 K less than that estimated from the Si ii/Si iii balance has been obtained which agrees with the other ionization balances, and the metal abundances give normal results. The problem with the Si ii lines historically stretches back more than two decades, when Peters (peter76 (1976)) first reported the problem. All stars in the Gies & Lambert (1992) study (which have ; from Strömgren indices) appear to produce spurious Si ii results and a similar temperature problem has been found by the authors in at least two other stars – 22 Ori and Her. In each case the temperature found from the Si ii/Si iii lines is systematically higher than that produced from the Strömgren indices. Hence, it appears that the Si ii/Si iii ionization balance is flawed as a temperature diagnostic due to reasons which are, as yet, not well understood. We find that including non-LTE corrections (Brown 1987) in the line formation calculations fails to remove the discrepancy. Cuhna & Lambert (Cuh94 (1994)) have also reported the same effect when adopting Strömgren temperatures for Orion B-types and their subsequent determination of Si abundances from both ionization stages.
In the rest of this paper we shall adopt the effective temperatures derived from the Strömgren indices listed in Table 2. The colour index [] measures the Balmer jump as a function of and we have primarily used the calibration of Napiwotzki et al. (nap93 (1993)). We also compared the effective temperatures derived using the calibration of Lester et al. (Les86 (1986)), which provides the [] vs relation as a function of surface gravity; consistent results were found in each case. Table 3 lists the effective temperatures that we have adopted. For the two stars for which we have both SAAO and ESO data, we list the mean of the two temperatures. Excellent agreement was found from the two data sets for LS4419, with temperatures of 21900 and 22300 K derived from ESO and SAAO respectively; for LS5127 the temperatures were in poorer agreement, 18700 and 17100 K, but consistent with a 17900 1000 K range.
Logarithmic surface gravities () were estimated by fitting model profiles of the Balmer lines from our atmospheric analysis codes to observed H, H, and H depending on which lines were available in the RGO spectra (see Section 2). In all cases the results from each line were in good agreement. A conservative estimate of the probable random errors in our analyses, given the errors in the measured data are 1000 K and dex. A value for microturbulent velocity () was determined for all the B-type stars by requiring that the derived abundances from, primarily, O ii were independent of line strength. The O ii ion was chosen as it has the richest absorption line spectra in stars of this type. However where a significant number of N ii lines were available, was independently estimated and the mean taken. Atmospheric parameters for all the stars are listed in Table 3.
As a final step in defining the model atmosphere appropriate to each star, we determined the helium abundance within this iterative procedure. Helium abundances were calculated from the line strengths of the available non-diffuse lines (3964, 4437, 4713, 5015 & 5047 Å) and the profile fitting of the diffuse lines (4009, 4026, 4387, & 4471 Å). In each star we found a normal helium composition of approximately dex (corresponding to by fraction). Hence, we did not need to repeat the iterations for models with significantly abnormal helium fractions.
Final model atmospheres with parameters which satisfied the above criteria were then calculated in order to allow the metal abundances from each unblended ionic feature to be determined in each star. The elemental abundance associated with a particular line was derived by comparing the observed line strengths and profiles to those predicted from the LTE line formation calculations. A line-by-line differential analysis was performed for each star relative to nearby (i.e. within the solar neighbourhood) spectroscopic standard stars of very similar atmospheric parameters. The atomic data used in the line formation theory were from Jeffery (Jef91 (1991)), but this choice is not critical for our purposes of a differential abundance analysis. Tables 4-6 list the absolute and differential abundances derived for each star. The mean absolute abundances are on a logarithmic scale with hydrogen = 12.0 dex (i.e. [X]), and the errors quoted are the standard deviations about this mean value.
| Species | LS4419 (absolute) | LS4419 (differential) | LS4784 (absolute) | LS4784 (differential) | |
|---|---|---|---|---|---|
| C ii | 8.18 0.27 (5) | +0.07 0.19 (5) | 8.42 0.56 (4) | +0.27 0.16 (4) | |
| N ii | 8.27 0.52 (16) | +0.43 0.25 (13) | 8.43 0.37 (15) | +0.62 0.29 (12) | |
| O ii | 8.76 0.27 (28) | 0.06 0.20 (23) | 9.06 0.44 (26) | +0.17 0.35 (19) | |
| Mg ii | 7.50 (1) | +0.28 (1) | 7.70 (1) | +0.48 (1) | |
| Al iii | 6.35 0.04 (2) | +0.18 (1) | 6.65 0.03 (2) | +0.47 (1) | |
| Si ii | 6.90 (1) | +0.23 (1) | 6.94 0.12 (4) | +0.44 0.07 (4) | |
| Si iii | 7.58 0.12 (5) | +0.28 0.26 (5) | 8.00 0.11 (3) | +0.58 0.18 (3) | |
| S ii | 7.17 (1) | +0.12 (1) | 7.51 (1) | +0.33 (1) | |
| Ar ii | 6.59 (1) | +0.09 (1) | – | – | |
| Fe iii | 6.45 (1) | 0.18 (1) | – | – |
3.1 LS5130
The value of microturbulence adopted for LS5130 and Peg plays an important role in the derived abundances of oxygen, magnesium and silicon in particular. As the abundance variations of these elements are of particular interest, a short discussion is warranted. From the O ii and N ii lines of Peg, the microturbulence is likely to lie in the range of 5 2 kms-1. This is consistent with other studies (e.g. Peters 1976, Gies & Lambert 1992) who quote a value at the lower end of this scale (3 kms-1) and Ryans et al. (1996) who estimate a value of 6 5 kms-1. It is likely that the latter error bars are too conservative, and from our investigation we believe the result appropriate to our methods to be in the range 3–7 kms-1. For LS5130 we similarly derive a value of km s-1 , which leads to a relatively normal O abundance in this star, but significantly higher Mg and Si abundances. The latter differential abundances would move closer to the value of O (as would generally be expected from a chemical evolution point of view ; see discussion in Section 5.2), if the value of was increased in LS5130 and decreased in Peg by about 3 kms-1 in each case. However while such changes are compatible with our random error range quoted, it would be an artificially biased analysis. Indeed our best estimates of for LS5130 tend to suggest that a value of no more than 5 kms-1 is required to flatten the equivalent width – abundance relation for the O ii and N ii species. One should note that the large number of O ii features (a total of 43), which renders this element abundance estimate particularly reliable. The analysis here implies that its abundance is very similar to that of Peg, i.e. no significant enhancement of this element is observed, and this is a very robust result. The other elements which we believe give reliable results are C, N, Mg, Si and S – and we note that all of these elements show enhanced patterns, particularly Si and Mg. Although the Mg abundance is based on only one line (the doublet at 4481Å), it is a strong, well measured feature which is reliably modelled in B-type stars at this effective temperature. This pattern of a relatively normal oxygen abundance together with enhanced C, N, Mg, Si and S is also reflected in the other B-type stars. The values for Al iii, Ar ii, and Fe iii are based on relatively weak detections of features and should be treated with some caution – this is generally true for each of the four stars, and LS5130 has the highest “quality” spectrum available, i.e. it has a high signal-noise-ratio and the star itself has a relatively low projected rotational velocity.
3.2 LS4419
The higher projected rotational velocity of this star results in fewer metal line features being identified. However again the oxygen abundance is well constrained, with 28 features contributing to the final result. Hence, we conclude that LS4419 also shows no evidence for enhanced oxygen (with respect to the solar neighbourhood), and there is certainly no evidence for the large enhancements one might expect to see in inner Galactic regions. It should be noted (and this is true for LS4784 and LS5130 also) that although the absolute Mg abundance derived is close to the ‘solar’ range of dex, the value derived for Peg by our methods (and indeed any other star of approximately the same spectral type in the solar neighbourhood) is 7.2 dex. We believe that a value of 7.5 is dex above the solar neighbourhood value, and that the absolute abundance discrepancy is possibly due to atomic data uncertainties or non-LTE effects. Again we believe that the C, N, O, Mg, Si, and S differential abundances are reliable for this star, but the others should be treated with caution due to the paucity and weakness of the individual features.
3.3 LS4784
The quality of this spectrum is similar to that of LS4419, and the previous comments about the reliability of the abundances (particularly with reference to O and Mg) are equally applicable here. One should also note that although the absolute abundances derived from the Si ii lines are of dubious worth (as discussed above with respect to determinations), in both the standard stars and the LS stars, it is encouraging to see that the differential abundances derived from Si ii and Si iii are consistent. This suggests that the same effect occurs in each spectra, and that the lines can be quantitatively compared from star to star. Again in this star we see a relatively normal oxygen abundance, but enhanced magnesium and silicon. Nitrogen and sulphur are also enhanced, with carbon showing a mildly enriched abundance.
| Ion | LS5127 | Her | Differential |
|---|---|---|---|
| C ii | 8.82 0.34 (2) | 8.26 0.27 (11) | +0.55 (1) |
| N ii | 8.29 0.10 (7) | 7.87 0.18 (23) | +0.51 0.23 (6) |
| O ii | 9.05 0.19 (7) | 8.79 0.20 (54) | +0.21 0.25 (6) |
| Mg ii | 7.76 (1) | 7.23 0.26 (6) | +0.69 (1) |
| Al iii | 6.68 (1) | 6.23 0.05 (6) | +0.36 (1) |
| Si ii | 7.45 0.26 (3) | 6.84 0.50 (4) | +0.81 0.33 (3) |
| Si iii | 8.18 0.12 (4) | 7.51 0.20 (7) | +0.64 0.08 (3) |
| S ii | 7.44 0.16 (5) | 6.99 0.23 (41) | +0.39 0.49 (5) |
| S iii | 7.97 0.34 (2) | 7.14 0.30 (5) | +0.76 0.02 (2) |
| Fe iii | – (0) | 6.97 0.67 (8) | – (0) |
| Species | +1000 | 1000 | +3km/s | 3km/s | ||
|---|---|---|---|---|---|---|
| C ii | 0.01 | 0.00 | 0.02 | 0.03 | 0.08 | 0.11 |
| N ii | 0.07 | 0.05 | 0.06 | 0.12 | 0.08 | 0.11 |
| O ii | 0.12 | 0.11 | 0.18 | 0.23 | 0.11 | 0.15 |
| Mg ii | 0.05 | 0.05 | 0.13 | 0.11 | 0.22 | 0.32 |
| Al iii | 0.05 | 0.03 | 0.02 | 0.08 | 0.08 | 0.15 |
| Si ii | 0.06 | 0.08 | 0.20 | 0.15 | 0.05 | 0.11 |
| Si iii | 0.09 | 0.09 | 0.14 | 0.18 | 0.21 | 0.24 |
| S ii | 0.04 | 0.05 | 0.16 | 0.14 | 0.09 | 0.21 |
| S iii | 0.13 | 0.12 | 0.14 | 0.18 | 0.07 | 0.13 |
| Ar ii | 0.01 | 0.02 | 0.12 | 0.06 | 0.06 | 0.14 |
| Fe iii | 0.09 | 0.08 | 0.04 | 0.08 | 0.08 | 0.24 |
3.4 LS5127
This star is cooler than the three previously discussed, and hence we used a different solar neighbourhood star for the differential abundance comparison. The star Her has atmospheric parameters more compatible with that of LS5127 than Peg (we did in fact carry out the same differential analysis using Peg, and the results were not significantly different to those in Table 6). The oxygen abundance appears to be slightly above normal, but is not as high as the abundances of both Mg and Si. We find a particularly large magnesium abundance from the 4481Å feature, and a line profile together with a spectral synthesis of the region is shown in Fig. 1. The microturbulence derivation in LS5127 is probably more uncertain than in the previous three stars, due to the fewer O ii lines visible at this effective temperature. However, it is unlikely that the particularly large Mg ii abundance can be explained by an underestimate of . In Fig. 1 we have used kms-1, but adopting a value of 10 kms-1, and a high abundance for Al iii (i.e. 7.00 in order to ensure that the strength of this feature is not due to severe blending with the Al iii line at 4479Å) still results in the differential value being 0.5 dex. Again we find that both ionization stages of Si give consistently high abundances, consistent with the Mg enhancement.

4 Distances, Galactic positions and evolutionary status
We have calculated distances to the stars as follows. Masses were derived by placing the stars in the effective temperature - surface gravity diagram using the evolutionary tracks of Schaller et al. (Sch92 (1992)). This allowed a calculation of the luminosity appropriate to the stars current evolutionary status, rather than assuming that the object is on the zero-age main sequence (ZAMS). The absolute visual magnitude was then determined employing the bolometric corrections of Kurucz (Kur79 (1979)). Extinctions were estimated from the measured values taken from Reed (reed93 (1993)), and the intrinsic colours of Deutschman et al. (Deu76 (1976)) for stars with these atmospheric parameters. The distance was finally calculated assuming a standard Galactic extinction law, i.e. with (Seaton Sea79 (1979)). We note that although our stars have relatively low values, their rotational velocities could be higher depending on the inclination viewing angle. Recent studies of the evolution of rotating stars (e.g. Heger & Langer heg2000 (2000), Maeder & Meynet maed2000 (2000)) indicate that their main-sequence properties maybe altered by rotation, however the differences predicted in the luminosities are smaller than the uncertainities in the rest of the distance calculation and do not significantly increase the aerror bar we calculate on the stellar distances.
The four B-type targets lie at significant distances below the plane of the Galaxy (see Table 8), and it is unlikely that they have formed at their current positions. The probable explanation is that they were born in the Galactic disk, and were then subsequently ejected. This class of early-type stars lying at, in some cases, significant distances from their formation sites (i.e. runaway stars) has been studied extensively, and their existence is well accepted (see Rolleston et al. roll99 (1999)). In a previous paper (Smartt et al. sdl97 (1997)) we have discussed the analysis of four blue supergiants lying at similar Galactic latitudes, and a full discussion of the possible origins and ejection mechanisms from the disk of these types of objects is presented. Leonard (Leo93 (1993)) has presented plausible mechanisms for early-type stars suffering large ejection velocities within massive binary evolution scenarios, or dynamical ejection from clusters. These can result in initial velocity injections of up to 350 kms-1, easily allowing our objects to reach their current estimated distance from the Galactic plane (z).
| Star | M | Tev | d⊙ | PRV | Vi | Rg | |
|---|---|---|---|---|---|---|---|
| (M⊙) | (Myrs) | (kpc) | (kpc) | (kms-1) | (kms-1) | (kpc) | |
| LS5130 | 102 | 24 | 6.91.0 | 0.7 | 7 | 64 | 3.11.0 |
| LS4419 | 112 | 205 | 5.21.0 | 0.5 | 28 | 45 | 2.91.0 |
| LS4784 | 82 | 275 | 3.81.0 | 0.4 | 30 | 36 | 4.71.0 |
| LS5127 | 102 | 255 | 9.11.0 | 1.2 | 3 | 98 | 2.51.0 |
In order to constrain the regions of the disk where these stars were formed, we follow the arguments of Smartt et al. (sdl97 (1997)). For each of the stellar spectra we have determined a radial velocity, and we compare this velocity to that expected if the stars were co-rotating with the disk at their current projected positions (assuming a flat rotation curve and R⊙ = 8.5 kpc, km s-1 from Kerr & Lynden-Bell ker86 (1986)). We calculate a peculiar radial velocity (PRV) which is the difference between these two, as a representative measure of the dynamics of the stars with respect to the Galaxy rotation. This PRV is only one component of the total peculiar space velocity, with the other two components unknown (directed along axes mutually perpendicular to the PRV). We assume that the second component of velocity is perpendicular to the Galactic plane (which, given the small Galactic latitudes of these stars is a reasonable assumption). House & Kilkenny (hou80 (1980)) have given an expression for the force field normal to the Galactic plane (), but this is probably only valid for kpc. Given that these stars have origins closer to the Galactic Centre, we have assumed a simple relation which is an approximation to the shape of the House & Kilkenny form of , but which is always greater in magnitude (with a peak of twice the House & Kilkenny maximum). We assume that within pc the force field is approximated by (with cms-2pc-1) and for pc then . Analytical expressions for the initial velocity (Vi) and time required for the stars to reach their present distance, could then be deduced. The initial ejection velocity perpendicular to the Galactic plane needs to be no more than 100 km s-1 (see Table 8) for these stars to reach their present positions, and significantly less for three of the objects. Velocities of this order are well within those plausible for common ejection methods (Leonard Leo93 (1993)). The PRV of each star is also relatively low, indicating that the initial space velocities of these stars were probably directed mostly in the -direction. However without proper motion information we cannot definitively constrain their space velocity. If we assume that the mean ejection velocity in the sample (V 60km s-1 ) is indicative of the maximum value of any one velocity component, then we can calculate a circular locus within which the star probably formed. In 20 Myrs, a star could have moved 1.7 kpc within (or parallel to) the Galactic disk, and this is a reasonable error on the birth sites of the stars.
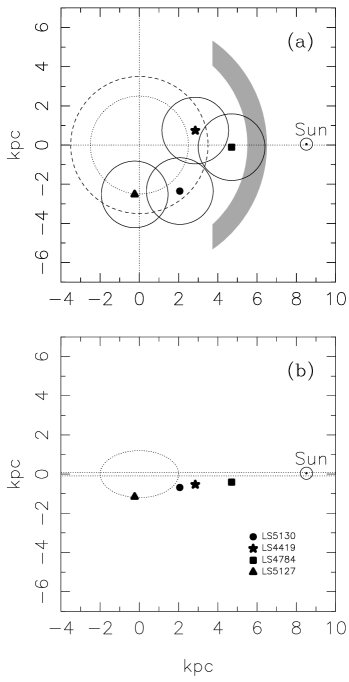
Figure 2 illustrates the estimated stellar birth sites and also schematically draws attention to features of Galactic structure in this region. Bertelli et al. (Bert95 (1995)) have discussed the possibility that a ‘stellar ring’ exists, which surrounds the Galactic Centre at a distance of 3.5 kpc, with a 0.5 kpc half-width. The nature of this ring is still somewhat uncertain, but Bertelli et al. claim that assuming it to be a region of increased stellar disk density would produce synthetic colour-magnitude diagrams closely matching those they have observed in fields towards the Galactic Centre. They suggest that it is associated with active star formation, and that the cross-section through this ring is at a maximum when viewed at . They further suggest that this is consistent with an observed peak in OH maser sources (Blommaert et al. blomm94 (1994)) around , a signature of relatively recent star formation. Whether this is a complete ring surrounding the inner Galaxy, or part of an inner spiral arm, is still debatable (Ortiz & Lépine ort93 (1993)). Clemens et al. (cle88 (1988)) have mapped the distribution of molecular gas in the first quadrant of the Galaxy, and found an H2 ring at approximately 4 kpc from the Centre. This would appear to correlate with the stellar ring found by Bertelli et al., but the latter suggest that the stellar and molecular ring are not necessarily co-incident. Rather that the molecular ring maybe the result of a “bow-shock of propagating star formation”.
Although some Galaxy models (Bahcall & Soneira 1980; Bahcall 1986) adopt a relation for the number density of disk stars which falls off exponentially with increasing distance from the Galactic Centre, it appears that at R2.5 kpc from the Galactic Centre there is a sharp decrease in the stellar disk density (Bertelli et al 1995, Paczynski et al. pacz94 (1994)). This has been interpreted as the transition between the disk and the bulge. Figure 2 suggests that the four B-type stars have their origins in this stellar ring, or where the molecular ring dynamics are causing current star formation. Indeed if there is a disk/bulge transition, early-type stars may be relatively rare within this inner region, although current and spectacular star formation is certainly on-going in the inner few hundred parsecs (Serabyn et al. 1998; Najarro et al. 1997). The above indicates that our B-type stars probably formed around R3.5 kpc in the Galactic disk and were subsequently ejected.
Carr et al. (carr2000 (2000)) have presented IR spectra of a red M-type supergiant (IRS7) lying in the central cluster, and compared the metal line spectra with that of a similar star in the solar neighbourhood. A differential abundance analysis of the star indicates that it has an Fe abundance very close to solar, and certainly does not appear metal enhanced in any significant way (although it does appear to show CNO-abundances typical of severe dredge-up after core H-burning). At first this may seem a surprising result given that one might expect a linear Galactic abundance gradient in the thin disk to keep rising towards the Centre, and that the central regions would thus show super-metal rich abundances. However there is lack of molecular gas, young stars and H ii regions within the inner 3.5 kpc, until one gets to the central cluster. Hence, whatever the evolutionary history of the massive stellar clusters at the Centre, it seems to have occurred independently of the Milky Way disk ( kpc). There is no reason therefore too assume that the disk and central cluster are chemically linked, and one should consider them as separate entities in evolutionary scenarios.
5 Discussion
5.1 The oxygen abundance gradient towards the Galactic Centre
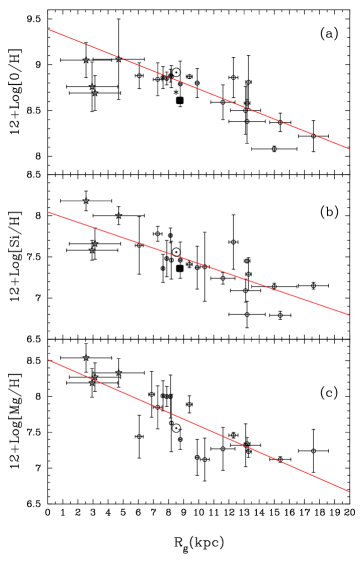
As discussed in Sections 3.1–3.4, all four stars have relatively normal oxygen abundances. If the oxygen abundance gradients derived in the solar neighbourhood and outer disk are extrapolated inwards (Smartt & Rolleston 1997, RSDR; 0.07 dex kpc-1) their O abundances would be 0.30.4 dex above the solar neighbourhood value. LS5130 and LS4419 show no evidence at all of oxygen-rich photospheres, and both sample the O ii line spectra extremely well, with 43 and 28 features measured respectively. If the statistical errors are normally distributed around the mean, then the random error in our mean differential abundance (; where is the standard deviation quoted in Tables 4 and 5) may be as small as 0.04 for both these stars. Furthermore, a systematic error in the atmospheric parameters significantly greater than that quoted in Table 7 would be required to make these stars O-rich which would have major consequences for the other elements and for the continuum fitting of the indices. The large number of O ii lines well observed in these stars and the possible error sources in Table 7 make this a robust result. The other two stars LS4784 and LS5127 show marginal evidence for oxygen abundances higher than their comparison stars, with standard errors of the mean 0.1 dex. However again these results appear to be incompatible with an O abundance that is 0.30.4 dex above solar. A number of previous authors have speculated that the oxygen abundance gradient (in particular) may steepen towards the Centre (Vílchez & Esteban vil96 (1996), Shaver et al. Sha83 (1983)). However, we can find no evidence that this is the case. Figure 3 shows the oxygen abundances of our stars together with those of the large Galactic B-star sample of RSDR. The low metallicity stars in the outer Galaxy ( kpc) are clearly evident, but between 69 kpc there is little evidence of O abundance variations. The four new stellar points toward the Centre accentuate this relation, and it would appear that the O abundance gradient in the Galaxy flattens off at around 9 kpc and does not significantly increase at smaller Galactocentric distances.

Afflerbach et al. (Aff97 (1997)) have carried out an extensive study of the N, S and O abundances in H ii regions with kpc. In Fig. 4, their O abundances are plotted together with those for our stars and the stellar sample of RSDR with kpc. The results from the H ii regions and the RSDR data-set in the outer Galaxy are in excellent agreement (see RSDR and Smartt sma2000 (2000) for further details). However differences appear at smaller Galactocentric distances. In particular while the H ii region data is consistent with a linear gradient 0.06 dex kpc-1, no significant variations are apparant for the B-stars. One possible explanation is that the zero-points for the two studies is somewhat different. For example, if the Afflerbach et al. data were shifted upwards by 0.2 dex (the difference in the mean results within kpc), then good agreement would be found within the solar neighbourhood, but the B-stars towards the Centre would not reflect the H ii region results. The cause of this discrepancy is unclear and appears to be limited to oxygen (see Sect. 5.2 and 5.3). We note that Afflerbach et al. is the only H ii region study of the inner Galaxy to quote oxygen abundances. Rudolph et al. (1997) were unable to independently determine S and O, while Shaver et al. (1983) point out that their two inner Galaxy objects ( 4 kpc) are somewhat peculiar, and that their radio and optical sources may not be the same. Afflerbach et al. have recalculated N abundances from the data of Simpson et al. (sim95 (1995)) and find differences of a factor of 2 in some of the highest metallicity regions. Additionally, on average there seems to be a 50% discrepancy in the sulphur abundances. Therefore it appears that the nebular abundances in the inner Galaxy require further study to constrain their absolute values, while a more extensive sample of B-stars is required. Smartt et al. (smt2000 (2000)) have discussed the problem of determining reliable absolute nebular abundances in regions of solar abundance and above in M31, and find significant discrepancies across different analysis methods.

In terms of effective radius (where kpc, from de Vaucouleurs & Pence dev78 (1978)), the break in the observed O abundance gradient occurs at . The spiral galaxy NGC2403 has been studied by Garnett et al. (gar97 (1997)) who estimated H ii region abundances at 12 points across the disk. In Fig 5 the oxygen abundance is plotted as a function of effective radius for both these galaxies. A similar gradient change may be present in NGC2403, although the sampling is relatively sparse. This would imply that a two component model for the radial variation of oxygen is not exclusive to our own Galaxy and suggests indirect evidence that it is a real effect. Certainly the data suggests that for both galaxies, at , there is little evidence for increasing oxygen abundances. However, the well studied galaxy M33 (Garnett et al. gar97 (1997), Henry & Howard hen95 (1995), Monteverde et al. mon2000 (2000)) which is similar in size, mass and metallicity to NGC2403 does not appear to show such a break. Additionally, M101 and NGC4303 are other examples of extensively studied galaxies (Kennicutt & Garnett ken96 (1996), Martin & Roy mart92 (1992)), with 3080 H ii region data points sampled in each. Neither show evidence for anything other than a linear relation across the whole disk.
5.2 Magnesium, Aluminium, Silicon and Sulphur abundances towards the Galactic Centre
The magnesium and silicon abundances for the Galactic Centre stars and the corresponding RSDR dataset are plotted in Fig 3. For oxygen and silicon we note that the absolute abundances derived in our two solar neighbourhood standard stars are similar to the mean of the RSDR data set within 1 kpc of the Sun. Hence the absolute results of the Galactic Centre stars are on a consistent scale to the rest of the data. However with Mg, the abundance derived in Peg and Her is 7.2 dex, whereas in RSDR the mean local value is 7.85 dex (again estimated from the mean of stellar values within 1 kpc of the Sun). The stars analysed in this paper have effective temperatures in the range K ,while the RSDR sample have a mean temperature of 25275 K and it is possible that the modelling of this line is temperature dependent. It is important to use homogeneous datasets when looking for abundance trends and that is indeed what was done in RSDR. They showed that although the zero-point of any particular abundance may be in the error, any gradient biasing is removed by using suitable sub-samples of stars. Hence to put the four Galactic Centre stars onto the same scale as RSDR, we have added 7.85 dex to their differential Mg abundances. This assumes that Peg, Her and the stars within 1 kpc of the Sun in RSDR have similar abundances and that any offset is due to temperature dependent modelling inaccuracies. It appears that the Galactic Centre stars are richer in Mg than their local counterparts (see also Sect 1). From Table 7 an underestimate of the microturbulence () in each star could reduce this Mg overabundance as it is based on a relatively strong line. However an increase in by 5 km s-1 or more in each star would be required. While observational uncertainties might cause a particular determination of to have such an error, there is no evidence that we have systematically underestimated the microturbulence in each star. The Mg abundance gradient in Fig. 3 hence appears to steadily increase towards the Centre. A value of dex kpc-1is derived by fitting all points, which is slightly larger the RSDR result, although they agree within the uncertainties.
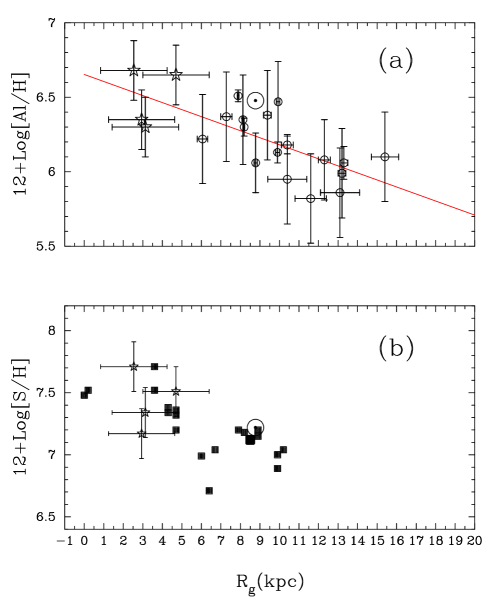
The silicon abundances of the Galactic centre stars are also plotted in Fig.3, and again appear compatible with a steadily increasing abundance gradient towards the centre. A fit through all the Si points gives a gradient of dex kpc-1, again in good agreement with the RSDR value for the outer Galaxy only. The differential abundances derived for each star are between 0.30.6 dex higher than their respective standards, strongly supporting the idea that these stars are richer in Si than solar neighbourhood material. In Fig. 6 the Al abundances of the galactic Centre stars are plotted again with the data from RSDR. Aluminium appears to increase steadily toward the Centre, and a gradient of dex kpc-1 is derived from the whole data set, similar to that produced by RSDR for the anti-centre direction.
Sulphur abundances for our stars are also available, although we have no similar data at greater radii from RSDR. In Fig 6 our stellar abundances are compared with with those from Afflerbach et al. (1997). Reasonable agreement is found with these stars appearing to be S-rich and having abundances similar to those found in nebular studies towards the Centre (although the caveat regarding the nebular absolute values discussed in the previous section may be important).
The correlation of of O, Mg, and Si abundances found in the outer Galaxy (see RSDR) and in the low metallicity Magellanic Clouds (Rolleston et al. roll96 (1996)) is theoretically expected as these elements are all produced and returned to the ISM through supernovae Type II. One would expect that this trend should continue towards the inner Galaxy, and it is surprising that our O abundances show no sign of increase, while Mg and Si appear significantly higher than their comparison stars. The S abundances in these stars are also higher than normal, although the dataset is somewhat less robust given the weakness of the absorption features of this element.
Prantzos et al. (pra94 (1994)) have investigated the effect of metallicity dependent yields (taken from the model calculations of Maeder mae92 (1992)) on the galactic chemical evolution of C and O and concluded that oxygen yields from massive stars tend to decrease towards higher metallicities. This is due to mass loss in low metallicity stars, resulting in most of the star’s mass being retained up until the final explosion. However, at high metallicities significantly more mass is ejected in the stellar wind (which is rich in helium and carbon), and leaves a smaller mass fraction which can be converted into oxygen. The relatively high carbon and low oxygen abundances derived here are in qualitative agreement with the situation predicted by these models. A full study of the evolution of elements heavier than oxygen has not been undertaken using metallicity dependent yields. However Maeder (1992) has discussed how the combined yield of “heavy elements” (defined as Ne, Mg, Si, S, Ca & Fe) from massive stars varies with original metal composition. Interestingly, he finds that the “heavy element” contributions of the stellar models at high metallicity () are not as low as is the case for oxygen. The situation is further complicated by the fact that chemical yields are dependent on the conditions for black hole formation since the final yield of a pre-supernova massive star (pictured in the conventional onion-skin model) depends on what fraction of the stellar layers are retained during core collapse.
The observational findings presented here should provide a stimulus to investigations of the evolution of the Galaxy at high metallicities, given the probability that stellar yields are highly variable with metallicity, and dependent on the limits of black hole formation. Furthermore, we should attempt to determine the true quantitative variation in the ratios of the -elements in the inner Galaxy to investigate if this trend is real. The recent chemical evolution models of Portinari & Chiosi (por99 (1999), por2000 (2000)) do indicate that the O abundance gradient may indeed flatten off in the region kpc, which is encouraging. However their SN Type II yields would suggest that the other -processed elements (Mg and Si) should follow a similar trend, which we do not observe. Boissier & Prantzos (bois99 (1999)) also suggest that their evolutionary models for the Milky Way predict a flattening of the metallicity gradient with time, and that saturation is reached in the inner Galaxy. This is in reasonable quantitative agreement with what we find for oxygen abundances, but does not explain the behaviour of the other elements.
5.3 Carbon and nitrogen abundances towards the Galactic Centre
Each of the four stars do appear to have nitrogen abundances significantly higher than their solar neighbourhood counterparts. The result for LS5130 is more marginal than the others, but with 19 features measured an error in the mean () of 0.03 dex would suggest that the enrichment is real although small. Figure 4(b) shows the nitrogen abundances of the Galactic Centre stars plotted along with a sample of stars from RSDR, and the H ii regions from Afflerbach et al. (1997). The gradient found in RSDR appears to continue towards the Centre; certainly the abundance estimates do not appear to flatten as for oxygen. Reasonably good agreement with the absolute values of the H ii region analyses is found, and we calculate quite a significant gradient for N/O. The full sample of RSDR yielded a gradient in N/O of dex kpc-1, and this is increased slightly by the inclusion of the four Galactic Centre stars. The latter effect is clearly due to the stars showing enhanced nitrogen in their atmospheres, but normal oxygen. We have previously discussed the possibility of N-rich core gas contaminating the surface of young massive stars, and hence polluting the natal photospheric material (RSDR). However due to the lack of a strong anti-correlation of C and N, RSDR found no evidence for such contamination and the same argument holds for the four stars analysed here.

An explanation of the N/O gradient was discussed in RSDR, based on the original ideas of Vila-Costas & Edmunds (vil93 (1993)). At metallicities higher than O/H 8.3, N/O would be proportional to O/H, because N enrichment would be dominated by secondary production, i.e. from C and O seed nuclei in the natal interstellar material through the CNO-cycle. Primary production would play a minimal role in contributing to the ISM abundance of N, and simple closed-box models in which the production of N is dominated by secondary production do predict a linear trend. At low metallicities the secondary component becomes less important (due to its inherent dependence on metallicity), and the dominant mechanism for the production of nitrogen is primary. The metallicity at which this happens is around 8.3 dex, close to the value found in the outer most regions of the Galactic disk. These ideas stem from the fact that the N/O ratios in low metallicity dwarf galaxies show a very large scatter, with little discernable trend. As primary nitrogen orginates in low-intermediate mass stars there is a time delay between is enrichment and that of primary oxygen (from short-lived massive stars), hence the scatter at low metallicitities is often interpreted as time dependent delays between oxygen and nitrogen enrichments. However at the high metallicities we are dealing with, it is likely that secondary production (in massive stars is dominant), and there would thus be no delay between N and O production. Our N/O ratios toward the Galactic Centre tend to support the conclusions of RSDR that the N/O gradient in the Galaxy is real, and due to secondary N production dominating across the disk.
In Fig.7 carbon abundances for the four Galactic Centre stars and from the RSDR compilation are plotted. As three of our new points are C-rich, it is not surprising that the abundances appears to steadily increase toward the Centre. As discussed for nitrogen, because the stars are not rich in oxygen the C/O ratio is greater than normal, hence producing a larger (and statistically more significant) gradient than that given in RSDR. As discussed by Maeder (1992) this would be consistent with C being produced at a greater rate than O in metal-rich stars (Section 5.2), due to the increased mass-loss in the post He-burning phase.
6 Conclusions
The analysis of high-quality data for four blue stars lying towards the Galactic Centre, and a comparison with young stars throughout the Galactic disk, leads to the following conclusions
-
1.
The four stars appear to be normal, young, massive, early B-type stars. They lie slightly out of the Galactic plane and their calculated distances indicate that they are at distances from the disk of kpc. A kinematic analysis indicates that they were probably born in the disk within kpc of the Galactic Centre and then subsequently ejected. Comparison with Galactic structure models suggests they may have originated in the stellar or molecular ring at kpc.
-
2.
A differential line-by-line abundance analysis of the four stars with two bright stars near the Sun indicates a surprising abundance pattern:
-
•
Two of the stars (LS5130 and LS4419) have oxygen abundances very similar to stars in the solar neighbourhood. The other two (LS4784 and LS5130) show only marginal evidence for enhanced oxygen. In all cases any enhancement is significantly below the dex that would be expected given the Galactic position of the stars and the gradient from RSDR. Oxygen is a very reliably determined abundance in these particular types of stars.
-
•
The relatively well measured abundances of Si, Al, Mg and S however do indicate that these stars have enhanced abundances in most other elements. However, the physical cause of the natal gas having a “normal” oxygen content and enriched -processed elements is unclear. The Si and Mg abundances are consistent with the continuation of the linear gradient derived by RSDR for stars in the solar neighbourhood and the outer Galaxy.
-
•
The four stars also appear rich in both C and N, again in agreement with a continuation of the RSDR gradients towards the Centre.
-
•
We discuss the possible errors in our analysis, and conclude that it is unlikely that these stars have higher oxygen abundances than those typically found in the solar neighbourhood. It is also very likely they are rich in all the other elements studied (C, N, Mg, Si, S, Al) although the physical pocesses that produces such a pattern is unclear.
-
•
Appendix A: Table 9 and 10 are the lists of equivalent widths of all metal lines measured in the spectra of the Galactic centre stars and the standards Her, and Peg. and is available electronically
Acknowledgements.
Spectroscopic data were obtained at the Anglo-Australian Observatory in Siding Spring, New South Wales and the ESO 3.6m Telescope on La Silla. We also obtained photoelectric photometry on the 0.5m in South Africa, and CCD photometry on the 1.5m Danish Telescope in La Silla. We are grateful to the staff at all observatories for their assistance. We are particularly grateful to Dave Kilkenny at SAAO who provided urgent initial photometry, which allowed some of this work to be incorporated into S. Smartt’s PhD thesis. Data reduction was performed on the PPARC funded Northern Ireland STARLINK node, and some of the model atmosphere programs were made available through the PPARC supported Collaborative Computational Project No. 7. We made use of the SIMBAD database maintained at CDS, Strasbourg. We acknowledge financial support for this work from the British Council and the Deutscher Akademischer Austauschdienst in the context of the British-German Academic Research Collaboration initiative, and also the Visiting Fellowship program at Queen’s University which allowed travel for SJS to further discussions. SJS and WRJR acknowledge funding from the PPARC. KAV would like to acknowledge travel and observing support by ESO, and to thank the Henry Luce Foundation for research funds through a Clare Boothe Luce professorship award.References
- (1) Afflerbach A., Churchwell E., Werner M.W., 1997 478, 190
- (2) Anders E., Grevesse N., 1989, Geochim. Cosmochim. Acta 53, 197
- (3) Bahcall J.N., 1986, ARA&A 24, 577
- (4) Bahcall J.N., Soneira R.M., 1980, ApJS 44, 73
- (5) Baldwin J.A., Ferland G.A., Martin P.G., et al. 1991, ApJ 374, 580
- (6) Bertelli G., Bressan A., Chiosi C., Ng Y.K., Ortolani S., 1995, A&A 301, 381
- (7) Blommaert J.A.D.L., Langevelde van H.J., Michiels W., 1994, A&A 287, 479
- (8) Brown P.J.F., 1987, PhD Thesis, Queens University of Belfast
- (9) Boissier S., Prantzos N., 1999, MNRAS 307, 857
- (10) Cardelli J.A., Meyer D.M., Jura M., Savage B.D., 1996, ApJ 467, 334
- (11) Carr J.S., Sellgren K., Balachandran S.C., 2000, ApJ 530, 307
- (12) Carraro G., Ng Y.K., Portinari L., 1998, MNRAS 296, 1054
- (13) Clemens D.P., Sanders D.B., Scoville N.Z., 1998, ApJ 327, 139
- (14) Cunha K., Lambert D., 1994, ApJ 426, 170
- (15) Davis L.E., 1994, A Reference Guide to the iraf/daophot Package, NOAO Laboratory
- (16) Deutschman W.A., Davis R.J., Schild R.E., 1976, ApJS 30, 97
- (17) de Vaucouleurs G., Pence W. D., 1978, AJ 83, 1163
- (18) Edvardsson B., Andersen J., Gustafsson B., et al. 1993, A&A 75, 101
- (19) Fich M., Silkey M., 1991, ApJ 366, 107
- (20) Fitzsimmons A., Dufton P.L., Rolleston W.R.J., 1992, MNRAS 259, 489
- (21) Fuhrmann K., 1998, A&A 338, 161
- (22) Garnett D.R., Shields G.A. Skillman E.D., Sagan S.P., Dufour R.J., 1997, ApJ 489, 63
- (23) Gies D.R., Lambert D.L., 1992, ApJ 387, 673
- (24) Grevesse N., Noels A., 1993 in Origin and Evolution of the Elements, ed. N. Prantzos, E. Vangioni-Flam, & M. Casse (Cambridge: Cambridge Univ. Press), 14
- (25) Gummersbach C.A., Kaufer A., Shäfer D.R., Szeifert T., Wolf B., 1998, A&A 338, 881
- (26) Henry R. B. C., Howard J. W., 1995, ApJ 438, 170
- (27) Heger A., Langer N., 2000, ApJ in press, (astro-ph/0005110).
- (28) House F., Kilkenny D., 1980, A&A 81, 251
- (29) Howarth I.D., Murray J., Mills D., Berry D.S., 1998 Starlink User Notice, No.50.21
- (30) Israelian G., Garcia Lopez R.J., Rebolo R., 1998, ApJ 507, 805
- (31) Jeffery C.S., 1991, in: Newsletter on Analysis of Astronomical Spectra No. 16, pg. 17
- (32) Kennicutt R.C., Garnett D.R., 1996, ApJ 456, 504
- (33) Kerr F.J., Lynden-Bell D., 1986, MNRAS 221, 1023
- (34) Kilian J., 1994, A&A 282, 867
- (35) Kilkenny D., Balona L.A., Carter D.B., Ellis D.T., Woodhouse G.F.W., 1998, MNASSA 47, 69
- (36) Kurucz R.L., 1979, ApJS 40, 1
- (37) Kurucz R.L., 1991, in Precision Photometry: Astrophysics of the Galaxy, ed. A.G. Davis-Philip, A.R. Upgren, & P.L. Janes (Schenectady:Davis)
- (38) Leonard P. J. T., 1993, in Luminous High-Latitude stars, ed. D. Sasselov (San Francisco:ASP)
- (39) Lester J.B., Gray R.O., Kurucz R.L., 1986, ApJS 61, 509
- (40) Maciel W. J., Quireza 1999, A&A 345, 629
- (41) Maciel W.J., Köppen J., 1994, A&A 282, 43
- (42) Maeder A., 1992, A&A 264, 105
- (43) Maeder A., & Meynet G., 2000, astro-ph/0006405
- (44) Martin P., Roy J.-R., 1992, ApJ 397, 63
- (45) Massey P., 1992, A User’s Guide to CCD Reductions with iraf, NOAO Laboratory
- (46) Matteucci F., Francois P., 1989, MNRAS 239, 885
- (47) Matteucci F. & Chiappini C., 1999, in Proc. ESO Conf. on Chemical Evolution from Zero to High Redshift, Springer Conference Series, eds. J. Walsh & M. Rosa
- (48) Meyer D. M., Jura M., Cardelli J. A., 1998, ApJ 493, 222
- (49) Monteverde I., Herrero A.H., Lennon D.J., 2000, ApJ, submitted
- (50) Mooney C.J., Rolleston W.R.J., Keenan F.P., et al. 2000, A&A 357, 553
- (51) Najarro F., Krabbe A., Genzel R., et al. 1997, A&A 325, 700
- (52) Napiwotzki R., Schonberner D., Wenske V., 1993, A&A 268, 653
- (53) Ortiz R., Lépine J.R.D., 1993, A&A 279, 90
- (54) Paczynski B., Stanek K.Z., Udalski A., et al. 1994, AJ 107, 2060
- (55) Pagel B.E.J., Tautvaišinė G., 1995, MNRAS 276, 505
- (56) Peters G.J., 1976, ApJS 30, 551
- (57) Pilyugin L.S., Edmunds M.G., 1996 A&A 313, 792
- (58) Portinari L., Chiosi C., 1999, A&A 350, 827
- (59) Portinari L., Chiosi C., 2000, A&A 355, 929
- (60) Prantzos N., Vangioni-Flam E., Chauveau S., 1994, A&A 285, 132
- (61) Prantzos N., Aubert O., 1995, A&A 302, 69
- (62) Reed B.C., Beatty A.E., 1995, ApJS 97, 189
- (63) Reed B.C., 1993, ApJS, 87, 367
- (64) Rolleston W.R.J., Smartt S.J., Dufton P.L., Ryans R.S.I., 2000, A&A, in press
- (65) Rolleston W.R.J., Hambly N.C., Keenan F.P., Dufton P.L., Saffer R.A., 1999, A&A 347, 69
- (66) Rolleston W.R.J., Hambly N.H, Dufton P.L., et al. 1997, MNRAS 290, 422
- (67) Rolleston W.R.J., Brown P.J.F., Dufton P.L., Howarth I.D., 1996, A&A 315, 95
- (68) Ryans R.S.I, Hambly N.C., Dufton P.L., Keenan F.P., 1996, MNRAS 278, 132
- (69) Rudolph A.L., Simpson J.P., Haas M.R., Erickson E.F., Fich M., 1997, ApJ 489, 94
- (70) Seaton M.J., 1979, MNRAS 187, 73
- (71) Serabyn E., Shupe D., Figer D., 1998, Nature 394, 448
- (72) Schaller G., Schaerer D., Meynet G., Maeder A., 1992, A&AS 96, 269
- (73) Shaver P.A., McGee R.X., Newton M.P., Danks A.C., Pottasch S.R., 1983, MNRAS 204, 53
- (74) Shortridge K., Meyerdierks H., Currie M., Clayton M., Lockley J., 1997, Starlink User Note 86.14
- (75) Simpson J. P., Colgan S. W. J., Rubin R. H., Erickson E. F., Haas M. R., 1995, ApJ 444, 721
- (76) Smartt S.J., Rolleston W.R.J., 1997, ApJ 481, L47
- (77) Smartt S.J., Dufton P.L., Lennon D.J., 1997, A&A 326, 763
- (78) Smartt S.J., Dufton P.L., Rolleston W.R.J. 1996, A&A 305, 164
- (79) Smartt S.J., 2000, in The Chemical Evolution of the Milky Way: Stars vs. Clusters, Rome-Trieste Workshop, es F. Matteucci, F. Giovanelli
- (80) Smartt S.J., Crowther P.A., Dufton P.L., et al., 2000 MNRAS, to be submitted
- (81) Snow T.P., Witt A.N., 1996, ApJ 468, L65
- (82) Stephenson C.B., Sanduleak N., 1971, Publ. Warner & Swasey Obs., 1, 1
- (83) Venn K.A, Smartt S.J., Lennon D.J., Dufton P.L., 1998, A&A 334, 987
- (84) Vílchez J. M., Esteban C., 1996, MNRAS 280, 720
- (85) Vila-Costas M. B., Edmunds M. G., 1993, MNRAS 265, 199
| Species and Line | LS5130 | LS4419 | LS4784 | Peg |
|---|---|---|---|---|
| O ii 3911.96 | 57a | 96c | 76b | 50a |
| C ii 3918.98 | 138a | 130a | 261a7 | – |
| N ii 3919.01 | ||||
| O ii 3919.28 | ||||
| C ii 3920.69 | 127a | 113a | – | – |
| O ii 3945.04 | 30b | 63b | 58c | – |
| O ii 3954.37 | 51a | 63b | 74b | 48a |
| He i 3964.73 | 177a | 187a | 188a | 155a |
| O ii 3982.72 | 29c | 72b1 | 60a1 | 31a |
| S iii 3983.77 | 28c | – | – | 14a |
| N ii 3995.00 | 102a | 104a | 93a | 78a |
| N ii 4035.08 | 35b | 46a | 42c | 25a |
| N ii 4041.31 | 44b | 51a | 60b | 37a |
| O ii 4069.62 | 95a | 115a | 97b | 94 |
| O ii 4069.89 | ||||
| O ii 4072.16 | 62a | 75a | 43c | 65a |
| C ii 4074.48 | 48b | 147a2 | 141b2 | 42a |
| C ii 4074.85 | ||||
| C ii 4075.85 | ||||
| O ii 4075.86 | 124a | – | – | – |
| C ii 4076.53 | ||||
| N ii 4076.91 | ||||
| O ii 4078.84 | 24c | 19c | – | 26a |
| O ii 4085.11 | 32c | 39b | 34b | 26a |
| O ii 4087.15 | 22c | – | – | 12a |
| Si iv 4088.85 | 37c | 44b | 61a | – |
| O ii 4089.28 |
| Species and Line | LS5130 | LS4419 | LS4784 | Peg |
|---|---|---|---|---|
| Si iv 4116.10 | 20c | – | – | – |
| O ii 4119.22 | 62a | – | – | – |
| O ii 4120.28 | 291a | – | – | – |
| He i 4120.81 | ||||
| He i 4120.99 | ||||
| O ii 4121.46 | ||||
| Si ii 4128.07 | 53a | 38c | 65b | 33a |
| Si ii 4130.89 | 54a | 86c3 | 70c3 | 34a |
| Ar ii 4131.71 | 38b | – | – | 17a |
| O ii 4132.80 | 33b | – | 54c3 | 30a |
| Al iii 4149.50 | – | 56b | 64a | – |
| Al iii 4150.14 | – | |||
| S ii 4153.10 | 60a | 125b | 105a | – |
| O ii 4153.30 | ||||
| S ii 4162.70 | 47b | – | – | – |
| Fe iii 4164.79 | 45c | 32b | – | |
| Fe iii 4166.86 | 26c | – | – | 13a |
| He i 4168.97 | 99a | 99a | 104a | – |
| O ii 4169.22 | ||||
| S ii 4174.24 | 40b | 28c | – | – |
| N ii 4179.67 | 14c | 21c | – | – |
| O ii 4185.45 | 36b | 43b | – | 30a |
| O ii 4189.79 | 46b | 54b | 65b | – |
| P iii 4222.15 | 21c | 20c | – | 21a |
| N ii 4227.74 | 30b | 55b | 61b | 18a |
| N ii 4236.86 | 51a | 55a | 66c | 28a |
| N ii 4236.98 | ||||
| N ii 4241.78 | 49a | 86a | 105b | – |
| Species and Line | LS5130 | LS4419 | LS4784 | Peg |
|---|---|---|---|---|
| S iii 4253.59 | – | 118a | – | – |
| O ii 4253.90 | ||||
| O ii 4254.13 | ||||
| C ii 4267.02 | 262a | 245a | 305a | – |
| C ii 4267.27 | ||||
| O ii 4267.71 | ||||
| O ii 4275.56 | – | 97b | 123a8 | – |
| O ii 4277.40 | – | 72b | – | 16a |
| S iii 4284.99 | – | – | 47c | 28a |
| S ii 4294.43 | 35b | 50b | 37c | – |
| O ii 4294.79 | ||||
| O ii 4303.84 | 30c | 62a | 54c | 26a |
| C ii 4313.30 | 17c | – | – | – |
| O ii 4317.14 | 58a | 76a | 64b | 56a |
| C ii 4317.26 | ||||
| O ii 4319.63 | 48a | 78a | 63b | 52a |
| O ii 4325.76 | 40b | 23b | 29c | 20a |
| O ii 4345.56 | 30c | – | – | 24a |
| O ii 4347.42 | 26c | – | – | 21a |
| Ar ii 4348.11 | 32c | – | – | – |
| O ii 4349.43 | 66b | – | – | 63a |
| O ii 4351.26 | 31c | – | – | 41a |
| O ii 4366.89 | 60a | 61a | 32c | 48a |
| O ii 4369.27 | – | – | – | 14a |
| C ii 4372.49 | 52a | 91a | 67c9 | – |
| C ii 4374.27 | 32b | – | – | – |
| Species and Line | LS5130 | LS4419 | LS4784 | Peg |
|---|---|---|---|---|
| Fe iii 4395.78 | 40b | 60a | 58b | – |
| O ii 4395.94 | ||||
| C ii 4411.20 | 38b | 63b | – | – |
| C ii 4411.52 | ||||
| O ii 4414.90 | 84a | 95a | 52c | 75a |
| O ii 4416.97 | 64a | 76a | 28c | 61a |
| Fe iii 4419.59 | 44b | 32c | 35c | 34a |
| Fe iii 4430.95 | 33c | – | 39c | 24a |
| N ii 4432.74 | 38c | – | 51c | 20a |
| He i 4437.55 | 126a | 103a | 135a | 118a |
| N ii 4442.02 | – | – | 38c | 9a |
| N ii 4447.03 | 60a | – | 72b | 15a |
| O ii 4448.19 | ||||
| O ii 4452.37 | 31c | – | 29c | 25a |
| Al iii 4479.89 | 55a | – | – | 38a |
| Al iii 4479.89 | ||||
| Mg ii 4481.13 | 202a | 196a | 265a | 160a |
| Mg ii 4481.33 | ||||
| Al iii 4512.54 | 57a | 65a | 63a | 39a |
| Al iii 4528.91 | 73a | 144a10 | 135a10 | 66a |
| Al iii 4529.20 | ||||
| N ii 4530.40 | 29c | – | – | 25a |
| N ii 4552.53 | 174a | 199a | 187a | 114a |
| Si iii 4552.62 | ||||
| Si iii 4567.82 | 150a | 152a | 151a | 102a |
| Si iii 4574.76 | 81a | 97a | 90a | 69a |
| O ii 4590.97 | 52a | 87a | 67a | – |
| O ii 4596.18 | 59a | 74a | 52a | 47a |
| N ii 4601.48 | 62b | 107a | 90a | 37a |
| O ii 4602.13 | 15a |
| Species and Line | LS5130 | LS4419 | LS4784 | Peg |
|---|---|---|---|---|
| N ii 4607.16 | 56a | 64a | 68a | 35a |
| O ii 4609.44 | 41b | 63a | 50a | 30a |
| N ii 4613.87 | 55a | 79a | 56a | 27a |
| C ii 4618.40 | 137c | 82a | 213a11 | – |
| C ii 4619.23 | ||||
| N ii 4621.29 | 41b | 73a | – | 26a |
| N ii 4630.54 | 92a | 122a | 123a | |
| O ii 4638.86 | 61b | 81a | 71a | 54a |
| O ii 4641.82 | 74b | 171a4 | 172a4 | 76a |
| N ii 4643.09 | 58b | – | – | 42a |
| C iii 4647.42 | – | 230a 5 | 192a5 | – |
| O ii 4649.14 | 90a | – | – | 92a |
| O ii 4650.84 | 64b | – | – | 52a |
| O ii 4661.63 | 67a | 94a | 75a | 54a |
| O ii 4673.74 | 26c | – | – | 19a |
| O ii 4676.24 | 44c | 45c | – | 46a |
| N ii 4678.10 | 24c | – | – | – |
| N ii 4694.70 | 15c | – | – | 9a |
| O ii 4696.35 | 15c | – | – | 12a |
| O ii 4699.00 | 42a | 69c | 37a | – |
| O ii 4699.22 | ||||
| O ii 4703.16 | – | 66a5 | 53a5 | – |
| O ii 4705.35 | 47b | – | – | – |
| O ii 4710.01 | 30b | 40c | – | 20a |
| He i 4713.14 | 289a | 283a | 250a | 271a |
| He i 4713.37 |
| Species and Line | LS5130 | LS4419 | LS4784 | Peg |
|---|---|---|---|---|
| Si iii 4716.65 | 41b | 52b | – | 12a |
| N ii 4779.67 | 18c | 36c | 44b | 10a |
| C ii 4802.70 | 28c | – | – | 15a |
| N ii 4803.29 | 37c | 61a | 74a | 18a |
| Ar ii 4806.07 | 29c | 21c | – | 18a |
| Si iii 4813.30 | 31b | 41a | 75b12 | 21a |
| S ii 4815.52 | 54b | 27b | – | 27a |
| Si iii 4819.72 | 55b | 55a | 50a | 40a |
| S ii 4824.07 | 12c | – | 18c | – |
| Si iii 4828.96 | 44b | 64a | 59a | – |
| Ar ii 4879.14 | 28b | – | 19c | – |
| O ii 4890.93 | 21c | 22b | – | 11a |
| O ii 4906.83 | 38b | – | 29b | – |
| O ii 4941.07 | 25b | 38b | 14c | 15a |
| O ii 4943.00 | 39b | 52b | 45c | 28a |
| S ii 4991.94 | 16c | – | 24c | 22a |
| N ii 4994.36 | 31b | 55a | 59b | – |
| S ii 5009.62 | 32b | – | – | – |
| N ii 5010.62 | 40b | 40c | – | – |
| S ii 5014.03 | 52b | – | – | – |
| He i 5015.68 | 322a | 319a | 354a | – |
| S ii 5032.41 | 66b | 56a | 91a | – |
| Si ii 5041.03 | 24c | – | 30c | 15a |
| Species and Line | LS5130 | LS4419 | LS4784 | Peg |
|---|---|---|---|---|
| N ii 5045.09 | 54b | 59a | 47c | – |
| He i 5047.74 | 207a | 163a | 179b | – |
| Si ii 5055.98 | 35c | – | 56b | 22a |
| Si ii 5056.31 | ||||
| S ii 5103.30 | – | – | 20c | – |
| C ii 5132.96 | 97a | 74a | 99a | – |
| C ii 5133.29 | ||||
| O ii 5159.94 | 23a | 38a | 37a | – |
Notes:
1. Blend of O ii 3982.72 and S iii 3983.77.
2. Includes the O ii, N ii and C ii lines at
4075–4076 AA.
3. Blended with Ar ii 4131.71.
4. Blended with N ii 4643.09.
5. Blended with O ii 4649.14 & 4650.84.
6. Blended with O ii 4705.35.
7. Also includes C ii 3920.69.
8. Blended with O ii 4277.40.
9. Blended with C ii 4374.27.
10. Blended with N ii 4530.40.
11. Blended with N ii 4621.29 .
12. Blended with S ii 4815.52.
| Species and Line | LS5127 | Her |
|---|---|---|
| O ii 3911.96 | 50c | 12a |
| C ii 3918.98 | 340b | 72a |
| N ii 3919.01 | – | |
| O ii 3919.28 | 8a | |
| C ii 3920.69 | 88a | |
| O ii 3954.37 | 44c | 20a |
| He i 3964.73 | 210c | 132a |
| N ii 3995.00 | 108a | 40a |
| N ii 4041.31 | 57b | 19a |
| N ii 4043.53 | 59b | 9a |
| O ii 4069.62 | 182a | 16a |
| O ii 4069.89 | 19a | |
| O ii 4072.16 | 27a | |
| C ii 4074.48 | 185a | 15a |
| C ii 4074.85 | 9a | |
| O ii 4075.86 | 32a | |
| C ii 4076.53 | – | |
| N ii 4076.91 | – | |
| O ii 4119.22 | 324a | – |
| O ii 4120.28 | ||
| He i 4120.81 | ||
| He i 4120.99 | ||
| O ii 4121.46 | ||
| Fe iii 4122.06 | ||
| Fe iii 4122.98 | ||
| He i 4168.97 | 70b | 81a |
| N ii 4241.78 | 67a | 16a |
| S iii 4253.59 | 69a | 13a |
| O ii 4253.90 | 4a | |
| O ii 4254.13 | 2a | |
| C ii 4267.02 | 338a | 184a |
| C ii 4267.27 | ||
| O ii 4267.71 | ||
| Si iii 4267.80 | 26a |
| Species and Line | LS5127 | Her |
|---|---|---|
| S ii 4294.43 | 43a | 24a |
| O ii 4294.79 | 3a | |
| O ii 4303.84 | 39a | 9a |
| O ii 4325.76 | 55c | 6a |
| C ii 4325.83 | – | |
| C ii 4326.16 | – | |
| S iii 4361.53 | 39c | 4a |
| O ii 4366.89 | 42c | 16a |
| C ii 4372.49 | 48c | – |
| Fe iii 4395.78 | 43b | 15a |
| O ii 4414.90 | 101b | 28a |
| O ii 4416.97 | 23a | |
| Fe iii 4419.59 | 53a | 23a |
| He i 4437.55 | 101a | 102a |
| N ii 4447.03 | 65b | 18a |
| S ii 4463.58 | 36b | 14a |
| Mg ii 4481.13 | 423a | 205a |
| Mg ii 4481.33 | ||
| Al iii 4512.54 | 60a | 20a |
| S ii 4524.95 | 47b | 22a |
| Al iii 4528.91 | 100b | 6a |
| Al iii 4529.20 | 28a | |
| N ii 4530.40 | 7a |
| Species and Line | LS5127 | Her |
|---|---|---|
| Fe ii 4549.47 | 49b | – |
| S ii 4552.38 | 191a | 71a |
| Si iii 4552.62 | ||
| Si iii 4567.82 | 156a | 59a |
| Si iii 4574.76 | 93a | 27a |
| Fe ii 4583.83 | 39b | 12a |
| O ii 4590.97 | 39c | 17a |
| O ii 4596.18 | 32c | 12a |
| N ii 4601.48 | 49c | 15a |
| N ii 4607.16 | 47c | 14a |
| C ii 4618.40 | 114c | – |
| C ii 4619.23 | ||
| N ii 4621.29 | ||
| Si ii 4621.42 | ||
| Si ii 4621.72 | ||
| Fe ii 4629.34 | 107a | – |
| N ii 4630.54 | ||
| O ii 4638.86 | 43a | 21a |
| O ii 4641.82 | 108a | 24a |
| N ii 4643.09 | 17a | |
| S ii 4648.17 | 170a | 5a |
| O ii 4649.14 | 34a | |
| O ii 4650.84 | 17a | |
| S ii 4656.74 | 26b | 10a |
| O ii 4661.63 | 65b | 15a |
| Al iii 4663.05 | 13a | |
| He i 4713.14 | 306a | 239a |
| He i 4713.37 | ||
| Si iii 4813.30 | 81b | 8a |
| S ii 4815.52 | 40a | |
| Si iii 4819.72 | 47c | – |
| Species and Line | LS5127 | Her |
|---|---|---|
| S ii 5014.03 | 522a | 38a |
| He i 5015.68 | 233a | |
| S ii 5032.41 | 128a | 47a |
| Si ii 5041.03 | 85a | 42a |
| N ii 5045.09 | 190a | |
| S ii 5047.28 | ||
| He i 5047.74 | ||
| Si ii 5055.98 | 182a | 82a |
| Si ii 5056.31 |