The So-Called “Bar” in the Large Magellanic Cloud
Abstract
We propose that the off-centered “bar” in the Large Magellanic Cloud (LMC) is an unvirialized structure slightly misaligned with, and offset from, the plane of the LMC disk. The small displacement and misalignment are consequences of recent tidal interactions with the SMC and the Galaxy. This proposal, though radical, is consistent with the kinematics of the LMC and near-infrared star count maps from the DENIS and 2MASS surveys. It does not violate any of the observational limits on the depth and structure of the LMC – in particular, the reported inclination range of the LMC and the east-west gradient of distance moduli of standard candles. Contributions to LMC microlensing come from the mutual lensing of stars in the disk and the “bar”, as well as self-lensing of the disk and the “bar”. The microlensing optical depth of such configurations from self-lensing alone lies between , which is comparable to the observed microlensing signal reported by the EROS and MACHO groups. Possible observations are suggested to discriminate between our misaligned, offset “bar” model and the conventional picture of an off-centered, planar bar.
1 Introduction
By now, self-lensing is very well-established as a main cause of the high optical depths towards the Galactic Center (Kiraga & Paczyński 1994, Zhao, Spergel & Rich 1995, Evans 1995). Also, there is ample evidence that the Small Magellanic Cloud (SMC) itself provides the lenses for the two events (MACHO 97-SMC-1 and MACHO 98-SMC-1) seen in this direction (Alcock et al. 1997, Afonso et al. 1998, Sahu & Sahu 1998). So, the Large Magellanic Cloud (LMC) seems something of an anomaly, as the estimates of its self-lensing optical depth appear to be too low to account fully for the entire microlensing optical depth (Gould 1995). Even so, there are tantalising hints that perhaps two of the events do indeed reside within the LMC, namely MACHO-LMC-1a and MACHO-LMC-9. The source star for MACHO-LMC-1a lies in an underpopulated region of the H-R diagram just below, and to the red side of, the red clump. One possible resolution of this difficulty is that the source star has been reddened and/or lies a few kpc behind the LMC disk. This configuration seems more natural if self-lensing is appreciable (Zhao, Graff & Guhathakurta 2000). The event MACHO-LMC-9 is a binary caustic crossing event and the projected velocity of the lens is very low, again suggesting that it resides within the LMC itself (Kerins & Evans 1999).
The most striking feature of the LMC is an off-centered “bar” in the optical and infrared. Many of the computations of self-lensing in the LMC make the implicit assumption of a co-planar thin “bar” and disk, which leaves little room for star-star lensing in the LMC (e.g., Sahu 1994, Gyuk, Dalal & Griest 2000). Observationally, the thickness of the LMC is not measured more accurately than mag using the distance moduli of LMC standard candles. The co-planarity of the “bar” and the disk is established to no better than the uncertainty in the inclination of the LMC, which is between and (Westerlund 1997). This means that the “bar” may be misaligned with the plane of the LMC disk by and offset along the line of sight direction by kpc, for example.
At first sight, the introduction of misalignments and vertical offsets may seem extreme. But, it must be remembered that the conventional picture is not without its own problems. In particular, it seems contrived to require strict coplanarity and exactly zero offset in the line of sight direction, having conceded off-centeredness on the sky plane. De Vaucouleurs & Freeman (1972) named an entire class of galaxies – the Magellanic irregulars – after the LMC and SMC because of their mysterious, asymmetric bars and irregular morphology. It is now widely accepted that the irregular “bar” of the SMC is in fact the projection of a disrupting satellite, severely stretched along the line of sight; our polemical suggestion is that the LMC “bar” may also be an illusory artifact of projection. The LMC “bar” and the SMC “bar” are comparable in solid angle, luminosity, age and metalicity, and reside in a common environment in which they are continuously shaken by the tidal forces of the Galaxy.
The idea that the structure of the LMC may be described by mass concentrations in different planes has been suggested before (e.g., Johnson 1959, McGee & Milton 1966). There is also tantalising evidence for a kinematic sub-component in the LMC carbon star sample moving relative to the LMC (Graff et al. 2000), resembling the subcomponent seen in 21-cm channel maps of LMC (Luks & Rolhfs 1992). Here, we give specific models of the LMC with the planes of the disk and the “bar” being misaligned, and show that they are in good agreement with present data of the LMC (§2). Even better, we find that mild misalignment substantially enhances the microlensing optical depth to values that are already comparable with the observations (§3). We return to the question of origin and sketch some likely evolutionary pathways that could give rise to the proposed misalignment (§4). Finally, predictions and tests of our ideas are also discussed.
2 Misaligned Models and Consistency Checks
We adopt conventional models for the parameterisation of the surface density of the disk and the “bar”. We require the models reproduce the overall morphology of the LMC in projection. Our only modification is that we do not insist that these distributions lie in the same plane.
There is general concensus on the location of the center of the “bar”. De Vaucouleurs & Freeman (1972) take it to be , which is the center of the optical isophotes of the bright “bar”. There is less agreement on the center of the LMC disk. There are a number of population centroids within of the optical center of the “bar” (see Table 3.8 of Westerlund 1997). They are all approximately to the north of the “bar”, with significant scatter in the east-west directions. For our default model, we adopt a conservatively small offset of to the north-west in the sky plane. The offset along the line of sight will be dealt with later. We set up a rectangular coordinate system with being the line of sight direction through the optical center of the LMC “bar”, being the direction of decreasing right ascension and being increasing declination.
The star count density of the disk in the sky plane is parameterised as a standard exponential disk with elliptical contours
| (1) |
while the “bar” is parameterised to have boxy contours and sharp edges
| (2) |
where the coordinates are rotated from by the required position angle to coincide with the apparent major and minor axes of the disk, which have characteristic length and width . Similarly, are the rotated and displaced axes while are the scales of the “bar”. These parameterizations are motivated by the appearance of the “bar” and the disk in the optical bands and in the DENIS J, H, K bands (e.g., Cioni, Habing & Israel 2000). The model parameters are given in Table 1. They are designed to reproduce a nearly round outer disk with the line of nodes at position angle , and a kpc inner “bar” at position angle . The model is normalised by , the total number of stars of the LMC. The fractions of stars in the “bar” and the disk are allowed to vary.
The value of the inclination angle of the LMC has been a long-standing puzzle. It is roughly constrained by various tracers to lie between (see Table 3.5 of Westerlund 1997); the most recent value from the DENIS survey (Weinberg & Nikolaev 2000) is . The inclination results depend on the techniques used, whether surface brightness map fitting, deprojecting kinematic maps, or fitting the standard candles. In all cases, the LMC disk has been assumed to be circularly-symmetric and razor-thin. Given the highly asymmetric distribution of stars and gas, part of the differences in the results may well be explained by the existence of multiple planes.
In our misaligned model, the “bar” and the LMC disk are treated as two inclined slabs with their distances increasing from east to west. One slab, be it the disk or the “bar”, is inclined by , and the other by . The separation of the mid-planes of the two slabs grows linearly with the projected coordinates , so the two planes differ in the line of sight distance by an amount
| (3) |
where the dimensionless constants and are determined by the inclination of the planes, while is the amount by which the “bar” is elevated from the LMC disk in the line of sight direction. A more sophisticated treatment of the three-dimensional and generally triaxial structures of the “bar” and the disk would introduce additional observationally unconstrained parameters without obvious gain in insight to the problem. Motivated by the observation that the distance moduli in the LMC show a predominantly east-west gradient, here we adopt
| (4) |
We let the elevation of the “bar” to vanish in our most conservative model, but explore the effects of a modest level of displacement of the “bar” from the disk, , allowed by the uncertainties in the distance moduli.
To check whether our model is consistent with the basic observational data on the LMC, we compute the surface density maps and distribution of distance moduli of the LMC stars for our default model with parameters given in Table 1. Figure 1 shows that the distance moduli have a spread within 0.1 magnitude for the entire LMC, and even smaller for any given line of sight. For comparison, the spread in distance moduli of the RR Lyraes is magnitudes and so is much larger (Graham 1977, Nemec, Hesser & Ugarte 1985, Westerlund 1997). These authors suggest that this may be evidence for a significant depth effect, although metallicity effects may be another possibility. Of course, the locations of the fields examined by these authors are far from the bulge () and so they have no direct bearing on the issue of a significant depth effect in the central region. Our main points are that the scatter in distance moduli produced by misaligned planes in our model is well within the observational constraints and that there is no conclusive evidence for a planar distribution other than theoretical simplification.
The surface density of all stars in the LMC is calculated via
| (5) |
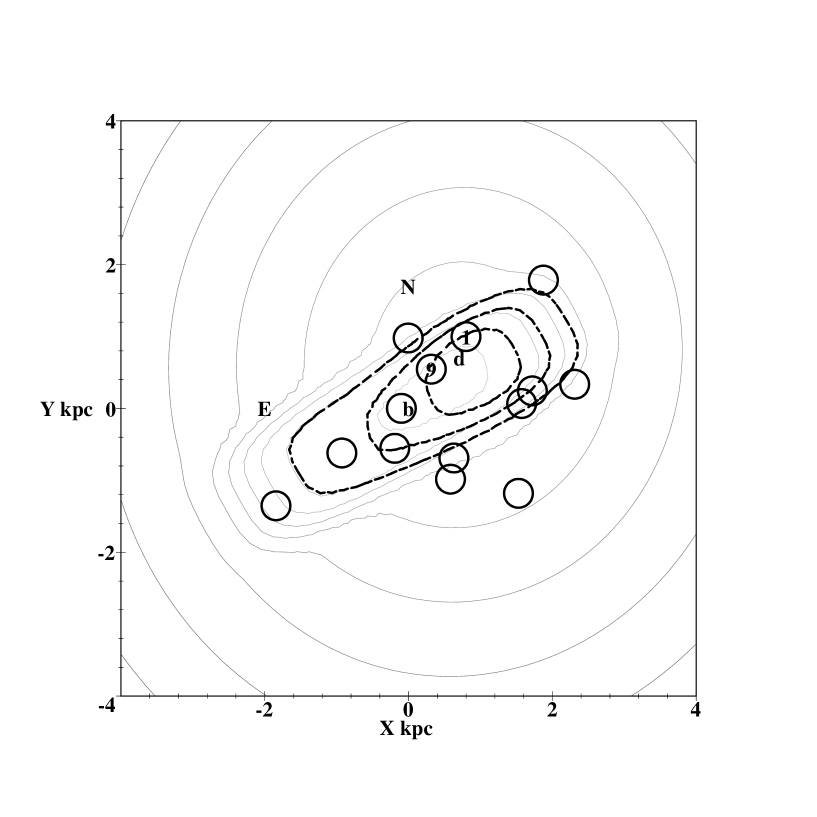
where we assume a spatially constant conversion factor from the star count density of the disk and the “bar”. The constant drops out of the calculation of eventually because of scaling of the star count densities of the “bar” and the disk (see eqns 1 and 2), i.e., and , where and are the mass of the “bar” and the disk respectively. Figure 2 shows logarithmic contours of surface density in unbroken lines. This resembles Figures 2 - 4 of Cioni et al. (2000), which show star counts from the DENIS survey.
3 Microlensing Implications of the Misaligned Disk and “Bar”
The microlensing map is the contour plot of the optical depth (e.g., Evans 1994). In the limit that the source and the lens are at roughly the same distance, it is calculated via
| (6) |
Here, the factor
| (7) |
is the average separation between the source and the lens, where the three terms in the numerator account for the self-lensing of the “bar”, the self-lensing of the disk and the mutual lensing between the “bar” and the disk respectively. The depth parameters for self-lensing of the “bar” and disk components are and . We set (cf. Table 1). This appears fairly conservative as well, given that Weinberg & Nikolaev (2000) detected an intrinsic spread of a few kpc in distance among their 2MASS sample of the LMC disk and bar.
The observed microlensing optical depth is at 95% confidence level (Alcock et al. 2000); the contribution from stellar lenses in the Milky Way disk and spheroid is only . Shown in Figure 2 in dashed lines are the contours marking the model optical depths:
| (8) |
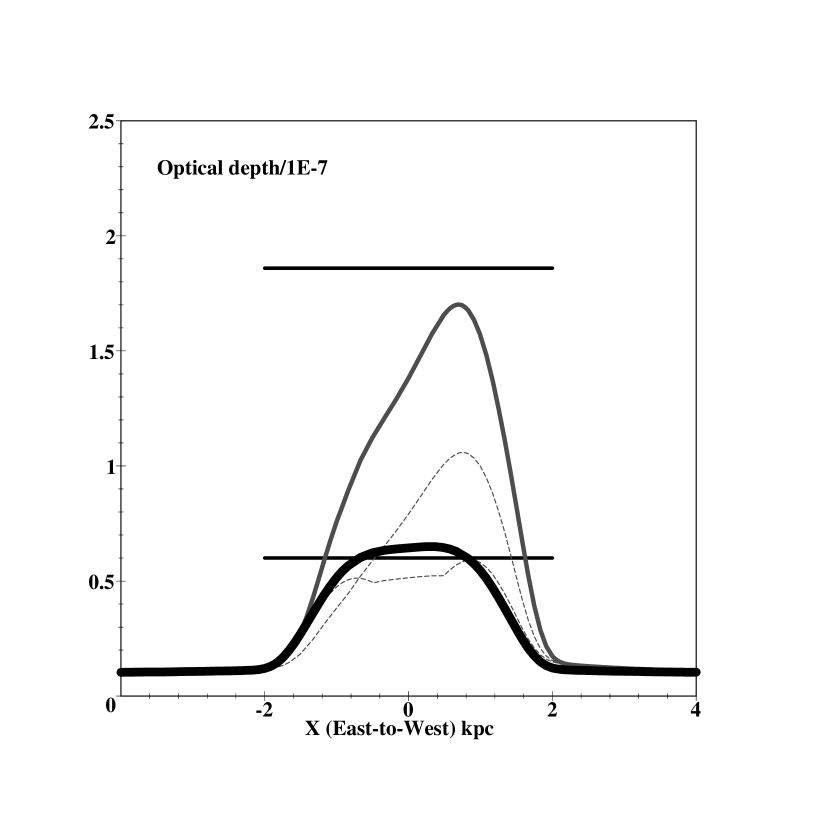
The regions enclosed by the optical depth contours encompass the locations of most of the microlensing events (the marked circles). This is because the typical density (thin solid contours) near the events is in the range independent of the division of the “bar” and the disk. So eq. (6) predicts significant star-star lensing as long as observations allow for a modest dispersion in distance moduli (of the order 0.05 mag, which corresponds to 1 kpc in distances of the LMC stars). This is a general, robust result, insensitive to the exact division of mass between the “bar” and the disk and the details of the three-dimensional structure of the LMC. This is verified by calculating 100 models, which are drawn randomly with the disk-bar offset between in the , and directions, the inclinations of the bar and the disk between and , the thicknesses in the range , and the lensable mass in the range with the bar making up between 25% to 50% of it. These models span the likely range of the three-dimensional structure of the LMC. The average of these models (the thickest solid line in Figure 3) is consistent with the observed optical depth. The spatial profile of the optical depth is usually asymmetric, and changes with the bar-disk division , the offset of the disk, and the inclination of the bar. Models with vanishing vertical offset () generally produce an optical depth map similar to that shown in Figure 2, except that the magnitude of the optical depth and its asymmetry are often reduced.
Our optical depth is proportional to the total lensable mass of of the LMC disk and “bar”, so that the reader can easily adjust our optical depth values to any preferred mass. Earlier estimates of the dynamical mass of the LMC range between (see Table 3.4 of Westerlund 1997). These include a small amount of gas and a possible WIMP halo of the LMC, and should only be taken as an upper limit to the stellar mass of the LMC. Recent data of Kim et al. (1998) suggest a dynamical mass inside 4 kpc radius, and a total disk mass . Interestingly, even for our conservative, low-mass models (cf. Table 1), there are still enough lenses in the LMC to account for the observed optical depth at about the level (the dashed curves in Figure 3).
4 Discussion and Conclusions
This Letter has argued that the LMC might have a radically different structure than the conventional picture of an in-plane, off-centered “bar”. Our modelling starts from the premise that the planes of the LMC “bar” and disk are misaligned. The centers of the bar and disk are offset both in the sky plane and along the line of sight. We have established first, that the combined surface density distribution looks like the LMC as revealed by star counts in the DENIS survey and second, that the self-lensing optical depth lies within the interesting range (). Of course, the quantitative prediction changes with the mass ratio of bar to disk. But, in all the cases we have investigated, misalignment can produce a significant fraction () of the mean observed optical depth. The point is that self-lensing is insensitive to the details of the mass ratio, but is very sensitive to the relative separation of the LMC “bar” and disk stars. Our conclusion of significant self-lensing is a unifying one, as microlensing towards the LMC itself then falls into line with what is already well-established for the Galactic bulge and the SMC. In principle there are enough lenses in the LMC to provide some (perhaps most) of the observed optical depth. If we think of star-star lensing as noise on top of the signal from Macho-star lensing, then the noise is comparable to the signal. The significant uncertainty of the measured inclinations of the “bar” and the disk does not allow us to exclude the possibility of all lenses being from the LMC.
Now let us present two interpretations of our misaligned geometry. This is clearly a speculative matter, and – before we begin – let us emphasise that even the conventional picture of an in-plane, off-centered “bar” lacks a convincing evolutionary pathway. First, the “bar” could be a tidally stretched companion of the LMC, originating from the proto-Magellanic Cloud. Current data and models (e.g., Gardiner, Sawo & Fujimoto 1994, Zhao 1998) of the Magellanic Stream and objects along its great circle support the hypothesis, first made by Lynden-Bell (1982), that the LMC has a gas-rich progenitor with one or several small companions of different star formation and chemical evolution histories. The SMC was probably streched and released from the grasp of the LMC by tidal interactions only 200-500 Myrs ago, judging from its 20 kpc separation from the LMC. Ursa Minor and Draco must have been released at much earlier times, if they were also companions of the proto-Magellanic Cloud. Prior to its very recent release, the SMC must have been a tidally stretched companion within a few kpc of the LMC, resembling the present off-centered “bar” of the LMC in projection. This suggests the “bar” may be a cousin of the SMC, the only differences being that the “bar” is still within the grasp of the LMC and that the “bar” has slightly higher metallicity and total luminosity than the SMC. A possible objection with this scenario is that it takes roughly Myr for a lump of mass to spiral in to the center, on account of dynamical friction provided by the halo of the LMC (if it exists). We only remark that the very existence of the SMC argues empirically that somehow the multi-body dynamics makes it possible for massive lumps to survive within the potential well of the LMC for most of the Hubble time. A second possibility is that the “bar” may be genuine, but offset and tilted from the plane of the disk. This works only if both “bar” and disk are dynamically young, since dynamical friction is likely to enforce co-planarity on timescales of a rotation period (100 Myr at 1 kpc).
All these interpretations are subject to constraints from the absence of any large offset in the radial velocity and the distance of the “bar” and the LMC disk. This is not a serious problem if the “bar” is a real bar with its major axis tilted off the plane of the LMC disk, and its center tied to the mid-plane of the disk. If the “bar” is the projection of an unviralized companion of the LMC, then such an object is likely to be found within a few kpc of the LMC as a consequence of dynamical friction and orbital decay. Such configurations are efficient providers of star-star microlensing because the elevation of the “bar” from the disk is non-zero in general, and is roughly proportional to (cf. eqns. 3 and 6). As for the velocity constraint, any tidally stretched lump could be moving primarily in the transverse direction across the sky in either direction along the elongated “bar”. As a result, the radial velocity could be close to the systematic velocity of the LMC. Any gradient of radial velocity across the “bar” is likely small, and might mimic the velocity pattern of the low-amplitude (), roughly solid-body rotation observed in the “bar” region. Given the significant irregularities in the observed velocity field, it is far from clear whether the conventional explanation as rotation in a nearly face-on asymmetric disk is unique.
How can our model be falsified? There are a number of ways. First, the reddening test proposed by Zhao (1999, 2000) is one possibility. The source stars in our model tend to be on the back plane, thus experiencing more reddening and extinction by dust in the fore plane than average stars in the same field. MACHO-LMC-1a might be an example of such an event. Second, the likelihood estimator for the spatial distribution of events developed by Evans & Kerins (2000) is another powerful discriminant. Note that the observed events do not respect the mirror and point symmetries of the LMC “bar” (cf. Figure 2). These spatial asymmetries may be significant and are produced very naturally by misaligned models. Third, analysis of the gas and stellar kinematics is a critical test for the conventional picture of an in-plane “bar”. Given that the “bar” must dominate the gravity field in the inner parts, it is natural to ask: why does the center of the rotation curve at not coincide with the center of gravity of the “bar” in projection ? In our picture, there is no difficulty in explaining this at all. If tides and interactions are ultimately responsible for the disturbed appearance of the LMC and for the offset between the “bar” and the disk in the and directions (in the sky plane), it seems contrived to require exactly zero offset in the direction (line of sight). The misaligned models presented here serve as a general platform to explain these offsets most naturally. It would be interesting to test the generality of such models with other Magellanic irregulars, such as NGC 4027, NGC 4618 and NGC 4625.
| Model | incl. | PA | sizes | center | mass |
|---|---|---|---|---|---|
| disk | |||||
| “bar” |
References
- (1) Afonso C., et al. 1998, A&A, 337, L17
- (2) Alcock C., et al. 1997, ApJ, 486, 697
- (3) Alcock C., et al. 2000, ApJ, in press (astro-ph/0001272)
- (4) Cioni M-R.L, Habing H.J., & Israel F.P., 2000, A&A, 358, L9
- (5) de Vaucouleurs G., & Freeman K.C., 1972, Vistas in Astronomy, 14, 163
- (6) Evans N.W., 1994, ApJ, 437, L31
- (7) Evans N.W., 1995, ApJ, 445, L105
- (8) Evans N.W., & Kerins E.J., 2000, ApJ, 529, 917
- (9) Gardiner, L.T., Sawa, T., & Fujimoto, M. 1994, MNRAS, 266, 567
- (10) Gould A., 1995, ApJ, 441, 77
- (11) Graff D., Gould A., Suntzeff N., Schommer R., Hardy E. 2000, ApJ, in press
- (12) Graham J.A., 1977, PASP, 89, 425
- (13) Gyuk G., Dalal N., & Griest K., 2000, ApJ, 535, 90
- (14) Johnson H.M., 1959, PASP, 71, 301
- (15) Kerins E.J., & Evans N.W., 1999, ApJ, 517, 743
- (16) Kim S., Staveley-Smith L., Dopita M., Freeman K.C., Sault R.J., Kesteven M., McConnell D., 1998, ApJ, 503, 674
- (17) Kiraga M., & Paczyński B. 1994, ApJ, 430, L101
- (18) Lynden-Bell D., 1982, Observatory, 102, 202
- (19) Luks Th. & Rolhfs K., 1992, A&A, 263, 41
- (20) McGee R.X., & Milton J.A., 1966, Aust. J. Phys., 19, 343
- (21) Murai T., & Fujimoto M., 1980, PASJ 32, 581
- (22) Nemec J.M., Hesser J.E., & Ugarte P.P., 1985, ApJS, 57, 287
- (23) Sahu K.C., 1994, Nature, 370, 275
- (24) Sahu K.C., & Sahu M.S., 1998, ApJ, 508, L147
- (25) Weinberg M.D., & Nikolaev S., 2000, ApJ, in press (astro/ph 0003204)
- (26) Westerlund B.E., 1997, The Magellanic Clouds, Cambridge University Press, Cambridge
- (27) Zhao H.S. 1998, MNRAS, 294, 139
- (28) Zhao H.S. 1999, ApJ, 527, 167
- (29) Zhao H.S. 2000, ApJ, 530, 299
- (30) Zhao H.S., Graff D., & Guhathakurta P., 2000, ApJ, 532, L37
- (31) Zhao H.S., Spergel, D.N., & Rich, R. M. 1995 ApJ, 440, L13