Optical Spectroscopy Of The X-Ray Transient XTE J1118+480 In Outburst11affiliation: Based on observations obtained with the Apache Point Observatory 3.5-meter telescope, which is owned and operated by the Astrophysical Research Consortium.
Abstract
We report on optical spectroscopic observations of the X-ray Transient XTE J1118+480 covering the period from April 7, 2000 to July 4, 2000. The spectrum is characterized by weak, broad, double-peaked Balmer and He lines on top of a blue continuum of slope , as expected for an optically-thick accretion disk. The weak Bowen blend seen in our spectra may indicate a low metallicity for the source. The presence of a partial S-wave pattern in the Heii line appears consistent with the reported photometric period hr for XTE J1118+480. By using a combination of Doppler mapping and various theoretical arguments, we constrain plausible orbital parameters for the system: a mass ratio , an inclination for a neutron star primary, or for a black hole primary with a mass between and . Caii absorption features observed at very high resolution constrain the interstellar hydrogen absorption column and the identification of three absorbing clouds indicate a distance to the source kpc, assuming the line-of-sight to XTE J1118+480 has average high-latitude properties. These results are discussed in the context of previous multiwavelength observations of this unusual system.
Subject headings:
X-ray: stars – binaries: close – accretion, accretion disks1. Introduction
Soft X-ray Transients (SXTs) are compact binary systems in which a low-mass secondary (either a main-sequence star or a subgiant) transfers mass via Roche-lobe overflow onto a black hole (BH) or a neutron star (NS) primary (see reviews by Tanaka & Lewin 1995; van Paradijs & McClintock 1995; White, Nagase & Parmar 1995). SXTs have highly variable luminosities. They spend most of their lifetime in a low luminosity quiescent state, but occasionally undergo dramatic outbursts during which both their optical and X-ray emission increase by several orders of magnitude (see, e.g., Tanaka & Shibazaki 1996; Chen, Shrader & Livio 1997).
The X-ray emission during outburst of an SXT is typically dominated by relatively soft, thermal emission from the accretion disk surrounding the compact object, while the optical emission is usually interpreted as reprocessed X-rays from the disk and/or the companion star. The new source XTE J1118+480 belongs to the class of SXTs, but it also possesses some rather unusual characteristics.
XTE J1118+480 was discovered on March 29 2000 with the RXTE All-Sky Monitor as a brightening X-ray source. Pointed RXTE observations confirmed the presence of this high Galactic latitude source (, ), with a rather hard power law emission spectrum of photon index up to 30 keV. It was subject to rapid X-ray flares, but no pulsation was detected. Retrospective ASM analysis revealed that the source experienced another modest outburst in January 2000 (Remillard et al. 2000; see Fig. 1). BATSE observations showed that the source is visible up to 120 keV (Wilson & McCollough 2000), and a 6.2 mJy (at 15 GHz) variable radio counterpart was later discovered (Pooley & Waldram 2000).
The optical counterpart of XTE J1118+480 was found to correspond to an mag star in the USNO catalog by Uemura, Kato & Yamaoka (2000; see also Uemura et al. 2000). A photometric modulation on a 4.1 hr period was observed by Cook et al. (2000) and was later confirmed as a plausible orbital period by Patterson (2000) and Uemura et al. (2000; see Stull, Ioannou & Webb in Haswell et al. 2000b for a discrepant claim at twice this value). The photometric modulation was later reported changing shape and period, possibly showing the development of superhumps in this source (Uemura 2000). If these are normal superhumps, then the orbital period would be smaller than the photometric superhump modulation by a few percent.
Garcia et al. (2000) reported the first optical spectroscopic results on XTE J1118+480. They found an optical spectrum typical of SXTs in outburst, with very broad H, H and Heii lines ( FWHM km s-1). These observations also indicated the presence of absorption features and a very low interstellar absorption () to the source. These authors suggested that the surprisingly low X-ray ( mCrab, 2-12 keV) to optical () flux ratio of XTE J1118+480 could be due to a nearly edge-on viewing angle.
Additional X-ray observations revealed the presence of a strong Quasi-Periodic Oscillation (QPO) at 0.085 Hz in the X-ray lightcurve of XTE J1118+480. The shape of the power density spectrum and the hard emission spectrum of XTE J1118+480 prompted Revnivtsev, Sunyaev & Borozdin (2000) to propose that the source is a BH transient, by analogy with other such systems. The QPO was confirmed by ASCA observations, which also suggest the presence of a soft component in the spectrum (below 2 keV), possibly due to emission from the accretion disk in the system (Yamaoka et al. 2000). Soft X-ray observations by Chandra did not confirm this (McClintock et al. 2000). The QPO frequency was reported to have shifted from 0.085 Hz to Hz in subsequent observations (Yamaoka et al. 2000; Wood et al. 2000). Pointed XTE observations at the end of May do not reveal significant changes in the emission spectrum (P. Jonker, private communication).
XTE J1118+480 has also been the subject of an extensive multiwavelength observation campaign with HST, EUVE, UKIRT and RXTE. Thanks to the very low interstellar absorption to the source, the first EUVE spectrum of a BH-candidate X-ray Transient was obtained (Mauche et al. 2000). No periodic modulation was found in the EUVE data (Hynes et al. 2000b). An HST spectrum revealed a very broad ( km s-1) Ly absorption feature, suggestive of a massive accretor (Haswell et al. 2000b). Haswell et al. (2000c) obtained a near-UV power density spectrum of XTE J1118+480 with a QPO and an overall shape in agreement with previous RXTE timing data. In addition, the near-UV variability was found to lag by 1-2 seconds behind the X-ray variations, as would be expected from light echoes in a system with hr. Hynes et al. (2000b), combining data from HST, EUVE, UKIRT and RXTE, find that the IR to UV data suggests emission from both an optically-thick disk and another, flat spectrum component (possibly synchrotron), while the EUVE and X-ray data suggest a power law emission typical of a Galactic X-ray binary in a low-hard state. They conclude that XTE J1118+480, rather than experiencing a full outburst approaching the Eddington luminosity, seems to be in a mini-outburst state (but see Kuulkers 2000).
In this paper, we describe the results of our optical spectroscopic campaign to monitor the evolution of XTE J1118+480 during its recent outburst (and early decline). In §2, we describe our observations and the data reduction techniques used. Our results concerning the continuum and line emission, a partial S-wave pattern and the interstellar absorption to the source are presented in §3 and discussed in the context of the current knowledge on XTE J1118+480 in §4. Our main conclusions are summarized in §5.
2. Observations and Reduction
We obtained optical spectra of XTE J1118+480 from April 7, 2000 to July 4, 2000 with the ARC 3.5 m telescope at Apache Point Observatory. We mostly used the Double Imaging Spectrograph (DIS), but spectra with the Echelle spectrograph were also obtained on April 7, 2000. Table 1 summarizes the dates and other characteristics of our observational campaign.
Most of our observations with DIS were carried out with the high resolution gratings (hereafter hires) with a 1.5” slit (dispersion 1.6Å pixel-1 in the blue, 1.1Å pixel-1 in the red, and a resolution of 2 pixels), but we also obtained spectra with the low-resolution gratings (same slit size, dispersion 6.2Å pixel-1 in the blue, 7Å pixel-1 in the red, and a resolution of 2 pixels; hereafter lowres) on April 7, 2000. For the DIS high resolution observations, the blue and red gratings were centered on slightly different wavelengths during our various nights of observations, but we generally centered the blue side to cover the H and Heii lines, and the red side to cover the H line. The complete list of spectral coverage for our observations can be found in Table 1. The Echelle spectrograph covers the (fixed) wavelength range 3500-10000Å with (10 km s-1 at 5000Å) and a resolution element of 2.5 pixels. All the exposure times can be found in Table 1.
The DIS observations were reduced in the standard way using IRAF and the spectra were optimally-extracted and dispersion corrected without any particular difficulty.
The Echelle spectra were reduced using the IRAF ecspec package. Direct extraction of the object spectra proved difficult for the highest (bluest) orders where the trace was hard to follow. We decided to use the flat field as a guide and validated the method with a standard star observed on the same night. This resulted in significantly higher S/N in the blue part of the spectrum. A total of 115 orders were extracted covering the spectral range 3500Å-10000Å, in which the source is detected, albeit with varying sensitivity. The dispersion varied between 0.05Å/pixel to 0.1Å/pixel and the usable spectral range in each order between 70Å to 150Å from the blue to the red end.
The emission lines in the spectrum of XTE J1118+480 are both broad and weak (see below, Fig. 2) and their identification in the Echelle spectra turned out to be challenging. The broad lines can cover almost half of the spectral range in one order making a continuum fit unreliable. We therefore proceeded by normalizing to an interpolated continuum determined from the two closest orders where no lines are expected. The normalised summed spectra clearly show H (in one order, left panel of Fig. 3) and Heii 4686 (spread over two orders, right panel of Fig. 3). These lines are also detectable in the individual continuum-subtracted Echelle spectra. The different profile of the Heii line in the lowres and Echelle spectra is most probably due to the S-wave modulation discussed below. This S-wave is much less prominent in H.
3. Results
The RXTE ASM lightcurve of XTE J1118+480 is shown in Fig. 1 with the dates of our spectroscopic observations indicated by dashed lines. The source was in outburst during the entire period covered by our optical observations, with a flux about 40 mCrab in the 2-12 keV band (Fig. 1). Optical photometry 111VSNET observations at http://www.kusastro.kyoto-u.ac.jp/vsnet also shows the source in outburst with a mean magnitude that decreased at most by mag (from its peak value ) at the end of our observational program. Since then, the optical and X-ray flux have decreased significantly, indicating that the source may soon enter quiescence.
3.1. Continuum
Figure 2 shows the sum of the two DIS lowres spectra obtained on April 7, 2000, which is also representative of other spectra of the source obtained later on during our campaign. The strong, blue power-law continuum and the weak emission lines are typical of an SXT in outburst (see also Garcia et al. 2000). A power-law fit to the blue part of the spectrum yields a slope (where the flux F), while a similar fit to the red part of the spectrum yields . These values are consistent with the expectation for an optically-thick accretion disk (see, e.g., Frank, King & Raine 1992). Hynes et al. (2000b) find that the spectrum is flat using a wider wavelength range.
The broad, double-peaked H emission line is the only one easily identified on the spectrum of Fig. 2, but a closer examination reveals the presence of Heii , and of additional Balmer and He lines in the other spectra that we collected (see §3.2 below). We find only marginal evidence for continuum variability in XTE J1118+480, both during the same night and from night to night. The lack of obvious variability is consistent with the long-term variations in the optical VSNET lightcurve ( 0.5 mag), the short timescale (10 s) of the large amplitude (0.3 mag) flickering and the low amplitude (0.052 mag) of the 4 hr modulation (Patterson 2000).
3.2. Line Profiles and their Evolution during Outburst
We identify three Balmer lines, three He lines and the Bowen blend in our set of spectra. These are: H, Hei , the Bowen blend at , Heii , H, Hei , H and Hei The lines are weak, broad and double-peaked. H, H and also the weaker Hei 4471.5 have double-peaked emission clearly embedded in a large absorption trough. There is no clear evidence of such absorption around H.
Fig. 3 shows the H and Heii line profiles in the summed Echelle spectrum with the low resolution spectrum taken on the same night overplotted. We find no evidence for structures at high spectral resolution in the lines, except for an excess at rest wavelength which would not be expected in a pure double-peaked disk profile. This component also seems to be present in the high resolution DIS spectra (see Fig. 4). The Bowen blend, which is very weak in the DIS hires spectra, was not detected on April 7 in either the DIS lowres or the Echelle spectra.
Measuring the lines proved difficult, not because of a lack of counts in the spectra but because of their intrinsic broadness and weakness. As a rule, we performed two-component Gaussian fits to the emission lines. For H and H the two emission components were subtracted to measure the equivalent width (EW) and FWHM of the absorption trough. The EW of the lines varies (with large associated errors) within a night but we could find no periodic behaviour linked to the photometric period. We also tried to estimate the semi-amplitude velocity of the primary by fitting the wings of the Heii line (expected to trace the motion of the compact star) and folding around the suspected of 0.17 day. This did not lead to any result as could be expected from the usually low of SXTs ( km s-1).
The evolution of these lines during the 3 months of observations is shown in Fig. 4, after the underlying continuum was normalized to unity. When available, multiple spectra were summed up to increase the S/N of the spectra. A comparison between the most comprehensive datasets (Apr. 17 and Jul. 4), where measurement errors can be minimized, shows that the two strongest lines, H and Heii, did not change significantly. We conclude that there do not seem to be any long term variations. The average properties of the lines are summed up in Table. 2 (the quoted errors are the rms of the measurements).
In all our spectra the blue side of the absorption troughs in H and H is less strong than the red side. The measured central wavelengths of the absorptions are redshifted compared to the rest wavelength (which could be an artefact of the method we used to remove the double peaked emission). Fitting a gaussian to the red part of the absorption while ignoring (but not subtracting) the emission lines gave higher equivalent widths (2.4Å for H and 2.0Å for H) and better agreement with the rest wavelength (7Å redshift for both instead of 15Å). Similar absorption redshifts were reported by Callanan et al. (1995) for GRO J0422+32. A plausible explanation would be that the shifts are due to distorted line profiles. Such asymetric lines are observed in dwarf novae when the disk becomes eccentric and the system shows superhumps (Warner 1995). There is evidence for such superhumps in XTE J1118+480 (see discussion in §4.3).
3.3. Constraint on the EUV flux
The Heii emission may be used to obtain a crude estimate of the extreme ultraviolet (EUV) flux from the source (e.g. Patterson & Raymond 1985) if one assumes the 4686 line stems from the recombination of Hei photoionized in the disk by photons with energies between 55-280 eV. On the other hand, the doppler map discussed below in §3.5 shows most of the Heii emission is localized and in all likelihood associated with stream-disk interaction. In this case the 4686 line would be pumped by collisional excitation rather than photoionization. The following estimate therefore only yields an upper limit on the EUV flux. This is still of interest since the upper limit is independent of the column density to the source.
We derive from our observations erg s-1 cm-2 and, from the values given by Haswell et al. (2000b), erg s-1 cm-2. This favours Case B recombination for which one would expect (Seaton 1978). Therefore, the region is optically-thick to the ionizing flux but thin to the line and a fraction of the photoionized Hei recombinations lead to 4686 emission (Hummer & Storey 1987).
Following previous applications to soft X-ray transients (Marsh, Robinson & Wood 1994; Hynes et al. 1998), the EUV flux and the Heii line flux are related through
| (1) |
where is the fraction of EUV photons intercepted by the disc while eV and eV refer to the mean energy of the photons. We have assumed , which may be incorrect if the EUV emission is not isotropic or if we see only a fraction of the Heii emission. In both cases this assumption leads to an underestimate of the true EUV luminosity. Observations suggest that a fraction of the soft X-ray flux is intercepted and reprocessed in the optical by the accretion disk in SXTs (e.g. Dubus et al. 1999). By analogy, we take from which we finally derive an upper limit to the 55-280 eV flux of erg s-1 cm-2. This is obviously a very crude estimate.
An EUVE spectrum was obtained for this source, the first time ever for a SXT. The source flux at these wavelengths is heavily dependent on the extinction, but the upper limit on derived above appears consistent with both a simple extrapolation of the optical–UV flux observed and the EUVE flux inferred if a value of cm-2 is assumed when dereddening the EUVE spectrum (Mauche et al. 2000; Hynes et al. 2000).
3.4. Peak-to-peak velocities
The mean peak-to-peak separation for all the observations is 18Å (1240 km s-1) for H, 23Å (1470 km s-1) for Heii, 21Å (1300 km s-1) for H and 28Å (1280 km s-1) for H. The S-wave is much less prominent in the Balmer lines and we assume this represents the projected Keplerian velocity of the outer disk. The peak-to-peak separations have been found in well-known systems to overestimate the outer disk radius by about 20% because of sub-Keplerian motion or local broadening (Marsh 1998). This uncertainty is acceptable considering other assumptions made below. For a Keplerian disk with an emissivity , can be related to the outer (emitting) disk radius (Smak 1981):
| (2) |
where is the mass of the primary and the system inclination. We can also express as a function of the velocity semi-amplitude of the secondary and the mass ratio by combining the above equation with the mass function (see below, Eq. 5) and Kepler’s third law222From 0.17 day, Kepler’s third law gives a binary separation cm with a weak dependence on and ., resulting in:
| (3) |
The disk outer radius is expected to reach the tidal truncation radius for and to be limited to by the 3:1 resonance for (e.g. Warner 1995). Papaloizou & Pringle (1977; their Tab. 1) give a theoretical estimate of the outer disk radius that we recklessly use for . Eq. 3 can therefore be used to give the semi-amplitudes for which the disk radius is consistent with the theoretical expectations. For the disk radius varies between 0.5 and 0.3 in units of the binary separation . The expected as a function of is shown as a solid line in the left panel of Fig. 8. We find (km s-1) for .
The observed velocity FWHM () of the lines provides an upper limit to the minimum emitting Keplerian disk radius:
| (4) |
where is expressed in units of 1000 km s-1. The absorption features from the optically-thick disk (see §4.1 and Table. 2) have FWHM km s-1 implying cm. Haswell et al. (2000b) detect broad Ly absorption with km s-1 which gives a stricter cm or in Schwarzschild units. Spectral models of the X-ray low/hard state of BH candidates tend to predict larger values of in Schwarzschild units) at which the transition from a thin disk to a hot advection-dominated flow occurs (see, e.g., Esin et al. 1998). The EUV flux of XTE J1118+480 could also imply a smaller transition radius (see §4.2).
3.5. Doppler mapping
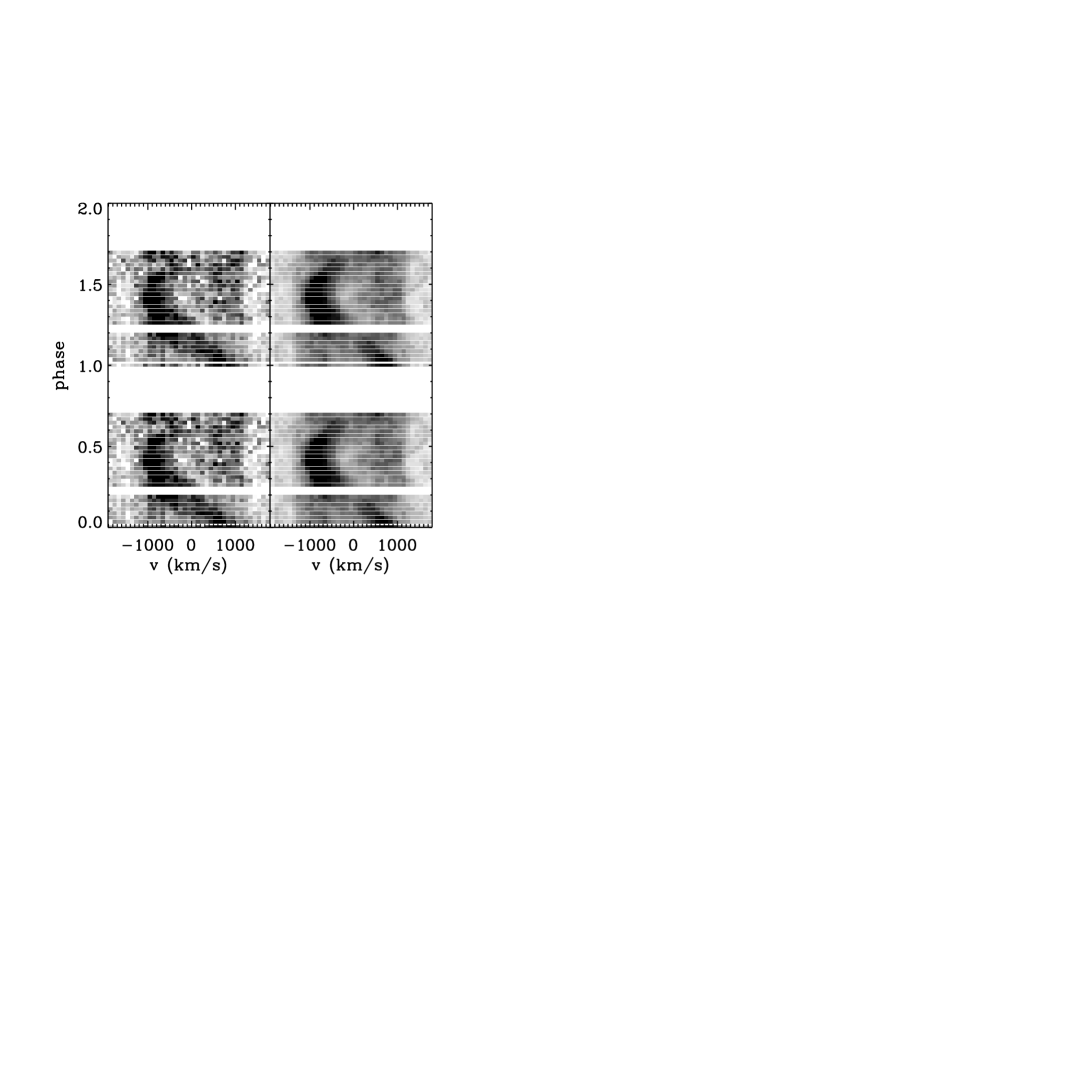
Figure 5 shows the evolution of the Heii line profile over an approximately continuous 2.9 hr period on April 20, 2000. A partial S-wave pattern moves from the red to the blue side of the Heii line rest wavelength and appears consistent with the claimed photometric period of hr (Cook et al. 2000; Patterson 2000). The modulated component is particularly strong towards the middle of the observation at HJD 51654.876 where it is blueshifted by about 900 km s-1.
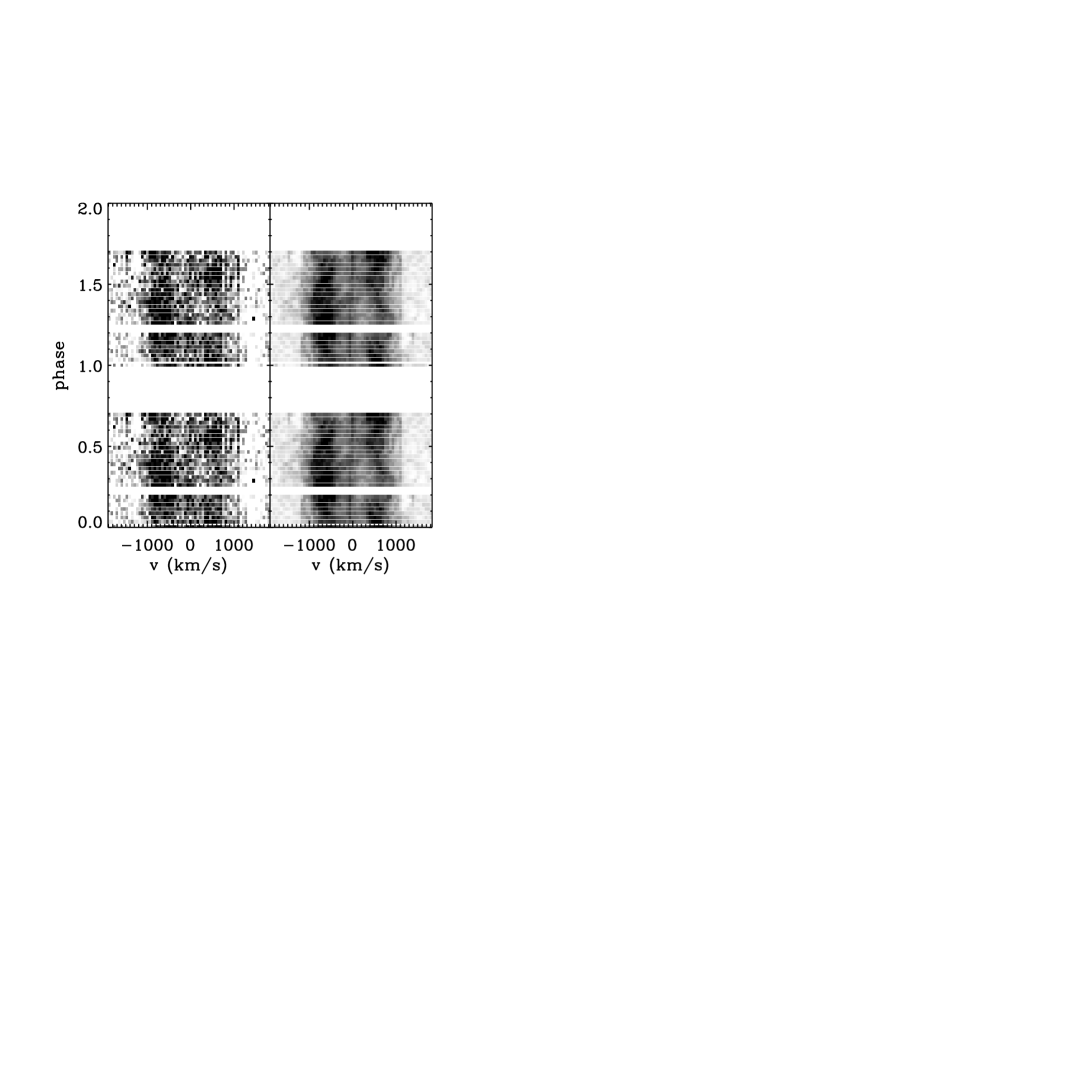
The trailed spectrum clearly shows that the Bowen blend, Hei , H and H follow the same S-wave pattern (see Fig. 5 ). We note that identical behaviour is seen in the smaller continuous set (1.8 hr) of July 4 although with poorer S/N (not shown here). However, the presence of the S-wave in the H emission profile is not clear on either dates.
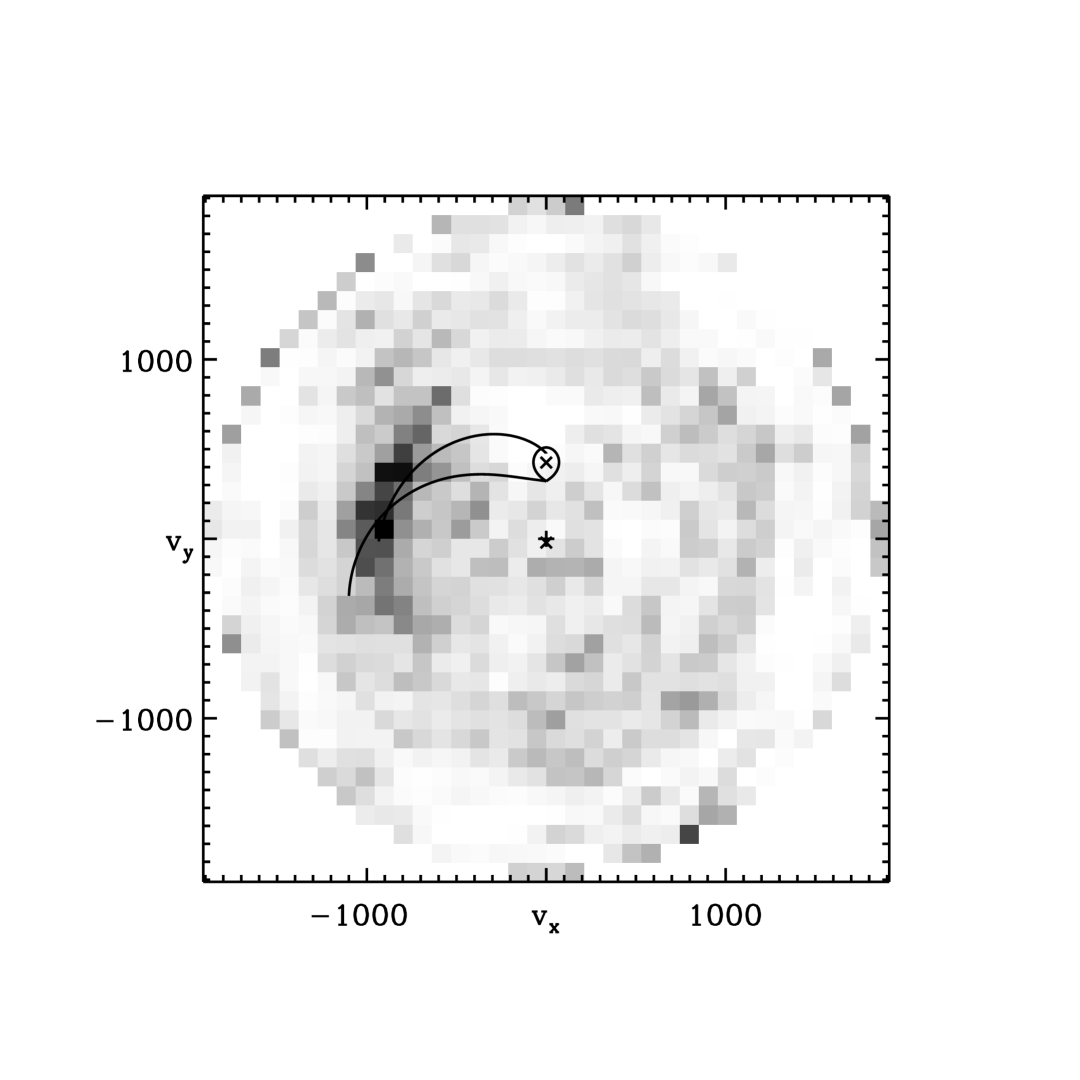
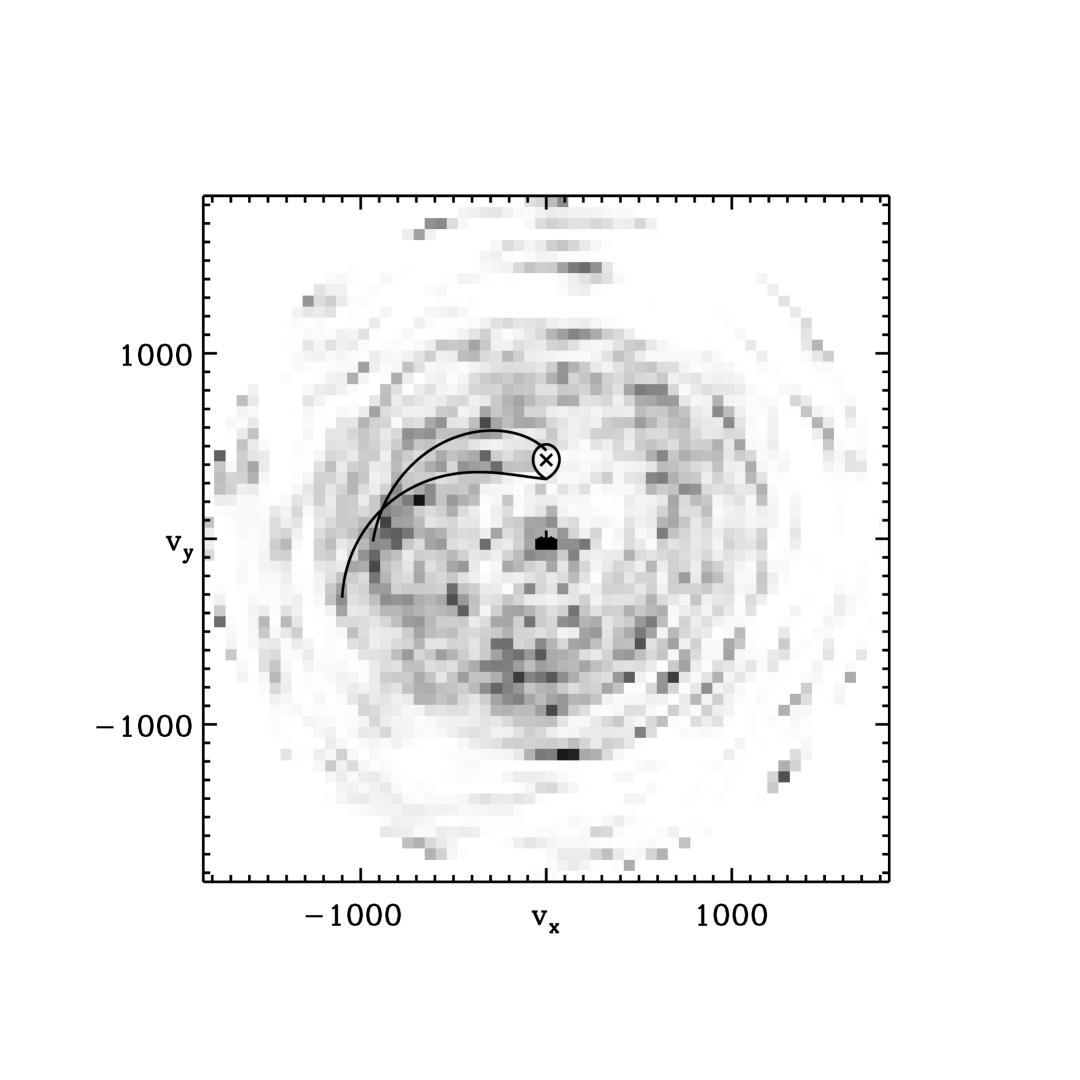
Despite the incomplete phase coverage and the absence of a reference for superior conjunction of the secondary, we attempted to locate the emission site of the S-wave in the binary velocity plane using the Doppler tomography technique (Marsh & Horne 1988). Maps were reconstructed for Heii and H for the April 20 observations using the software developed by Spruit (1998), assuming an orbital period of 0.1708 day and a null systemic velocity. It was not possible to combine this dataset with our other observations as this would have required to be known much more accurately ( day with days and an error on the phase set by the exposure time of ). Furthermore, the 0.1708 day modulation is probably related to superhumps so that the orbital period can be expected to be close to this value with an uncertainty of a few percent. We tried several different orbital periods around 0.17 day but this had no significant impact on the maps. The reconstructed trailed profiles and corresponding velocity maps are shown in Fig. 6 and Fig. 7 respectively.
Each pixel on the projected Doppler map corresponds to an S-wave in the trailed spectra. The binary components are located on the y-axis of the map at positions corresponding to their semi-amplitude velocities for the primary and for the companion (indicated by crosses). However, since the orbital reference phase is arbitrary (here we chose 51654.420 in MJD), the map can be rotated in any fashion around the velocity origin. The secondary position, the ballistic gas stream trajectory and the corresponding Keplerian velocity at the location of the stream shown on Fig. 7 result from particular choices of and discussed further below.
The trailed emission of Heii shows a nice S-wave pattern which is consistent with the reported 0.1708 day photometric period (Cook et al. 2000; Patterson 2000). Most of the Heii emission originates from a localized region but there is also an underlying (double-peaked) disk component which is visible in the original data. On the other hand, the disk dominates the H profile producing a ring of emission in the velocity map. We also note the regions of enhanced H emission at about (-910,0) km s-1 (consistent with the Heii S-wave) and km s-1. The peak at the velocity origin (the center of mass) is due to the H emission component at rest wavelength discussed in §3.2.
The bright emission region is typically associated with emission arising from the stream-disk interaction region or from the X-ray heated surface of the secondary (e.g. Smak 1985; Marsh, Robinson & Wood 1994; Casares et al. 1995ab; Harlaftis et al. 1996, 1997ab; Hynes et al. 2000a). Some SXTs also have low-velocity emission regions in their doppler maps, possibly associated with a magnetic propeller (Hynes et al. 2000a). Here, the velocity of km s-1 makes it doubtful that we observe such a phenomenon.
Assuming the Heii emission arises from the heated hemisphere of the secondary, the semi-amplitude km s-1 (underestimating the real ) gives a rough constraint on the mass function through :
| (5) |
This gives a minimum mass for the primary of 12 M⊙, which would make XTE J1118+480 at least as massive as the black hole in V404 Cyg. Lower inclinations would imply an even greater mass making this system rather unusual compared to the dynamical masses inferred in other SXTs (see, e.g., van Paradijs & McClintock 1995). Although we cannot formally reject this possibility, the Heii emission is unlikely to originate from the heated surface of the secondary.
The Heii emission is more likely to originate from the stream-disk interaction. Typically, the hotspot is located (see above references) somewhere between the ballistic gas stream trajectory and its corresponding Keplerian velocity (which defines a circularization radius). We derive a lower limit on (hence a lower limit on the primary mass) by assuming that the emission is located at the intersection of the two trajectories. The values of and for which the intersection matches the Heii emission are plotted as a dashed line in the left panel of Fig. 8.
A comparison between the two estimates of shows that values of best fit the data in the sense that they minimize the discrepancies. Formal agreement requires ( km s-1) but this is, of course, model-dependent. Knowing and , the mass function (Eq. 5) gives the inclination as a function of . This relation is plotted in Fig. 8 (right panel) for the two extreme cases (, km s-1) and (, km s-1). Clearly, a NS would require large inclinations while a BH gives intermediate inclinations. Given the assumptions made for the interpretation of the peak-to-peak velocity and the Heii emission, we are likely to underestimate in both cases. This would only strengthen the case for a black hole primary.
The stream-disk interaction apparently extends some way along the Keplerian velocity trace as previously seen in other SXTs (e.g. Harlaftis et al. 1996). This could also be a numerical artifact possibly due to an inaccurate orbital period. The second weaker emission region in the H velocity map could be due to continued disturbance of the accretion disk further along in azimuth. In this picture the stream-disk interaction takes place inside the disk as emphasized by the larger velocity amplitude of the S-wave with respect to the peak-to-peak amplitude of the Balmer emission lines. This interpretation suggests significant stream overflow above the outer disk and an interaction region close to the circularization radius. Alternatively, systematic effects leading to lower observed peak-to-peak velocities (e.g. local line broadening, Marsh 1998) would place the hot spot closer to the disk outer edge.
3.6. Interstellar Absorption
The Echelle spectra of XTE J1118+480 obtained on April 7, 2000 reveal the presence of weak Caii absorption features, which can be used to estimate the neutral hydrogen absorption column to the source. The spectra also show Caii in absorption, with an equivalent width of order half that of Caii features, as expected for this doublet (see, e.g., Cohen 1975). Both features are seen on two overlapping orders with similar structure. The Caii lines are detected in some of the individual Echelle exposures with identical profiles. Figure 9 shows the Caii absorption features in the summed Echelle spectra. The two orders have also been summed for this plot with weighting corresponding to the different sensitivities at the locations of the Caii lines.
A Gaussian fit to each of the three absorption components yields heliocentric velocities , and km s-1. These velocities are consistent with an absorption component clearly seen at km s-1 and the hint of another component at km s-1 in NaI . The presence of strong Na emission at the rest wavelength (sky emission) precludes the detection of the presumed third absorption component at km s-1 and the use of Na absorption for the determination of the Hi absorption column, NHi, to XTE J1118+480.
We proceed as follows to determine NHi.333Note that we do not have to worry about a stellar Caii absorption component from the companion star because the emission of XTE J1118+480 in outburst is presumably dominated by accretion We assume that the gas in each absorbing cloud has a Maxwellian velocity distribution centered on its heliocentric velocity , so that the Caii optical depth of the cloud can be described by (Spitzer 1978):
| (6) |
where is the total cloud absorption column, is the rest wavelength of the Caii K line, is the oscillator strength of this transition (Cardelli & Wallerstein 1986), is the velocity dispersion of the cloud, is the charge of the electron, is the mass of the electron and is the speed of light. Relative to a unity continuum, the line profile of a given absorbing cloud component has a depth given by:
| (7) |
at any speed (or equivalently wavelength) around the central value .
To deduce precise values of and , we have compared the observed Ca line profiles with theoretical, multi-component absorption line profiles. Initial profiles were calculated using the values of and derived from Eqs. (6) & (7), which were then convolved with a Gaussian instrumental Line Spread Function whose FHWM was measured from the arc lines used to wavelength calibrate the data. The best values of and were found by minimizing between the data and the theoretical fits. The resulting values for the Ca lines are: and 6.2 km s-1, and 11.67 for the components at and km s-1 respectively.
The translation of the Caii absorption column to an hydrogen absorption column is somewhat delicate, especially in view of the possibly efficient deposition of gaseous Caii onto dust grains (see, e.g., Vallerga et al. 1993). However, there is a substantial body of observational data on Caii absorption which allows us to use an average value for the ratio . In their independent studies, both Cohen (1975) and Sembach & Danks (1994) find an average average value of for high latitude line-of-sights, with approximate errorbars of in log in the two cases. Assuming this average is representative of the line of sight to XTE J1118+480, this translates in a value , where the errorbars come from the conversion of to absorption.
We note that this estimate is somewhat larger than the values considered as reasonable by Hynes et al. (2000; see also McClintock et al. 2000; Esin et al. 2000) when dereddening the low-energy spectrum of XTE J1118+480. This discrepancy raises the possibility that the value obtained from the Ca measurement overestimates the true value of NHi on the line of sight to the source. Most likely, this would come from the conversion from Ca to H which may not be “average” as assumed above for XTE J1118+480. It is also possible to measure the total (H I) along the sightline towards XTE J1118+480 from 21 cm emission observations. Using data from the Leiden/Dwingeloo Survey (Hartmann & Burton 1997), the H I column at ()=(157.5,62.0) is cm-2, a factor of two lower than we derive. This value represents an upper limit of course, since the 21 cm emission is integrated along the line of sight through the entire Milky Way. This therefore also suggests our value of (H I) is over-estimated, although the Dwingeloo beam size of 36′ is too large to measure higher (H I) over smaller angular scales, and it remains possible that a small, dense knot of H I with (H I) cm-2 could be lying directly along the line of sight.
It is encouraging to see that the properties derived above for the clouds are consistent with the average properties of high latitude line-of-sights described in Sembach & Danks (1994): cm-2. Furthermore, these authors find that, along extended sight lines at high latitude, the average number of absorbing Caii clouds is 3.6 kpc-1. This indicates that XTE J1118+480 is located at a distance kpc if the line of sight to the source has average properties, an estimate which is consistent with those for other SXTs. The actual distance to XTE J1118+480 could be somewhat different if this line-of-sight has properties deviating significantly from the mean. Note that our estimate of the distance is in rough agreement with that of Uemura et al. (2000) who use the 18.8 quiescent magnitude to derive kpc (M-type secondary) or kpc (K secondary), and is consistent with the 0.8 kpc distance estimate of McClintock et al. (2000), assuming that the primary is a massive BH and that a third of the light in quiescence is provided by the M-dwarf secondary. It is also of interest to note that the 21 cm emission from the Leiden/Dwingeloo Survey mentioned above shows two peaks in brightness temperature which correspond closely to the Ca II components at and km s-1. Although the distance of the H I is not known, the scale height of H I in the Milky Way is kpc, and since the 21 cm emission arises from all the H I in the Galaxy along the sightline, XTE J1118+480 must be sufficiently far away so as to show the Ca II absorption from both H I components. This again suggests a significant distance between us and XTE J1118+480.
4. Discussion
4.1. The absorption troughs
An interesting feature of the spectra are the absorption troughs in and . Although rarely discussed (see, however, Soria et al. 2000), these have been observed in several other transients with similar FWHM, including GRO J1655-40, A0620-00, GS1124-68, Nova Mus 91, XTE J2123-058, XTE J1859+226, and especially GRO J0422+32 which bears many similarities to XTE J1118+480 (see conclusion).
This type of line profile is also seen in dwarf novae (DN) and nova-like (NL), systems which are analogous to low-mass X-ray binaries (LMXBs), except for a primary which is a white dwarf. Typically, the spectrum of quiescent DN display strong emission lines which are gradually replaced by absorption features during the rise to outburst and vice-versa during the decay (e.g. Szkody et al. 1990).
Schematically, the absorption is thought to arise from the optically-thick accretion disk whilst the emission is thought to result from photoionization in a chromosphere-like optically thin region above the disk. A key feature is that the expected spectrum is inclination dependent since the absorption should disappear as the system gets closer to being edge-on due to strong line limb-darkening in the 2D disk (see e.g. Marsh & Horne 1990; la Dous 1989; Wade & Hubeny 1998). There is indeed such an observed dependence in both DN and NL with the highest inclination systems showing only emission lines (la Dous 1991).
Although the detected absorption makes it unlikely that the inclination of XTE J1118+4800 is very high, this constraint is weak. For instance, GRO J1655-40 also showed Balmer absorption (Soria et al. 2000) but has a well-determined inclination of 70°. In contrast with DN and NL, irradiation heating is much stronger in SXT where it usually dominates the heat balance in the outer disk regions (hence the optical emission, van Paradijs & McClintock 1994). Energy deposited by soft X-rays easily causes a thermal inversion in the top layers where the emission lines originate (e.g. Ko & Kallman 1994). If the optically thin atmospheres of SXTs are indeed more extended than in DN, one would expect Balmer absorption not to be as common an occurence as in the non-magnetic cataclysmic variables.
The spectral models of X-ray irradiated disks computed by Sakhibullin et al. (1998) show that softer irradiation leads to the disappearance of the absorption troughs. As the irradiation spectrum hardens, the X-ray photons deposit their energy in deeper disk layers, which do not contribute to the line emission. Inversely, any parameter change resulting in additional heating of the disk atmosphere leads to more emission. Any combination of a low inclination, low X-ray luminosity, hard X-ray spectrum or low fraction of reprocessed X-ray photons in the disk could explain the absorption troughs.
Those SXTs in which Balmer absorption has been observed have probably been guilty of one or several of the above. Interestingly, in GRO J0422+32, the H and H lines evolved from absorption to emission within 3 days during the rise to one of the mini-outbursts (Callanan et al. 1995). Although the authors could not find any evidence for increased X-ray flux between 0.5-10 keV, the simultaneous rise in Heii emission does suggest a larger flux of soft 0.05-0.3 keV photons which would have a strong effect on the chromosphere. However, a hard X-ray upturn in GRO J1655-40 was accompanied by a dramatic increase of H emission but also by a decrease of the Heii flux (Shrader et al. 1996). It seems difficult to identify the dominant culprit but we propose the low X-ray flux (see next section) and the hard X-ray spectrum of XTE J1118+480 as prime suspects responsible for the absorption troughs observed.
4.2. The optical magnitude
A unique characteristic of this system is the large optical to X-ray ratio, as compared to other SXTs. The ratio for XTE J1118+480 is not dissimilar (Garcia et al. 2000) to that found in Accretion Disk Corona (ADC) sources where the X-ray flux is partly hidden by the disk seen edge-on. Yet, XTE J1118+4800 has not shown any of the typical behaviour associated with ADC sources, namely X-ray dips or eclipses. In addition, our crude ‘fitting’ of the peak-to-peak velocity of the Balmer lines and of the velocity map rather hints at intermediate inclinations.
This high ratio might simply be due to the low absorption and proximity of the source. At the 0.8 kpc distance implied by the Caii absorption, the 2-10 keV X-ray flux (erg s-1 cm-2, Yamaoka et al. 2000) is such that erg s-1. By analogy with the low/hard state of Cyg X-1, Fender et al. (2000) find the broad band X-ray luminosity is erg s-1 cm-2 at 1 kpc, i.e. this outburst was weak for a SXT.
We compare the X-ray flux and optical magnitude by computing the quantity , where erg s-1 is the Eddington luminosity. With day, we find with M⊙ while for and . Within the error bars, this is consistent with the correlation found for other SXTs between and by van Paradijs & McClintock (1994). In other words, the optical flux of XTE J1118+480 is roughly in agreement with what would be expected if the disk is irradiation-dominated.
The agreement is less good for higher , the optical flux being larger than expected from the correlation. The X-ray heated companion could contribute to the optical as in, e.g., the persistent LMXB Cyg X-2. In this case we might expect the Heii emission to originate from the X-ray heated surface of the secondary. We have argued this is unlikely. A better candidate for this extra optical emission is synchrotron emission (Hynes et al. 2000b) originating in a magnetic corona (Merloni et al. 2000),444Note that the corona model of Merloni et al. 2000 may be challenged by the observations of Haswell et al. (2000c) which show that the near-UV variability lags behind the X-ray variability by 1 to 2 seconds. an advection-dominated accretion flow (ADAF; Esin et al. 2000) and/or a jet ( equivalent to the first model with the base of the jet acting as the magnetic corona; Markoff et al. 2000). XTE J1118+480 probably has a powerful compact jet, with emission extending at least to the near-infrared (Fender et al. 2000). Both ADAF and magnetic corona models can explain the high optical/X-ray ratio but the EUV predictions may differ. The model presented by Merloni et al. (2000) has a large blackbody component peaking at Hz due to hard X-ray reprocessing in the disk. The soft X-ray observations of Chandra do not seem to support this model (McClintock et al. 2000; Esin et al. 2000).
4.3. Superhumps ?
The detection of superhumps (Uemura 2000) could add several constraints to the system parameters. According to current models, superhumps appear when the disk can reach the 3:1 resonance radius, requiring small mass ratio (Warner 1995). In principle, the relative difference between the superhump period and the orbital period can give an even better constraint on (e.g. O’Donoghue & Charles 1996). Such a small mass ratio is compatible with the constraint that we derived in §3.5.
In DN and NL, the origin of the optical variation could lie in the enhanced viscous dissipation modulated on the superhump period. However, these variations should be swamped in SXTs where irradiation heating rather than viscous heating dominates the optical output. Haswell et al. (2000a) recently argued that the small change in the accretion disk area on the superhump cycle, rather than the enhanced viscous dissipation, would give the desired effect for SXTs. The amplitude of the superhump would however decrease with larger inclinations.
The detection of superhumps in XTE J1118+4800, if confirmed, would therefore either mean the disk was not irradiation-dominated (which is unlikely considering, e.g., the correlated X-ray/near-UV behaviour reported by Haswell et al. 2000c) or that the inclination is low enough for the variations of the area of the disk to be observable.
4.4. Is XTE J1118+480 a halo object ?
The high Galactic latitude of XTE J1118+480 () is in sharp contrast with the latitudes of other LMXBs which cluster next to the Galactic plane. Whether or not XTE J1118+480 is a halo object obviously depends on its actual distance. At our inferred kpc, XTE J1118+480 lies kpc above the Galactic plane.
The distribution of BH LMXBs around the Galactic plane has a dispersion of kpc. The larger dispersion of NS LMXBs ( kpc) is probably due to larger kick velocities at birth (White & van Paradijs 1996). Whether XTE J1118+480 has a BH or a NS primary, its height above the Galactic plane is not much larger than for other LMXBs. For instance, White & van Paradijs (1996) find kpc for the BH Nova Oph 1977.
A low metallicity environment would be supported by the low Bowen to Heii flux ratio (Table. 2) that we find (Motch & Pakull 1989). But the detection of N and the non-detection of C and O lines in the UV spectra has been used to argue that the matter has been CNO processed in the companion (Haswell et al. 2000b) and that, from an evolutionary point of view, M⊙ is preferred to allow for an evolved secondary. Considering that XTE J1118+480 is not extremely far from the distribution of other LMXBs above the Galactic plane and that CNO processing might explain the low Bowen/Heii flux ratio, we conclude that there is no compelling evidence for a halo origin of XTE J1118+480.
5. Conclusion
Let us first summarize the main conclusions of this work.
The optical spectrum of XTE J1118+480 in outburst shows several variable broad and weak emission lines superposed on a continuum typical of an optically-thick accretion disk. The Heii line shows a strong S-wave pattern which is consistent with the claimed 0.1708 day photometric period. We see no other obvious periodic or long-term behaviour in the lines.
We find from the Caii lines that the interstellar absorption to the source is low () and that the presence of three intervening clouds suggests a distance of kpc to the source. Since the low Bowen to Heii ratio could indicate CNO-processed material (Haswell et al. 2000b) rather than an intrinsically low metallicity, we conclude there is no strong evidence to support a halo origin for XTE J1118+480.
We estimate an upper limit for the 0.05-0.3 keV source flux of erg s-1 cm-2. The dereddened EUVE spectrum (using a column absorption ; Hynes et al. 2000; Mcclintock et al. 2000) appears compatible with this value. This suggests that a significant fraction of the source flux is emitted in the EUV/Soft X-ray band. Given the very strong dependence of the slope of the dereddened EUVE spectrum on , it may be difficult to accomodate a higher value for as derived from Caii absorption in §3.6.
The absorption in H, H and the Balmer jump (Hynes et al. 2000b), originating from the optically-thick disk, suggests that X-ray heating of the atmosphere is not as strong as in other SXTs, which may be consistent with the (very) low X-ray flux and hard X-ray spectrum. This also disfavors very high inclinations for which limb-darkening would remove the absorption features.
The Balmer lines have peak-to-peak velocities of km s-1. Assuming this corresponds to the Keplerian velocity of the outer disk, we use theoretical arguments on the disk size to estimate . We find (km s-1) for .
Using the reconstructed Doppler tomogram, we tentatively identify the Heii S-wave with the stream-disk interaction. This gives us a second estimate of which, combined with the first one, restricts possible values for to . This further implies that if the primary is a NS, the system should have a high inclination (°), while for a BH primary, an intermediate inclination is preferred (30°50° for ).
Superhumps (Uemura 2000), if they require and low to intermediate inclinations (Haswell et al. 2000a), the absence of dips or eclipses in the X-ray lightcurve, the lack of high frequency QPOs (Revnivtsev et al. 2000) and the broad Ly line (Haswell et al. 2000b) all favor an intermediate inclination system containing a BH. All of the arguments above are, however, rather uncertain and model-dependent. The assumptions made to interpret the peak-to-peak velocity and Heii emission probably underestimate . A larger would strengthen the case for a black hole primary.
We conclude by emphasizing the similarities between XTE J1118+480 and the black hole LMXB GRO J0422+32 in mini-outburst: both have orbital periods of hours, stayed in the low/hard X-ray state during outburst, had low X-ray luminosities, showed superhumps and had identical optical spectra (including the absorption troughs). Scaling the secondary of GRO J0422+32 from kpc to the distance of XTE J1118+480 ( kpc) gives , consistent with the reported 18.8 quiescent magnitude. The system parameters for GRO J0422+32 (taken from Chen et al. 1997) are also within our allowed range for a coherent explanation of both the Balmer line peak-to-peak velocity and the location of the Heii emission in XTE J1118+480. Quiescent studies, which can constrain the spectral type of the secondary and , will shed more light on this interesting object.
Acknowledgments
The authors are grateful to Mike Garcia and Jeff McClintock for very useful discussions, to Todd Tripp for sharing his knowledge of the APO Echelle spectrograph and to Rob Hynes for a very useful referee report. We are indebted to Ed Turner for granting us some of his Director’s discretionary time at APO. Support for this work was provided by NASA through Chandra Postdoctoral Fellowship grant number PF9-10006 awarded by the Chandra X-ray Center, which is operated by the Smithsonian Astrophysical Observatory for NASA under contract NAS8-39073. GD acknowledges support from the European Commission through the TMR network ‘Accretion on to Black Holes, Compact Stars and Protostars’ (contract number ERBFMRX-CT98-0195) and from the Leids Kerkhoven-Bosscha Fonds. RSJK acknowledges support from NSF grant AST96-16901 and the Princeton University Research Board. PS acknowledges support from NASA grant NAG 5-7278.
References
- (1) Callanan, P. J., Garcia, M. R., McClintock, J. E., Zhao, P., Remillard, R. A., Bailyn, C. D., Orosz, J. A.; Harmon, B. A., Paciesas, W. S., 1995, ApJ, 441, 786
- (2) Casares, J., Charles, P. A., Marsh, T. R., 1995a, MNRAS, 277, L45
- (3) Casares, J., Marsh, T. R., Charles, P. A., et al., 1995b, MNRAS, 274, 565
- (4) Cardelli, J. A. & Wallerstein, G., 1986, ApJ, 302, 492.
- (5) Chaty, S., Haswell, C. A., Smith, G. P., Smail, I., & Hynes, R. I., 2000, IAU Circ. 7394
- (6) Chen, W., Shrader, C.R. & Livio, M., 1997, ApJ, 491, 312.
- (7) Cohen, J.G., 1975, ApJ, 197, 117.
- (8) Cook, L., Patterson, J., Buczynski, D., & Fried, R., 2000, IAU Circ. 7397
- (9) Dhawan, V., Pooley, G. G., Ogley, R. N., & Mirabel, I. F., 2000, IAU Circ. 7395
- (10) la Dous, C., 1991, A&A, 252, 100
- (11) la Dous, C., 1989, A&A, 211, 131
- (12) Dubus, G., Lasota, J.-P., Hameury, J.-M., Charles, P. A., 1999, MNRAS, 303, 139
- (13) Esin, A.A. et al., 2000, preprint
- (14) Esin, A.A., McClintock, J. E., Narayan, R., 1997, ApJ, 489, 865
- (15) Esin, A.A., Narayan, R., Cui, W., Grove, J.E. & Zhang, S.-N., 1998, ApJ, 505, 854
- (16) Frank, J., King, A. R., & Raine, D. J. 1992, Accretion Power in Astrophysics, 2nd ed., Cambridge Univ. Press, Cambridge
- (17) Garcia, M., Brown, W., Pahre, M., McClintock, J., Callanan, P., & Garnavich, P., 2000, IAU Circ. 7392
- (18) Fender, R. P., Hjellming, R. M., Tilanus, R. J., Pooley, G. G., Deane, J. R., Ogley, R. N., Spencer, R. E., 2000, MNRAS, submitted
- (19) Harlaftis, E. T., Charles, P. A., Horne, K., 1997a, MNRAS, 285, 673
- (20) Harlaftis, E. T., Steeghs, D., Horne, K., Filippenko, A. V., 1997b, AJ, 114, 1170
- (21) Harlaftis, E. T., Horne, K., Filippenko, A. V., 1996, PASP, 108, 762
- (22) Haswell, C. A., King, A. R., Murray, J. R., Charles, P. A., 2000a, MNRAS, submitted (astro-ph/0008367)
- (23) Haswell, C. A., Hynes, R. I., & King, A. R., 2000b, IAU Circ. 7407
- (24) Haswell, C. A., Skillman, D., Patterson, J., Hynes, R. I., & Cui, W., 2000c, IAU Circ. 7427
- (25) Hummer, D. G., Storey, P. G., 1987, MNRAS, 224, 801
- (26) Hartmann, D. & Burton, W.B., 1997, Atlas of galactic neutral hydrogen (Cambridge: CUP)
- (27) Hynes, R. I., Charles, P. A., Haswell, C. A., Casares, J., Zurita, C., 2000a, in Proceedings of Astro-Tomography Workshop, Brussels, July 2000, Eds. H. Boffin, D. Steeghs, Springer-Verlag Lecture Notes in Physics (astro-ph/0008145)
- (28) Hynes, R. I., Mauche, C. W., Haswell, C. A., Shrader, C. R., Cui, W. & Chaty, S., 2000b, ApJL, 539, L37
- (29) Hynes, R. I., Haswell, C. A., Shrader, C. R., Chen, W., Horne, K., Harlaftis, E. T., O’Brien, K., Hellier, C., Fender, R. P., 1998, MNRAS, 300, 64
- (30) Ko, Y.-K., Kallman, T. R., 1994, ApJ, 431, 273
- (31) Kuulkers, E., 2000, A&A, submitted
- (32) Lubow, S. H., Shu, F. H., 1975, ApJ, 198, 383
- (33) Mauche, C., Hynes, R., Charles, P. & Haswell, C., 2000, IAUC 7401
- (34) Markoff, S., Falcke, H., Fender, R. P., ApJL, submitted (astro-ph/0010560)
- (35) Marsh T. R., 1998, in Wild Stars In The Old West: Proceedings of the 13th North American Workshop on CVs and Related Objects, ed. S. Howell, E. Kuulkers, C. Woodward, ASP Conf. Series, Vol. 137, p.236
- (36) Marsh, T. R., Horne, K., 1990, ApJ, 349, 593
- (37) Marsh, T. R., Horne, K., 1988, MNRAS, 235, 269
- (38) Marsh, T. R., Robinson, E. L., Wood, J. H., 1994, MNRAS, 266, 137
- (39) McClintock, J.E. et al., 2000, preprint
- (40) Merloni, A., Di Matteo, T. & Fabian, A.C., 2000, MNRAS, submitted (astro-ph/0006139)
- (41) Motch, C., Pakull, M. W., 1989, A&A, 214, L1
- (42) O’Donoghue, D., Charles, P. A., 1996, MNRAS, 282, 191
- (43) Papaloizou, J. C. B., Pringle, J. E., 1977, MNRAS, 181, 441
- (44) van Paradijs, J., McClintock, J. E., 1995, in X-ray Binaries, eds. W.H.G. Lewin, J. van Paradijs & E.P.J. van den Heuvel, (Cambridge: Cambridge University Press), p. 58.
- (45) van Paradijs, J., McClintock, J. E., 1994, A&A, 290, 133
- (46) Patterson, J. 2000, IAU Circ., 7412
- (47) Patterson, J., Raymond, J.C., 1985, ApJ, 292, 550
- (48) Pooley, G. G., & Waldram, E. M., 2000, IAU Circ., 7390
- (49) Remillard, R., Morgan, E., Smith, D., & Smith, E., 2000, IAU Circ. 7389
- (50) Revnivtsev, M., Sunyaev, R., & Borozdin, K., 2000, A&A, submitted (astro-ph/0005212)
- (51) Sakhibullin, N. A., Suleimanov, V. F., Shimanskii, V. V., Suleimanova, S. L., 1998, AstL, 24, 22
- (52) Seaton, M. J., 1978, MNRAS, 185, 5P
- (53) Shrader, C.R., Wagner, R.M., Hjellming, R.M., Starrfield, S.G., 1996, A&AS, 120, 261
- (54) Sembachs, K.R. & Danks, A.C., 1994, A&A, 289, 539.
- (55) Smak, J., 1985, AcA, 35, 351
- (56) Smak, J., 1981, AcA, 31, 395
- (57) Soria, R., Wu, K., Hunstead, R. W., 2000, ApJ, in press
- (58) Spitzer, L., 1978, Physical Processes in the Interstellar Medium (New York: John Wiley & Sons)
- (59) Spruit, H.C., 1998, astro-ph/9806141
- (60) Szkody, P., Piché, F., Feinswog, L., 1990, ApJSS, 73, 441
- (61) Tanaka, Y. & Lewin W.H.G., 1995, in X-ray Binaries, eds. W.H.G. Lewin, J. van Paradijs & E.P.J. van den Heuvel, (Cambridge: Cambridge University Press), p. 126.
- (62) Tanaka, Y., Shibazaki, N., 1996, ARA&A, 34, 607
- (63) Uemura, M., 2000, IAU Circ. 7418
- (64) Uemura, M., Kato, T., & Yamaoka, H., 2000, IAU Circ. 7390
- (65) Uemura, M. et al., 2000, PASJ, in press (astro-ph/0004245)
- (66) Vallerga, J.V., Vedder, P.W., Craig, N.; & Welsh, B.Y., 1993, ApJ, 411, 729
- (67) Wade, R. A., Hubeny, I., 1998, ApJ, 509, 350
- (68) Warner, B., 1995, Cataclysmic Variables, (Cambridge: Cambridge University Press)
- (69) White, N. E., van Paradijs, J., 1996, ApJ, 473, L25
- (70) White, N. E., Nagase, F. & Parmar, A. N., 1995, in X-ray Binaries, eds. W.H.G. Lewin, J. van Paradijs & E.P.J. van den Heuvel, (Cambridge: Cambridge University Press), p. 1.
- (71) Wilson, C. A. & McCollough, M. L., 2000, IAU Circ. 7390
- (72) Wood, K. S. et al., 2000, ApJL, submitted (astro-ph/0006234)
- (73) Yamaoka, K., Ueda, Y., Dotani, T., Durouchoux, P. & Rodriguez, J., 2000, IAU Circ. 7427
| Date (UT) | Epoch | Instrument | Wavelength coverage | Exposures |
|---|---|---|---|---|
| (HJD-2400000) | (Å) | |||
| April 7, 2000 | 51641.7 | DIS lowres | 4000-9000 | s |
| Echelle | 3500-9800 | s + s | ||
| April 20, 2000 | 51654.9 | DIS hires | 4200-5000 / 5800-6800 | s |
| April 23, 2000 | 51657.8 | DIS hires | 4200-5000 / 6200-7200 | s |
| May 6, 2000 | 51670.8 | DIS hires | 4200-5000 / 6300-7300 | s |
| May 12, 2000 | 51676.8 | DIS hires | 4200-5000 / 6300-7300 | s |
| May 15, 2000 | 51679.7 | DIS hires | 4200-5000 / 6300-7300 | s |
| May 28, 2000 | 51692.8 | DIS hires | 4200-5000 / 6300-7300 | s |
| July 3, 2000 | 51728.7 | DIS hires | 4200-5000 / 6300-7300 | s |
| July 4, 2000 | 51729.7 | DIS hires | 4350-5150 / 6050-7050 | s + s |


| Line | (Å) | (Å) | EW (Å) | FWHM (1000 km s-1) |
|---|---|---|---|---|
| H | 4340.5 | -24 | -1.10.4 | 2.10.5 |
| 4340.5 | 155 | 1.80.5 | 3.50.5 | |
| Hei | 4471.5 | 15 | -0.30.2 | 1.90.6 |
| 4471.5 | 45 | 0.70.4 | 4.00.8 | |
| Bowen blend | 4638 | 810 | -0.50.3 | 2.01.1 |
| Heii | 4686.7 | 03 | -1.50.4 | 2.30.4 |
| H | 4861.3 | -15 | -1.00.3 | 1.80.3 |
| 4861.3 | 136 | 1.50.5 | 3.10.4 | |
| Hei | 4921.9 | 25 | -0.20.2 | 1.40.6 |
| H | 6562.8 | 02 | -1.90.4 | 1.80.4 |
| Hei | 6678.1 | -15 | -0.60.4 | 1.80.8 |
NOTE. – Negative equivalent widths indicate emission lines, while positive values correspond to absorption troughs. is the rest wavelength and is the central wavelength at which each feature is observed.