Morphological Number Counts and Redshift Distributions to I = 25 from the Hubble Deep Fields: Constraints on Cosmological Models from Early Type Galaxies
Abstract
We combine magnitude and photometric redshift data on galaxies in the Hubble Deep Fields with morphological classifications in order to separate out the distributions for early type galaxies. The updated morphological galaxy number counts down to and the corresponding redshift distributions are used as joint constraints on cosmological models, in particular on the values of the density parameter and normalised cosmological constant . We find that an Einstein - de Sitter universe with simple passive evolution gives an excellent fit to the counts and redshift data at all magnitudes. An open, low , model with no net evolution (and conservation of the number of ellipticals), which fits the counts equally well, is somewhat less successful, predicting slightly lower mean redshifts and, more significantly, the lack of a high– tail. A number conserving model with a dominant contribution from , on the other hand, is far less successful, predicting a much narrower distribution than seen. More complex models are obviously possible, but we conclude that if large scale transmutation between types does not occur, then the lambda-dominated models provide a very poor fit to the current data.
keywords:
galaxies: photometry — galaxies: evolution — cosmology1 Introduction
Galaxy number counts have long been used as potential tests of cosmological models (Hubble 1934). However, as demonstrated by Tinsley (1972), they are also - indeed more strongly - dependent on galaxy evolution. Once redshift surveys at faint magnitudes became feasible (e.g., Broadhurst et al. 1988), further constraints could be placed on the models, breaking to some extent the degeneracy in terms of cosmological parameters versus evolution (see, e.g., the review by Ellis 1997). More recently, very high resolution imaging with the Hubble Space Telescope (HST) has added a further ingredient, in that we can now identify the morphological types of the individual very faint, distant galaxies (e.g., Driver et al. 1995a; Glazebrook et al. 1995). This has enabled counts to be made for the separate morphological types (e.g., Driver et al. 1995b; Odewahn et al. 1996; Abraham et al. 1996), removing some of the complications inherent in modelling the (varying) mix of types in the overall counts as a function of magnitude.
In a previous paper (Driver et al. 1996, hereafter DWPB), we used number counts of galaxies morphologically identified as ellipticals (or S0s) in HST Medium Deep Survey data to examine models with a wide range of the cosmological parameters and (the density parameter and normalised cosmological constant, respectively). As noted above, the restriction to a single type markedly reduces the complexity of the problem since (in principle) we have only one luminosity function and one set of k- and evolutionary corrections to deal with. Nevertheless there remained in DWPB a range of acceptable models, depending primarily on the amount of evolution, both stellar and dynamical, which was allowed.
Since DWPB, numerous studies have used the yet deeper (northern) Hubble Deep Field (HDF) data of Williams et al. (1996) to study the faint galaxy population (again see Ellis 1997 for a review). In the present paper we once more utilise morphological number counts, this time of HDF galaxies in both the northern and southern fields, but combine them with their photometric redshifts. The joint data on the galaxies classified as early types (E/S0) are then compared with the corresponding distributions predicted by simulations based on various cosmologies and evolutionary schemes, in an attempt to distinguish between the competing models. The simulations used, both here and in DWPB, were described in detail in Bristow (1996; see also Bristow & Phillipps 1997). 111In brief, a volume of space is populated Monte Carlo fashion with galaxies following an input luminosity function. Here, as in DWPB, we use that of Marzke et al. (1994). In the case of the E/SOs relevant here, they are then ascribed an intrinsic (zero redshift) surface brightness and a corresponding scale size. (They are all taken to have de Vaucouleurs’ (1948) intensity profiles). The corresponding observational parameters are calculated from the selected redshift, the given cosmology, an input spectrum, the required bandpass and the specified evolutionary model. (Evolution is assumed to alter only the surface brightness, not the size, of a galaxy). Finally, an image of the galaxy can be created and added, along with noise etc., to a simulated data frame with the characteristics of the actual observations used.
2 The HDF Early Type Galaxy Sample
The basic HDF imaging data set consists of long exposures with the replacement Wide Field Camera (WFPC2) through the four main broad band filters, F300W, F450W, F606W and F814W. The detection of galaxies and their magnitude measurement were done automatically using the SExtractor image analysis package (Bertin & Arnouts 1996). Details of the SExtractor parameters used and the zero-pointing of the ‘total’ magnitudes that were measured in the analyis of the Hubble Deep Field North (HDF-N) data are given in Driver et al. (1998, hereafter D98); the analysis of the Hubble Deep Field South (HDF-S) images was done in an identical manner, with photometric zero-points taken from the appropriate STScI web-site.
In this paper, we concentrate on the data taken through the F814W filter (which we will subsequently refer to as ‘’), since it was this image that was used for object detection (and thus the construction of our galaxy catalogue) and morphological classification. The latter was done for all galaxies in the catalogue brighter than , primarily using the “automatic neural network” (ANN) software of Odewahn et al. (1996), but supplemented with visual classifications conducted by one of us (WJC) – see D98 for details. Photometric redshifts, based on the galaxies’ broad-band colours, were determined by the Stoney Brook group in identical fashion for each sub-sample, and are taken from Fernandez-Soto et al. (1999) and Chen et al. (1998) for the HDF-N and HDF-S fields, respectively. (The photometric redshifts are superceded by spectroscopic ones where available). Further details of the combination of morphological, magnitude and photometric redshift data are given in D98; the galaxies classified as either E or S0 in the HDF-N are illustrated in the upper panel of their Plate L7. Note that the HDF-N observations were somewhat deeper than those for HDF-S, hence the slightly brighter sample limit here than in D98.
3 E/S0 Number Counts
HST number counts separated by morphological type have been presented by several groups: Casertano et al. (1995), Driver et al. (1995a, 1995b), Glazebrook et al. (1995), Odewahn et al. (1996), Abraham et al. (1996) and, for the HDF-N, D98. The counts from these various authors show good agreement for the early types (E/S0s), though we should note that Marleau & Simard (1998) have suggested that there has been a general overestimation of their numbers due to the inclusion of round but disc dominated systems. Our careful morphological examination of our sample would argue against this latter point, and in favour of the earlier count analyses.
We showed in DWPB that the early–type number counts could be fitted well by (at least) three distinct models, differing in their cosmological parameters and assumed evolutionary schemes (basically allowing different amounts of dynamical evolution). Each of these still fits the extended data set including the HDF-N and HDF-S galaxies, as can be seen from Figure 1. Note that all these models are predicated on the assumption that the number of elliptical galaxies is conserved. We consider the consequences of the breakdown of this assumption in Section 4.
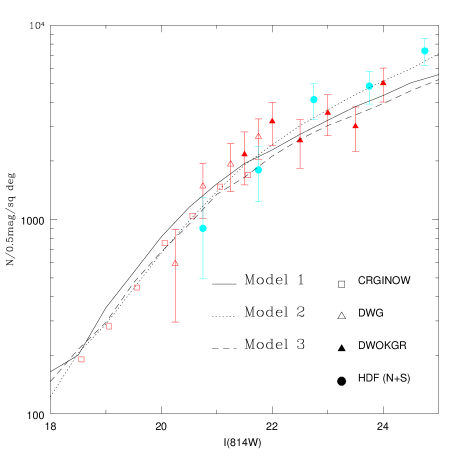
The first successful model (number 2 in DWPB; henceforth Model 1 here) had a standard Einstein - de Sitter cosmology and simple passive luminosity evolution approximated by , which is in fact a good approximation to the detailed predictions of population synthesis models (e.g., those of Bruzual & Charlot 1993, as used by Aragon-Salamanca et al. 1998 or Roche et al. 1998) for evolution at red and near-infra-red wavelengths, assuming a fairly early formation epoch . (An model with no evolution underpredicts the counts). Of course, it is possible that the real situation is more complex than such an evolutionary model allows; Abraham et al. (1999), for instance, have found evidence both for passively evolving old ellipticals at and for ellipticals with recent star formation at in the HDF-N.
An open model, (cf. number 3 in DWPB) with and no net evolution, i.e. with stellar population fading counteracted by mass evolution through merging, matches the counts equally well (our Model 2). Indeed, the two model predictions for the counts (suitably normalised) are the same to within 0.1 dex over the magnitude range , illustrating the difficulty in distinguishing between models with number counts alone (though the open model prediction is slightly steeper at the faintest magnitudes). McCracken et al. (2000) have similarly shown that the faint K-band galaxy counts (expected to be domimated by early type galaxies) are also well fitted by either a non-evolving low model or a modestly evolving model.
DWPB also investigated various ‘flat’ models with a non-zero cosmological constant, i.e. models with . A model with , for example, is favoured by large scale structure arguments (e.g., Cole et al. 1997), and by the comparison of cosmic microwave background and SNIa data (Lineweaver 1998). For a given evolutionary scheme, increasing at the expense of significantly steepens the predicted counts, so in order to make such a model (with conserved numbers) fit the data it is necessary to adopt extreme negative evolution, i.e. high– ellipticals were so much smaller (less massive) than today’s as to overwhelm the effect of their stellar population brightening. This may not be too unreasonable at high (cf. D98). Our Model 3 thus has , and , which again matches the counts and is essentially indistinguishable from the other two models across our observed magnitude range, again emphasising the need for a ‘tie-breaker’.
4 E/S0 redshift distribution
As the additional constraint which allows us to discriminate between the different models, we take the combined redshift distribution of E/S0 galaxies in the two Hubble Deep Fields. By combining the HDF-N and HDF-S data sets, we improve the statistics and reduce the effects of clustering along any one line of sight. Furthermore, comparisons with spectroscopic redshifts have shown that photometric redshifts are generally accurate to 0.1 or better (Fernandez-Soto et al. 1999), which is certainly more than adequate for our purpose.
First consider the brighter galaxies in our sample (for which there is least ambiguity in morphology). Figure 2 shows the E/S0 redshift distribution observed in the range , along with the predictions of the three models, all normalised to the observed number of galaxies. Compared to the open model, luminosity distance is smaller at given for the model, so conversely is larger at given and hence at any given distance modulus or apparent magnitude. Since the model fit to the counts requires net positive luminosity evolution (galaxies brighter at larger ) in the model (but not in the open model), this further increases the mean at any magnitude. The greater difference between the models at larger also tends to spread out the expected distribution for , leading to a significant high– tail.
The general distribution of redshifts seen in Figure 2 is, in fact, in remarkably good agreement with that predicted for the Einstein - de Sitter plus passive evolution model (left hand panel). We do not have sufficient numbers to test the shape of the distributions in any detailed way, but we can see that at , the mean redshift compared to the model prediction of 0.76. Furthermore, 6 galaxies (%) have redshifts in the range compared to a predicted 21%. The non-evolving model (centre panel) has a predicted = 0.65, i.e. lower, but probably not significantly so. However, only 4% of objects (i.e. 1–2) should be at , in substantial conflict with the data here and in D98. If this model were correct we would expect to see many more of the galaxies at .
In the –dominated models, distances are even larger at given than for the open model, so basically we do not expect to see to very large . This is compounded by the fact that we need negative evolution to fit the counts in this model. The predicted maximum is therefore lower at each apparent magnitude. In addition we expect the distribution to be narrowed on the other side because of the relatively smaller volume at low . Thus, although is similar to that in the other models (0.71), there should be essentially no galaxies seen at or . Both these aspects make the high model (right hand panel of Figure 2) a very poor fit to our observed .
At fainter magnitudes, the predicted mean continues to grow substantially for the E-deS model (less so for the open and lambda models) and tracks the observed mean really rather well; = 1.01 predicted at compared to observed in the present sample and 1.25 predicted, observed at for the HDF-N (see D98: this excludes the handful of objects apparently at in D98). The general wide spread of redshifts in each magnitude slice (D98) is clearly more characteristic of the evolving model, too.

5 Discussion and Summary
From a theoretical galaxy formation point of view, one might nowadays perhaps favour the non-evolving, open universe fit to the counts, since dynamical evolution via mergers (e.g., Kauffmann & White 1993) is expected to counteract quite closely the fading of stellar populations with time (see DWPB). Indeed, in the context of brightest cluster galaxies, Aragon-Salamanca et al. (1998) have found that their empirical result of no net evolution in luminosity of BCGs for requires an amount of growth by mergers which is matched almost exactly by current semi-analytic models in open CDM universes (in particular, those of Baugh et al. 1996 and Kauffmann & Charlot 1998). Thus, in this model, both the BCG and general E/S0 galaxy dynamical evolution are the same and matched by theory. (Further, Le Fevre et al. (2000) have found a variation of galaxy close pair fraction with which would be consistent with mergers occuring at the correct rate to more or less cancel the stellar evolution).
In order to make this model fit our redshift data, we would have to explain away the high– tail of the distribution. (The apparent lack of a high– tail in other data, for instance moderately deep K-band selected samples, has sometimes been used as evidence for the model where mergers induce zero net evolution, see, e.g., Kauffmann & Charlot 1998). Accordingly, we have checked the credentials of objects that populate the high–redshift tail of Figure 2 to eliminate the possibility that they are in any way spurious. Firstly, we conducted a visual inspection of each object to make sure that this subset of the population is not contaminated by misclassified early–type spirals nor any other type of object. In all cases the classification of these objects as E, E/S0, S0 or S0/a types was categorical. A second possibility is that the redshifts of these objects have been overestimated. However, 5 of the 6 galaxies have now had their redshifts measured spectroscopically and are thus quite secure. Hence we see no reason to doubt that the population of E/S0s at is both real and significant in number.
For universes, as favoured by our redshift results, Aragon-Salamanca et al. (1998) find that the BCGs must have undergone negative net evolution, i.e. stronger merging, as indeed is appropriate to the semi-analytic models for CDM. This is the opposite of what we would require for the counts in this case. In other words, for the model to fit both the BCG luminosities and the general E/S0 galaxy counts we need strong merger evolution of the BCGs but essentially none (i.e. passive evolution only) for early type galaxies as a whole. Interestingly, Mobasher & Trentham (1998) have recently shown, on the basis of -band luminosity functions of galaxy clusters, that the latter, at least, does appear to be the case. They find no evidence for an increase in the stellar mass of ordinary early type galaxies since , the data being consistent with purely passive evolution. Kodama, Bower & Bell (1999) have also found that the colour – magnitude relation for early type galaxies at (specifically HDF galaxies as studied here) is consistent with passive evolution from that epoch until the present (though the shallow slope of the C–M relation makes it a weak discriminant of mass evolution). (See also Moles et al. 1998 for other arguments against significant dynamical evolution at recent epochs). Blain et al. (1999) also tentatively support an , rather than an open or lambda–dominated model to explain the sub-mm counts and infra-red background data. This would be in line with our current result. Note that a prediction of this model, assuming the BCG result to be correct, is that should be smaller at higher . Of course, it is possible that the true situation
In a lambda–dominated model, distances to a given are much higher than in the conventional models, so the Aragon-Salamanca et al. BCGs would have to have strong positive evolution, i.e. a net brightening in the past. The difference between the required evolution of BCGs and ordinary ellipticals noted above for the model would then be reversed, little or none for BCGs and large amounts for ellipticals in general. This might well be considered a much less palatable option. Note that the conflicting requirements for the counts and the BCG Hubble diagram, here (and in the case), arise because while distances are greater than in the open model, making galaxies look fainter, there is more volume, thus steepening the counts (the opposite ocurring for ). Avoiding the requirement for large negative evolution would imply a very significant undercounting of ellipticals in the HDF data. (The opposite of the effect claimed in the one non-concordant analysis (Marleau & Simard 1998).) Even a model with no evolution predicts twice as many galaxies at as the successful models (cf. DWPD).
In addition to any problem with the evolution, making the lambda model which fits the counts also fit our requires us to have mistakenly included non-ellipticals at both high and low . This would clearly make the real counts lower, making it even harder for the lambda–dominated model to fit them. (Alternatively we might have missed a number of medium ellipticals, so that the real counts should be higher and the distribution more peaked, but it is hard to see how this might occur). These problems are in apparent conflict with the recent arguments (e.g., Lineweaver 1998) in favour of models with a significant cosmological constant. We discuss this further below.
The three models from DWPB which fit the counts also represent the three generic types of model currently favoured by large scale structure arguments (e.g. Lin et al. 1996; Cole et al. 1997). The three most studied ways out of the problems faced by the standard cold dark matter picture (SCDM) are to keep but change the initial fluctuation spectrum (tilted CDM), move to a low universe (open CDM), or invoke a non-zero cosmological constant (lambda CDM). 222Note that this is only a restricted identification of our empirical models with the CDM models; it does not (necessarily) imply the whole structure formation picture based on the CDM variants, only the use of the same values of the cosmological parameters. Thus the attempt to break the degeneracy of these models in the galaxy counts also has relevance to the large scale structure problem. If really is unity, as suggested by the counts and redshifts, this might indicate that it is the primordial spectrum which needs to be adjusted. A high is consistent with data on Cosmic Microwave Background fluctuations (Turner 1999), which primarily constrain to be near unity (de Bernardis et al. 2000), and with supernova observations at moderate redshift (Perlmutter et al. 1997). However, it is incompatible with the Hubble diagram for high–redshift supernovae (Perlmutter et al. 1998, Reiss et al. 1998). The model also has problems with, for instance, the observed high baryon fraction in clusters, and generally scores poorly in Peebles’ (1999) summary of current tests of viable world models.
To summarise, then, following up the work of DWPB, who found a range of possible cosmological models which could fit the number counts of early type galaxies observed by HST, we have addded a further constraint in the distribution of (photometric) redshifts for very faint (northern and southern) HDF E/S0 galaxies. We find remarkably good agreement in the case of a standard Einstein - de Sitter universe with passively evolving early type galaxies. If the preference for a high density model is confirmed (and see above for arguments against it), then it appears that we require significantly different evolution for ellipticals as a whole (i.e. negligible merging at recent epochs) compared to first ranked cluster galaxies used in the Hubble diagram (which are consistent with the theoretically expected amount of merging more or less cancelling the stellar population evolution).
The perhaps initially preferred open model with no net evolution (i.e. stellar fading cancelled by growth through mergers) proves to be somewhat less successful, primarily because it does not predict sufficient galaxies in the high–redshift tail. Further confirmation that these objects really are genuine ellipticals at would obviously be of great value here. Even larger problems face the currently favoured models dominated by a cosmological constant (Lineweaver 1998, Turner 1999, Peebles 1999). Those which can match the number counts predict a narrow range of redshifts (), quite unlike the fairly flat distribution out to high– actually seen. They also appear to require the unlikely circumstance of no merger evolution for BCGs but large amounts (very small precursors at moderate ) for ellipticals in general.
We have already considered conceivable problems with the data which might allow consistency with the low models. On the modelling side, the faint end of the E/S0 luminosity remains problematic (see DWPB). Possibly more importantly, our models all conserve the number of large (i.e. potentially visible) systems, i.e. there is no number evolution (see He & Zhang 1999). Even though we allow merger evolution, we do not specifically increase the normalization of the LF with (unlike, say, Rocca-Volmerange & Guiderdoni (1990) who increase their Schechter function normalisation in step with the decrease in characteristic luminosity). This means that we are essentially allowing largish ellipticals to grow further by accreting small neighbours, rather than by equal mass mergers. At the opposite extreme, we can simply double the numbers of visible galaxies at for the model, or multiply by 4 for the lambda model (consistent with the required changes in via mergers, in each case). Even this predicts only 8% or 1% of galaxies in the high– tail, still far fewer than actually seen. Finally, none of our models allow for the wholesale transmutation between galaxy types. If there were fewer early type galaxies at higher , that is they continue to form (as opposed to grow) recently via mergers, fading or harrassment (Moore et al. 1998 and references therein), this would not change our conclusions since an even smaller high– tail would be predicted in models which already underpredict the numbers seen at large . On the other hand, the existence, temporarily, of additional spheroidal merger remnants which then grow new discs (Windhorst et al. 1998a,b; Scoville et al. 1997; Pascarelle et al. 1996) might perhaps allow a better fit for the low models, the observed high– objects then being from effectively a separate population. We will consider whether any possible mechanisms of this sort might allow consistency of the counts and redshift data with the currently popular lambda–dominated models in a subsequent paper. For now, we conclude that if large scale transmutation of types does not occur, then the lambda–dominated models are a very poor fit to the current data.
Acknowledgements
We would like to thank Richard Bower, Malcolm Bremer, Matthew Colless, Roberto de Propris, Carlos Frenk, Bryn Jones, Charlie Lineweaver, Henry McCracken, Brian Schmidt and Tom Shanks for useful comments. SP was supported by the Royal Society via a University Research Fellowship during the course of this work. WJC, SPD and AFS acknowledge the financial support of the Australian Research Council and the Department of Industry, Science and Technology at various stages of this project.
References
- [Abraham et al. 1996] Abraham R.G., Tanvir N.R., Santiago B.X., Ellis R.S., Glazebrook K., van den Bergh S., 1996, MNRAS, 279, 47
- [Abraham et al. 1999] Abraham R.G., Ellis R.S., Fabian A.C., Tanvir N.R., Glazebrook K, 1999, MNRAS, 303, 641
- [Aragon-Salamanca et al. 1998] Aragon-Salamanca A., Baugh C., Kauffmann G., 1998, MNRAS, 297, 427
- [Baugh et al. 1996] Baugh C., Cole S., Frenk C.S., 1996, MNRAS, 283, 1361
- [Bertin & Arnouts 1996] Bertin E., Arnouts S., 1996, A&A, 117, 393
- [Blain et al. 1999] Blain A.W., Smail I., Ivison R.J., Kneib J.-P., 1999, MNRAS, 302, 632
- [Bristow 1996] Bristow P.D., 1996, Ph.D. Thesis, University of Wales, Cardiff
- [Bristow & Phillipps 1997] Bristow P.D., Phillipps S., 1997, Astr.Lett.Comm., 36, 387
- [Broadhurst et al. 1988] Broadhurst T.J., Ellis R.S., Shanks T., 1988, MNRAS, 235, 827
- [Bruzual and Charlot 1993] Bruzual A.G., Charlot S., 1993, ApJ, 405, 538
- [Burg et al. 1997] Burg C.A., Windhorst R.A., Odewahn S.C., de Jong R.S., Frogel J.A., 1997, in The Ultraviolet Universe at Low and High Redshift: Probing the Progress of Galaxy Evolution, eds. W.H. Waller, M.N. Fanelli, J.E. Hollis, A.C. Danks, p. 434
- [Casertano et al. 1995] Casertano S., Ratnatunga K.U., Griffiths R.E., Im N., Neuschaefer L.W., Ostrander E.J., Windhorst R.A.,, 1995, ApJ, 453, 699
- [Chen et al. 1998] Chen H-W., Fernandez-Soto A., Lanzetta K.M., Pascarelle S.M., Puetter R.C., Noriaki Y., Yahil A., 1998, astro-ph/9812339
- [Cole et al. 1997] Cole S., Weinberg D.H., Frenk C.S., Ratra B., 1997, MNRAS, 289, 37
- [de Bernardis et al. 2000] de Bernardis P., et al., 2000, Nature, 404, 955
- [de Vaucouleurs 1948] de Vaucouleurs G., 1948, Ann.d’Ap., 11, 247
- [Driver et al. 1995a] Driver S.P., Windhorst R.A., Griffiths R.E., 1995a, ApJ, 453, 48
- [Driver et al. 1995b] Driver S.P., Winhorst R.A., Ostrander E.J., Keel W.C., Griffiths R.E., Ratnatunga K.U., 1995b, ApJ, 449, L23
- [Driver et al. 1996] Driver S.P., Windhorst R.A., Phillipps S., Bristow P.D., 1996, ApJ, 461, 525
- [Driver et al. 1998] Driver S.P., Fernandez-Soto A., Couch W.J., Odewahn S.C, Windhorst R.A., Phillipps S., Lanzetta K., Yahil A., 1998, ApJ, 496, L93 (D98)
- [Ellis 1997] Ellis R.S., 1997, ARA&A, 35, 389
- [Fernandez-Soto et al. 1999] Fernandez-Soto A., Lanzetta K.M., Yahil A., 1999, ApJ, 513, 34
- [Glazebrook et al. 1995] Glazebrook K., Ellis R.S., Santiago B., Griffiths R.E., 1995, MNRAS, 275, L19
- [He and Zhang 1999] He P., Zhang Y.-Z., 1999, ApJ, 511, 574
- [Hubble 1934] Hubble E.P. 1934, ApJ, 79, 8
- [Kauffmann and Charlot 1998] Kauffmann G., Charlot S., 1998, MNRAS, 294, 705
- [Kauffmann and White 1993] Kauffmann G., White S.D.M., 1993, MNRAS, 261, 921
- [Kodama at al. 1999] Kodama T., Bower R.G., Bell E.F., 1999, MNRAS, 306, 561
- [Lanzetta et al. 1996] Lanzetta K.M., Yahil A., Fernandez-Soto A., 1996, Nature, 381, 759
- [Le Fevre et al. 2000] Le Fevre O., et al., 2000, MNRAS, 311, 565
- [Lineweaver 1998] Lineweaver C., 1998, ApJ, 505, L69
- [Marleau & Simard 1998] Marleau F.R., Simard L., 1998, ApJ, 507, 585
- [Marzke et al. 1994] Marzke R.O., Geller M.J., Huchra J.P., Corwin H.G., 1994, AJ, 108, 437
- [McCracken et al. 2000] McCracken H., Metcalfe N., Shanks T., Campos A., Gardner J.P., Fong R., 2000, MNRAS, 311, 707
- [Moles et al. 1998] Moles M., Campos A., Kjeargaard P., Fasano G., Bettoni D., 1998, ApJ, 495, L31
- [Moore et al. 1998] Moore B., Lake G., Katz N., 1998, ApJ, 495, 139
- [Odewahn et al. 1996] Odewahn S.C., Windhorst R.A., Keel W.C., Driver S.P., 1996, ApJ, 472, L13
- [Pascarelle et al. 1996] Pascarelle S.M., Windhorst R.A., Keel W.C., Odewahn S.C., 1996, Nature, 383, 45
- [Peebles 1999] Peeble P.J.E., 1999, Phil. Trans. R. Soc. Lond A, 357, 21
- [Perlmutter et al. 1997] Perlmutter S., et al., 1997, ApJ, 483, 581
- [Perlmutter et al. 1998] Perlmutter S., et al., 1998, Nature, 391, 51
- [Reiss et al. 1998] Reiss A.G. et al., 1998, AJ, 116, 1009
- [Rocca-Volmerange and Guiderdoni 1990] Rocca-Volmerange B., Guiderdoni B., 1990, MNRAS, 247, 166
- [Roche et al. 1998] Roche N., Eales S.A., Rawlings S., 1998, MNRAS, 297, 405
- [Scoville et al. 1997] Scoville N.Z., Yun M.S., Windhorst R.A., Keel W.C., Armus L., 1997, ApJ, 485, L21
- [Tinsley 1972] Tinsley B.M., 1972, ApJ, 178, 319
- [Trentham and Mobasher 1998] Trentham N., Mobasher B., 1998, MNRAS, 299, 488
- [Turner 1999] Turner M.S., 1999, Phil. Trans. Roy. Soc., 357, 7
- [Williams et al. 1996] Williams R.E., et al., 1996, AJ, 112, 1335
- [Windhorst et al. 1998a] Windhorst R.A., Keel W.C., Pascarelle S.M., 1998a, ApJ, 494, L27
- [Windhorst et al. 1998b] Windhorst R., Pascarelle S., Odewahn S., Cohen S., Burg C., Keel W., Driver S., 1998b, in The Hubble Deep Field, eds. M. Livio, S.M. Fall, P. Madau, p. 481