On the Gas Surrounding High Redshift Galaxy Clusters1
Abstract
Francis & Hewett (1993) identified two 10-Mpc scale regions of the high redshift universe that were seemingly very overdense in neutral hydrogen. Subsequent observations showed that at least one of these gas-rich regions enveloped a cluster of galaxies at redshift 2.38. We present improved observations of the three background QSOs with sightlines passing within a few Mpc of this cluster of galaxies. All three QSOs show strong neutral hydrogen absorption at the cluster redshift, suggesting that this cluster (and perhaps all high redshift clusters) may be surrounded by a Mpc scale region containing of neutral gas.
If most high redshift clusters are surrounded by such regions, we show that the gas must be in the form of many small ( kpc), dense () clouds, each of mass . These clouds are themselves probably gathered into kpc sized clumps, which may be galaxy halos or protogalaxies.
If this gas exists, it will be partially photoionised by the UV background. We predict the diffuse Ly flux from this photoionisation, and place observational limits on its intensity.
2 Research School of Astronomy and Astrophysics, Australian National
University, Canberra ACT 0200: pfrancis, gmw@mso.anu.edu.au
3 Joint appointment with the Department of Physics, Faculty of Science
4 NASA Goddard Space-Flight Center, Code 681, Greenbelt, MD 20771, USA:
woodgate@s2.gsfc.nasa.gov
Keywords: galaxies: clusters: individual (21424420) — galaxies: distances and redshifts — quasars: absorption lines
1 Introduction
What did galaxy clusters look like ten billion years ago? Simulations (eg. Brainerd & Villumsen 1994, Jenkins et al. 1998, Cen 1998) suggest that the ancestors of present day rich galaxy clusters contained very little mass at redshifts above two: there simply hadn’t been time enough to assemble much dark or baryonic matter. Even the richest proto-clusters would only have had about double the average density of the universe. These proto-clusters would typically have been filamentary in shape, and due to their small masses would not have been in virial equilibrium.
Despite their modest overdensities, these protoclusters could have been the sites of the first galaxy formation. If galaxies had formed in these proto-clusters but not in the field, the overdensity of galaxies within the proto-cluster would be much greater than the overdensity of mass (biasing, eg. Fry 1996, Bagla 1998, Baugh et al. 1999, Tegmark & Peebles 1998).
The observational situation is less clear. Galaxy clusters are now routinely being studied out to redshifts . These clusters are remarkably similar to low redshift clusters: they are massive virially bound objects with strong X-ray emission (eg. Rosati et al. 1998, Deltorn et al. 1997). Thus galaxy clusters appear to be well established by redshift one (see also Renzini 1997, Donahue & Voit 1999).
Observations at higher redshifts still are sparse. It is now clear that galaxies at are at least as strongly clustered as galaxies today (eg. Heisler, Hogan & White 1989, Quashnock, Vanden Berk & York 1996, Malkan, Teplitz & McLean 1996, Steidel et al. 1998, Giavalisco et al. 1998, Campos et al. 1999, Pascarelle, Windhorst & Keel 1998, Adelberger et al. 1998, Djorgovski et al. 1999), as predicted by the biasing model. The structure, mass and galaxy populations of these galaxy concentrations are, however, obscure.
A growing body of evidence suggests that high redshift clusters contain substantial quantities of gas. The strongest evidence comes from high redshift radio galaxies, which are believed to sit in dense cluster environments (eg. Pentericci et al. 1997, Ivison et al. 2000). Many show high rotation measures (Carilli et al. 1997, Pentericci et al. 2000), possibly extended X-ray emission (Carilli et al. 1998), extensive emission-line halos (Bicknell et al. 2000) and associated absorption lines (Binette et al. 2000), suggesting the presence of dense inhomogeneous gas around the galaxies.
Are the clusters around radio galaxies typical? The evidence for gas in other high redshift clusters is sparse. Francis et al. (1996) and Steidel et al. (1998) both found QSO absorption lines seemingly coincident with high-z clusters. Tentative Sunyaev-Zel’dovich effect decrement measurements have been claimed around other possible high-z clusters (eg. Campos et al. 1999). 100 Kpc scale diffuse ‘blobs’ of Ly emission have been found in the centres of two high-z clusters (Francis et al. 1996, Francis, Woodgate & Danks 1997, Steidel et al. 2000).
Most of these observations suggest the presence of hot ionised gas in the central few hundred kpc of the clusters. Francis & Hewett (1993), however, presented tentative evidence for the existence of large concentrations of neutral gas extending over Mpc scales in the high redshift universe. One of their concentrations was associated with a group of galaxies (Francis, Woodgate & Danks 1997). Their evidence was not conclusive, and there is currently no such data available for other clusters, but it is at least possible that similar extended halos of neutral gas surround all high redshift clusters.
In this paper, we concentrate on one of Francis & Hewett’s clusters: the 21424420 galaxy concentration at redshift 2.38. In Section 2 we present new data on this cluster, strengthening the case for a large halo of neutral gas surrounding it. In Section 3 we investigate ways of reconciling high neutral gas masses with cosmological models. In Section 4 we describe our attempt to observe diffuse Ly emission from the hypothesised gas halo, and place upper limits on its intensity. Except where stated, we assume , and an open universe with and either or (both values of give the same angular size distance and luminosity distance at redshift 2.38).
2 Observations of the 21424420 Cluster
2.1 Review of the 21424420 Cluster Properties
The 21424420 cluster lies at redshift 2.38, at coordinates 21:42:3044:20:30 (J2000). As will be shown, it is a region of the early universe that is highly overdense in Ly emitting galaxies. It is unlikely to be gravitationally bound, and so would not meet most low redshift definitions of a galaxy cluster.
Francis & Hewett originally identified the cluster as a pair of strong Lyman limit systems at matching redshifts (2.38) in two 19th magnitude QSOs: 21384427 and 21394434. The QSO sight-lines are 500′′ ( proper Mpc) apart at (both QSOs lie at ). Such a pair of Lyman-limit systems at matching wavelengths is unlikely to occur by chance in Francis & Hewett’s sample. As we report in Section 2.2, a third QSO has been found behind the cluster, and it too shows strong Ly absorption at the cluster redshift.
Are there any galaxies associated with this concentration of QSO absorption lines? Many high redshift galaxies show weak Ly emission (Steidel et al. 1996, Hu, Cowie & McMahon 1998). The field containing the three QSOs, however, contains three strong Ly emitting galaxies at , with Ly fluxes (Francis et al. 1996, Francis, Woodgate & Danks 1997); an order of magnitude greater than that of normal galaxies at these redshifts. All three have reliable spectroscopic redshifts.
Do three such sources constitute a cluster? Strong Ly emitters are rare at these redshifts: Francis et al. surveyed a total volume of 460 co-moving cubic Mpc, but all three sources were found within a 5 cubic co-moving Mpc volume: ie. 1% of the surveyed co-moving volume. Martínez-González et al. (1995) surveyed a co-moving volume of 1400 cubic Mpc at for Ly emitting sources to a comparable flux limit but detected nothing. The odds of the cluster being an artifact of the coincidental proximity of three such sources is thus (the probability of finding two more such objects within one proper Mpc of the first), ie. . Clearly the space density of Ly emitting galaxies in this region is higher than average.
Could the presence of absorption in all three QSOs be coincidental, or is the cluster really surrounded by Lyman-limit absorption-line systems? The transverse separation of the QSO sight-lines is Mpc, which corresponds to a redshift difference of Å along the line of sight. The absorption-line systems all have equivalent widths of Å. The probability of seeing an absorption line with an equivalent width this strong within Å of any given wavelength is % (Francis & Hewett 1993). Thus the probability of finding three such absorption-line systems within the cluster by chance is .
This calculation should be regarded with caution: this region was first identified as interesting because of the absorption in the two original QSOs (Francis & Hewett 1993), so the statistics are a posteriori. The third QSO, however, was not involved in selecting this region for study, and its coincident absorption alone makes this region overdense in Lyman-limit systems with 98% confidence.

Fig. 1 should make the geometry of the cluster clearer. Due to the low predicted overdensities of clusters at this redshift (Section 3.2), peculiar motions should be very small, so three dimensional positions are plotted assuming that all redshift differences are due to distance. The three Ly galaxies lie within one Mpc of each other. The absorption-line systems are far more dispersed, extending both to lower redshifts and transversely by Mpc.
The spatial extent and overdensity of this cluster are comparable to those of the clusters of Lyman-break galaxies being found by Steidel et al (1998) at : this cluster may be a representative of the same class of object.
2.2 Observations
Véron & Hawkins (1995) searched an area including this cluster for variable sources. In addition to both previously identified QSOs, they discovered a third QSO lying between the two: QSO 21394433 at z=3.22 (ie. at the same redshift as the other two background QSOs). We measured a position for QSO 21394433 (21:42:22.1644:19:28.7, J2000) using our R-band image with an astrometric solution bootstrapped from on-line scans of UK Schmidt plates (Drinkwater, Barnes & Ellison 1995). A spectrum was obtained with the Low Dispersion Survey Spectrograph (LDSS, Colless et al. 1990) on the Anglo-Australian Telescope on the nights of 1996 August 13 and 14. The total exposure time was 47,700 sec, and the spectral resolution 700. Part of the spectrum is shown in Fig 2.

As Fig 2 shows, the new QSO 21394433 has a strong absorption-line system close in wavelength to the absorption in the two previously known QSOs at z=2.38. This further confirms the remarkable gas properties of this cluster.
Our original spectra of QSOs LBQS 21384427 and 21394434 are described by Francis & Hewett (1993). Their resolution was excellent (full width at half maximum height ) but the wavelength coverage (4000 – 4600 Å) was small. An additional spectrum of QSO 21394434 was obtained with the KPGL1 grating in the Blue Air camera of the RC spectrograph on the CTIO 4-m telescope on 1995 August 20. Total exposure time was 12,000 sec, with a spectral resolution of 200. This spectrum, while inferior in resolution to the spectrum of Francis & Hewett, covers 3200 – 6200 Å: this greater wavelength range allows us to study CIV and Ly absorption from the cluster.


2.3 Absorption Line Measurements
Combining the old and new data on the two brighter QSOs, we fit Voigt profiles interactively to the absorption at the cluster redshift, using the Xvoigt program (Mar & Bailey 1995). The low spectral resolution, restricted wavelength coverage and blending in our spectra make this process a difficult and ambiguous one. Nonetheless, certain definite conclusions can be reached. Multiple components are required to obtain adequate fits to the Ly absorption (Fig 3). A minimum of 2–4 components are required (Tables 1, 2): many more, each with smaller column densities, give equally good fits. The column densities of the subsidiary systems are not well constrained. We could not determine the velocity dispersion of the metal lines: an upper limit of can be placed. The central component of the Ly absorption in all three QSOs was broader: the flux touches zero over or more.
| Column density | ||||
|---|---|---|---|---|
| System | Ion | Redshift | ||
| A | H I 121.6 | 2.3825 | 20.47 | 20.47 |
| Si II 130.4 | 2.3823 | 14.63 | 14.72 | |
| Si II 126.0 | 2.3825 | 14.63 | 14.22 | |
| Si III 120.6 | 2.3824 | 14.30 | 13.98 | |
| O I 130.2 | 2.3820 | 16.22 | 15.47 | |
| C I 127.7 | 2.3821 | 14.62 | 14.70 | |
| C II 133.4 | 2.3822 | 16.00 | 15.13 | |
| B | H I 121.6 | 2.3731 | 13.97 | 14.10 |
| Column density | ||||
|---|---|---|---|---|
| System | Ion | Redshift | ||
| A | H I 121.6 | 2.3792 | 19.80 | 19.67 |
| Si II 130.4 | 2.3794 | 13.63 | 13.80 | |
| Si II 126.0 | 2.3792 | 13.53 | 13.67 | |
| Si III 120.6 | 2.3789 | 13.45 | 13.55 | |
| O I 130.2 | 2.3804 | 16.00 | 15.47 | |
| C I 127.7 | 2.3790 | 14.00 | 14.17 | |
| C II 133.4 | 2.3783 | 16.03 | 15.13 | |
| C IV 154.8 | 2.3787 | 14.30 | 14.23 | |
| C IV 155.1 | 2.3787 | 14.17 | 14.43 | |
| B | H I 121.6 | 2.3890 | 14.56 | 14.37 |
| C | H I 121.6 | 2.3865 | 14.07 | 14.07 |
| D | H I 121.6 | 2.3724 | 16.93 | 14.80 |
We searched for metal-line absorption at the redshift of the dominant Ly absorption components. With the exception of C IV, these all lie within the Ly forest, and hence may be chance coincidences with the forest lines. The strongest line near the expected wavelength was fit, assuming velocity widths of and , and the results are shown in Tables 1 and 2. Due to the risk of blending or confusion with Ly forest lines, the metal line column densities should be taken as upper limits. Plots of the metal lines within the forest can be found in Francis & Hewett. Note that in QSO 21384427, strong absorption lines were invariably detected at the expected wavelengths, while in QSO 21394434 the lines were weaker and at slightly shifted wavelengths. We conclude that the central absorption component in QSO 21384427 does contain metals, roughly as measured, while for QSO 21394434 some or all of the putative lines (except C IV) may be misidentified Ly forest lines. Our spectrum of QSO 21394433 had too low a resolution to determine anything other than the Ly redshift (2.366) and column density ().
Are the absorption-line systems really Lyman-limit systems, or could they just be clusters of lower column density Ly forest lines? In QSO 21384427 the Ly line shows broad wings, and strong absorption is seen at the expected wavelength of most common metal absorption lines: it therefore seems probable that this is, as modelled, a high column density absorption system, probably lying on the column density borderline between Lyman-limit and damped Ly systems. The spectrum of QSO 21394433 is of too low resolution to say much, but the great width and equivalent width of the Ly absorption also suggest that its absorption column is large.
In QSO 21394434, however, the situation is more ambiguous. It is possible to fit the Ly absorption either with a single absorption-line system with column density (plus three much weaker components in the wings), or with a blend of weaker Ly lines, spread over and with a combined neutral hydrogen column density that can be as low as . Two pieces of evidence support this latter fit. Firstly, the redshifts of the supposed metal-lines vary by (though some or all may be chance coincidences with Ly forest lines). This can be explained if they are coming from different subcomponents of the absorption system. Secondly, there is tentative evidence that Ly absorption is weak: the spectrum is poor at this wavelength, and the continuum hard to define, but the Ly absorption can be well fit with column densities as low as (though much greater columns also give acceptable fits). On the other hand, the strength of the metal lines, especially low ionisation lines such as C II, imply that the neutral hydrogen column density is . Note, however, that with the exception of C IV, these lines could be contaminated by Ly forest absorption.
Note that the total gas column density in the form of the absorbing clouds is almost independent of the interpretation of the data. Gas with a neutral column density of is predicted to be mostly neutral and hence to have a total gas column density . Gas with a neutral column density of , on the other hand, is predicted to be strongly ionised by the UV background, and hence its total gaseous column density will be greater than the neutral column density. Thus the total hydrogen column would be roughly the same as for the damped Ly interpretation.
3 The Nature of the Gas
The three QSO sight-lines may be unrepresentative of the space around this cluster. If they are representative, however, this implies that a fraction of order unity of all sight-lines passing within several Mpc of this cluster would intersect a cloud of hydrogen with a neutral column density of or greater.
In this section we hypothesise that the region surrounding the 21424420 cluster is optically thick in neutral hydrogen clouds. We further hypothesise that this cluster is typical of clusters at this redshift. What would be the physical consequences if our hypotheses were correct?
3.1 Gas Geometry
The absorption-line gas in cluster 21424420 seems to be substantially more extended spatially than the Ly emitting galaxies, as can be seen in Fig 1. Strong absorption is seen in QSO 21384427, whose sight-line passes Mpc from the concentration of Ly emitting galaxies. It is also seen in QSO 21394433, at a redshift that places the absorption about 2 Mpc in front of the cluster. We therefore hypothesise that the cluster of Ly sources is embedded within a much larger structure of absorbing gas. Indeed, it is suggestive that the QSO sight-line passing closest to the three Ly emitting galaxies shows the lowest neutral hydrogen column density. This might indicate that the central region of the neutral gas structure is hotter and more ionised than the outer regions.
If this neutral gas structure does exist, what is its geometry? With only the QSO absorption to guide us, all we can do is bracket the possibilities with three straw models:
-
1.
Sheet Model: the gas lies in a sheet, of thickness Mpc, width Mpc and depth (along the line of sight) Mpc. This sheet would be edge-on to our sight-line.
-
2.
Spherical model: The gas lies in a spherical halo, centred on the Ly emitting galaxies. The halo radius must be at least 4 Mpc.
-
3.
Filamentary Model: the cluster of galaxies lie at the intersection of a number of gas-filled filaments. Each filament is at least 4 Mpc long, and perhaps around 1 Mpc thick. Filamentary distributions are predicted by many cosmological simulations (eg. Rauch, Haehnelt & Steinmetz 1997).
Is the region around the galaxy cluster completely full of absorbing gas? Let us assume that a fraction of all randomly chosen site-lines passing within proper Mpc of the galaxy cluster would intercept at least one gas cloud with a total hydrogen cross section . The probability of all three of our QSO sight-lines showing such absorption is thus . If we require this probability to be greater than 1%, that implies %.
3.2 The Mass and Density of the Neutral Gas Structure
Let us assume that the cluster really is surrounded by a proper Mpc scale structure of gas with and a typical neutral absorption-line column density of . What would be the consequences? The average density of absorption-line gas within the gas structure will then be in proper coordinates. This is times greater than the typical density of neutral hydrogen at this redshift (eg. Steidel 1990).
Given this density, the combined gas mass of all the absorption-line systems within the neutral gas structure would be for the sheet or filamentary models, and for the spherical model.
This overdensity of baryonic matter in the form of hydrogen clouds could be explained in two ways:
-
1.
The volume surrounding the galaxy cluster is overdense in all forms of matter: the efficiency with which baryons form absorbing gas clouds and red galaxies is the same as elsewhere in the universe.
-
2.
The volume is not greatly overdense, but the efficiency with which baryons formed neutral gas clouds and red galaxies is enhanced in this region.
Cosmological simulations favour the second explanation. At redshift 2.38, there has not been sufficient time to assemble large matter concentrations. Many authors have used analytic methods or n-body simulations to estimate the mass of matter concentrations in the high redshift universe. In Table 3, we have collected a sample of these results, parameterised as the two-point correlation coefficients for mass on the approximate scale of the gas structure, at redshifts .
| Ref. | Model Details | Co-moving Radius | z | |
|---|---|---|---|---|
| 1 | SCDM: , , (small ) | Mpc | 2.3 | 0.06 |
| 1 | SCDM: , , (large ) | Mpc | 2.3 | 0.17 |
| 2 | , | 11.4 Mpc | 2.8 | 0.008 |
| 2 | , | 11.4 Mpc | 2.8 | 0.095 |
| 2 | , | 11.4 Mpc | 2.8 | 0.07 |
| 3 | , | Mpc | 2.0 | 0.020 |
| 3 | , | Mpc | 3.0 | 0.016 |
| 4 | SCDM (with Zel’dovich Approximation) | Mpc | 2.0 | 0.05 |
| 5 | SCDM: , , (small ) | Mpc | 2.4 | 0.0036 |
| 5 | SCDM: , , (large ) | Mpc | 2.4 | 0.03 |
| 5 | TCDM: , , (small ) | Mpc | 2.4 | 0.0014 |
| 5 | TCDM: , , (small ) | Mpc | 2.4 | 0.0069 |
| 5 | OCDM: , , | Mpc | 2.4 | 0.016 |
| 5 | CDM: , , | Mpc | 2 | 0.0036 |
| 6 | SCDM: | Mpc | 2.4 | 0.02 |
| 7 | LCDM: | Mpc | 3 | |
| 7 | C+HDM: | Mpc | 3 |
Brainerd & Villumsen (1994).
Cólin, Carlberg & Couchman (1997).
Matarrese et al. (1997).
Porciani (1997).
Moscardini et al. (1998).
Bagla (1998).
Ma (1999).
Given these values of , we can estimate the root-mean squared (rms) fluctuations between the average densities of various spherical regions of this size in the early universe. We use the approximate relationship
| (1) |
which is obtained from the relation where a top hat window function has been assumed and represents the integrated two point correlation function (Kolb & Turner 1990). Thus
| (2) |
where the two point correlation function is assumed to be of the form , with (Groth & Peebles 1977, Davis & Peebles 1983).
Thus typical predicted rms mass fluctuations on the scale of this absorption-line structure ( co-moving Mpc) are only . Even for models with the most extreme fluctuations (low density models: Cen 1998), and assuming that the cluster sits in a mass fluctuation, the average density on this scale cannot be more than twice the mean density of the universe. Note that this applies to a roughly spherical volume: if the structure really is sheet-like or filamentary, the overdensity within this structure can be significantly greater.
So, the average mass density of the co-moving Mpc scale volume including the cluster must be of the same order as that of the universe as a whole at this redshift. If, as seems likely, baryonic and non-baryonic matter trace each other on these large scales, primordial nucleosynthesis thus gives us an approximate upper limit on the average baryon density of the cluster halo. Assuming (eg. Walker et al. 1991), and choosing , this density is ().
Thus even if the QSO absorption-line column densities are representative of the whole cluster halo, the baryonic mass of the cluster inferred (0.6—3 in the form of absorbing clouds) is physically possible: it does not exceed the predicted baryonic mass within the cluster volume (). The puzzle would be the high fraction of these baryons that are incorporated into absorption-line systems: the efficiency of formation of these objects is at least 10% and may well be much higher. This efficiency is far higher than is typical at this or any other redshift (eg. Cen & Ostriker 1999)
3.3 The Physical State of the Gas
If the QSO sight-lines are representative of all sight-lines through the region around the cluster, it seems to be embedded in a structure of size Mpc, and most sight-lines through this structure intersect a gas cloud with a hydrogen column density . Is there any physically plausible structure with these properties?
3.3.1 Argument from the Total Baryon Density
In this section, it is shown that the neutral gas structure is probably in the form of many small dense gas clouds, and a crude upper limit is placed on the size of these clouds. In summary, the argument is this: any given Mpc region of the early universe must have a baryon density that is close to the average for the whole universe, as discussed in Section 3.2. If these baryons were spread uniformly throughout the region, they would be highly ionised by the UV background radiation and no absorption would be seen. The baryons must therefore be confined into dense clouds, occupying a small fraction of the total region. The density must be high enough that the recombination rate balances the photoionisation by UV background photons. The region could contain a small number of large dense clouds, or a large number of small dense clouds. Only in the latter case, however, would most QSO sight-lines through the region intercept one of these clouds (smaller clouds having a greater ratio of surface area to volume). We now consider this argument in detail.
As discussed in Section 3.2, the density of gas within the Mpc scale volume surrounding the galaxy cluster can at most be comparable to . If these baryons were spread uniformly throughout this volume, and exposed to the average UV background at this redshift, they would be highly ionised. Why then do the QSO sight-lines show such large neutral column? The mean free path of UV photons at this redshift is Mpc (eg. Haardt & Madau 1996): this is far greater than the average separation of UV sources, implying that the UV background intensity is spatially very uniform (Zuo 1992a,b, Fardal & Shull 1993). In this case, we know that at least five QSOs lie within 500 Mpc of the cluster, so if their emission is isotropic, lack of a UV background cannot explain the neutrality of the gas.
Let us therefore consider a model of the neutral gas structure which contains at most this average density of baryons. This mass, instead of being distributed uniformly, is confined into clouds of scale-length and density . If the clouds are sufficiently large and dense, the gas within them will become neutral.
For any given density, a gas cloud must have a certain minimum size for the hydrogen within it to be neutral. This size was estimated analytically, using standard equilibrium photoionisation, and by using the MAPPINGS II photoionisation code (Sutherland & Dopita 1993). If a UV background with a plausible spectrum and intensity is assumed (the details make little difference to the final result), then the UV background ionises a layer of thickness on the gas surface. The recombination rate within this surface layer, which is proportional to its density squared, must balance the photoionisation rate: inserting numbers, we find that
| (3) |
where . Unless a cloud is thicker than this, its neutral column density will be low (eg. Lanzetta 1991).
This gives one constraint on the size of the absorbing clouds. A second constraint comes from our assumption that the three QSO sight-lines are representative of the region around the galaxy cluster. This assumption requires that a fraction (of order unity) of all lines of sight passing close to the cluster intersect a cloud. To keep the discussion more general, let us allow for the possibility of sheet-like clouds of thickness and face-on cross-sectional area , where , so that most of the incident UV flux enters through their face. If there are clouds per unit volume throughout the region surrounding the galaxy cluster, and the region has a typical thickness , then this condition implies that
| (4) |
We can also constrain , and by requiring that the total density be at most comparable to , the average baryon density of the universe at this redshift. These constraints can only be met if is small: solving, we find that cancels, leaving us with the limits
| (5) |
and
| (6) |
If the absorption is caused by approximately spherical clouds (ie. ) these clouds could have masses of or less, and a space density of . If they are flattened, they could be more massive and rarer.
3.4 Argument from Metal-line Ratios
Most high column density QSO absorption-line systems, when observed with sufficiently high spectral resolution, break down into multiple components with different ionisation states (eg. Prochaska & Wolfe 1997). The wavelength shifts between different metal-line species seen in our data suggest that the same is true for our Lyman-limit systems.
Our spectra are not of sufficient resolution to resolve this substructure, so we are forced to use single-cloud modelling. Nonetheless, useful constraints can be put on the cloud size. We used the MAPPINGS II photoionisation code, as before, to estimate absorption column densities as a function of cloud density and metallicity.
No useful constraints could be placed on the metallicity of the gas, other than noting that it contains metals. The presence of strong high ionisation lines, particularly C IV and Si III, however, implies that a large part of the cloud mass cannot be at densities significantly higher than . The Si III measurement could be contaminated by Ly forest lines, but C IV should be reliable.
Given this maximum density, the UV background ionises a layer kpc deep into the cloud surface. This places a lower limit on the scale-length of the absorbing clouds, if the high- and low-ionisation lines come from the same clouds. This limit is only marginally consistent with the upper limit on cloud size placed in Section 3.3.1.
Alternatively, the absorption-line systems could be a mixture of these low density clouds, and much smaller, higher density neutral clouds that contribute most of the low ionisation and Ly absorption.
3.5 Argument from the Velocity Dispersions
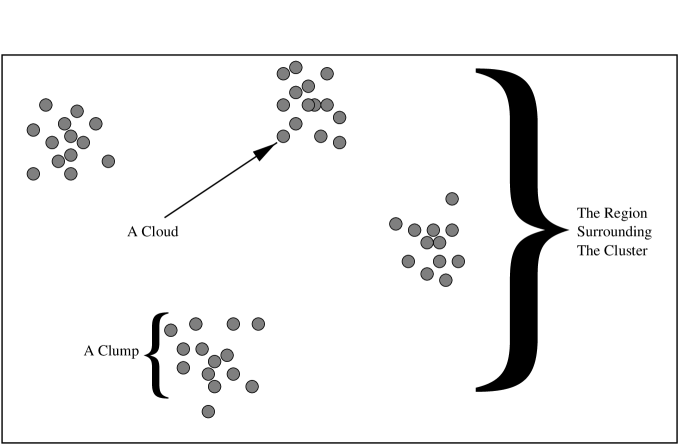
Are the hypothesised absorbing clouds spread uniformly throughout the region around the galaxy cluster, or are they gathered into clumps (Fig 4)? The velocity structure of the absorption-lines suggests that the latter is true. The absorption (Figure 2) consists of a number of discrete components: the velocity width of each component () is much smaller than the velocity dispersion between the different components ().
Each of the individual Ly absorption components can only be well fit if the absorbing gas has a velocity dispersion of (if a velocity dispersion of is used in the fits, the column density has to be very large to match the width of the base of the absorption component, in which case the predicted damping wings are much larger than observed). The velocity dispersions of each component, while smaller than those of the cluster as a whole, are thus greater than the probable thermal velocity widths of the clouds themselves ( for a hot photoionised phase).
Why are the individual absorption components so broad? As discussed in Section 3.4, each component is probably made up of many small absorbing clouds. If these small clouds are not gravitationally bound, the velocity dispersions could be Hubble-flow redshift differences between the clouds at the front and back of the clump: that would imply clump sizes of . If, however, they are gravitationally bound, we can use the virial theorem to constrain the mass of each clump, and hence put a lower limit on the size of each clump by requiring that the total mass of all the clumps in the cluster not exceed a cosmologically plausible amount.
Assume that each clump has size and mass . Given the observed velocity dispersions , the total mass of each clump can be estimated from the virial theorem, and is proportional to the clump size:
| (7) |
As in Section 3.3.1, we can constrain the size and space density of these clumps by requiring that most sight-lines through the cluster must intersect a clump: ie. that . Thus
| (8) |
In addition, the total mass of all the clumps within a given volume, , can at most be comparable to the critical density of the universe , as discussed in Section 3.2. Thus the total mass in all the clouds must be inversely proportional to the typical cloud size . Solving, we find that
| (9) |
If the clumps were smaller, each would be less massive, but so many would be needed to intersect most QSO sight-lines that the total mass of all the clumps would be physically implausible.
Thus each absorption component probably consists of many small absorbing clouds gathered into clumps of size kpc.
3.6 Discussion
So, if we assume that most sight-lines passing close to the 21424420 cluster intersect a cloud with , and that this cluster is typical of high redshift clusters, these clusters must be embedded in co-moving Mpc structures of neutral gas, made up of large numbers of small dense gas clouds, gathered into clumps.
If these clumps exist, what could they be? Each clump could be the halo or extended disk of a galaxy (eg. Prochaska & Wolfe 1997): if they are kpc in size, the virial mass of each halo would be , and the whole cluster halo would have to contain a few hundred of these galaxy halos. Alternatively, the velocity dispersions could represent infall into the potential wells of protogalaxies (eg. Rauch, Haehnelt & Steinmetz 1997). The properties we infer for the absorbing gas within the cluster are strikingly similar to the theoretical predictions of lumpy gas infalling along filaments into protogalaxies (eg. Mo & Miralda-Escudé 1996).
If the halo model is correct, we should see galaxies associated with the absorption systems. For the Lyman-limit absorber in the spectrum of QSO 21394434, we do see a galaxy that could plausibly be surrounded by a halo that is causing the absorption: one of the strong Ly sources lies at the same redshift as the absorber, 20′′ ( projected kpc) from the QSO sight-line. For the damped systems in QSO 21394433 and QSO 21384427, however, no galaxies are seen within 500 projected kpc of the sight-lines. This is not however conclusive, as any galaxies could easily lack Ly emission signatures, or lie below our flux limits.
When observed at high angular resolution, many radio galaxies are seen to be surrounded by numerous kpc-sized knots of emission, sometimes made visible by reprocessing nuclear emission (eg. Stockton, Canalizo & Ridgway 1999, Pascarelle et al. 1996). These knots may be the same compact gas clouds we are hypothesising, based on the absorption.
Could all damped Ly systems be caused by absorption in galaxy protoclusters? The space density of Lyman-break galaxy concentrations (Steidel et al. 1998) is comparable to that of damped Ly systems, so if all these concentrations are optically thick throughout in Ly, then most damped Ly systems could indeed arise in proto-clusters. Note, however, that our lower limit on the size of these clumps of small absorbing clouds is greater than the tentative upper limit placed on the size of two damped Ly systems by Møller & Warren (1998) and Fynbo, Møller & Warren (1999).
What could be the physical origin of the absorbing clouds? Thermal instabilities can produce small cold dense clouds within the halos of high redshift galaxies (eg. Viegas, Friaça & Gruenwald 1999) or in collapsing proto-galaxies (Fall & Rees 1985): it is intriguing that our inferred cloud masses are comparable to those of globular clusters. The sound crossing times of these small clouds would be small, so if they are long-lived objects, they would need to be confined in some way.
Given that all sight-lines though a clump intersect multiple absorbing clouds, then mean time between cloud-cloud collisions would be less than the time it takes for clouds to cross the clump: ie. 100kpc/ years (cf. McDonald & Miralda-Escudé 1999); further evidence for the transient nature of these clouds. What happens to the gas in the clouds during a collision? The collision time-scale is years: if all the gas were converted into stars, this would imply a star formation rate of , which is slightly below the detection threshold of most current surveys for high redshift star forming galaxies. Over the neutral gas structure as a whole, however, the integrated effect of all the cloud-cloud collisions, if they all form stars, is a star-formation rate of , which should produce a diffuse H flux of (Kennicutt 1983) over the entirety of the cluster, and in the absence of self-absorption, a comparable flux of diffuse Ly emission. We address the detection of such faint Ly fluxes in Section 4.
4 Diffuse Ly Emission
How can we observationally determine whether neutral gas structures like the ones hypothesised in Section 3 exist? One approach would be to find larger samples of high redshift galaxy clusters with background QSOs, but this would be enormously expensive in telescope time. Another approach is to search for diffuse Ly emission from the hypothesised neutral gas.
Even in the absence of photoionisation from young stars and/or AGN, the strong UV background in the high redshift universe should photoionise the outer layers of any neutral gas clouds in the early universe, and hence induce Ly emission. This emission has been modelled by Binette et al. (1993) and by Gould & Weinberg (1996) (see also Hogan & Weymann 1987). Predicted Ly surface brightnesses are very low: typically or less. Nonetheless, if the emission covers a large area on the sky, the sensitivity can be increased by , where is the area integrated over. This approach has been applied to emission from individual Lyman limit systems, and stringent upper limits placed on the surface brightness (Bunker, Marleau & Graham 1998).
We used results from these papers, together with our own modelling using MAPPINGS II, to predict the diffuse Ly flux from the hypothesised neutral gas structure around the 21424420 cluster. The biggest sources of uncertainty are the strength of the UV ionising background at this redshift (literature values disagree by a factor of ), the spectrum of the UV background, and the geometry of the structure (which can also introduce a factor of uncertainty into the predicted diffuse flux). All predictions ignore dust obscuration: if any dust is present, then the Ly fluxes will probably be reduced by a large factor. We predicted that the diffuse flux per unit area should lie in the range .
4.1 Observations
We have made two attempts to detect diffuse Ly emission from the hypothesised neutral gas structure surrounding the 21424420 cluster.
The first attempt used the Double Beam Spectrograph on the Siding Spring 2.3m telescope. A long-slit spectrum was taken, with the slit centred on QSO 21394434, and the slit angle positioned so that it included QSO 21394433. The slit was 2′′ wide and 3′ long, giving a total sky coverage of 360 square arcsec. Spectral resolution (2 pixels) was 1.1Å. 1800 second exposures of the cluster field were alternated with equal length exposures on randomly chosen control fields one degree away (in random directions).
A total on-field exposure time of 23,400 seconds was obtained, in dark photometric conditions, on the nights of 9th and 10th July 1999. The total control field exposure was identical. The night sky spectrum was found to be very stable throughout both nights, so on- and off-field exposures were combined, using inverse variance weighting to minimise sky noise. The night sky brightness at around 4110Å (the expected wavelength of Ly at the cluster redshift) was .
No significant excess flux was seen at wavelengths of around 411 nm in the on-field image as compared to the off-field image. This enables us to place a upper limit on the diffuse emission from the cluster halo, if it fills the slit, of .
The second attempted measurement was made with the Taurus Tunable Filter (TTF), on the Anglo-Australian Telescope. TTF is an imaging Fabry-Perot etalon system, with a resolution at 4100Å of down to 4Å, and a monochromatic field of view approximately 5′ in diameter. All observations were taken in photometric conditions on the nights of 11th and 12th August 1999.
Charge shuffling was used to alternate, every 60 seconds, between images of the cluster field at the expected wavelength of Ly, and at a control wavelength 50 Å to the red. Observations were made at 4Å resolution, with central wavelengths of 4110 Å and 4114 Å. On-wavelength exposure times were 3000 and 3600 seconds respectively. The field of view was centred on the brightest of the Ly emitting galaxies: at 21:42:27.4844:20:28.4 (J2000).
The difference images (on-wavelength minus off-wavelength) were very clean, with all continuum sources removed to high precision. These images were aligned and co-added, using inverse variance weighting. As no control fields were observed, we have no sensitivity to diffuse flux filling the field of view. We are sensitive to variations in the diffuse flux on smaller angular scales. On scales of , we see no regions of excess flux, to a upper limit of , at both wavelengths.
4.2 Summary
We failed to detect diffuse emission from any neutral gas around the 21424420 cluster. Our observations were not, however, deep enough to rule out the presence of even dust-free neutral gas. They do, however, demonstrate the darkness and stability of the sky background at these blue wavelengths.
5 Conclusions
The QSO absorption-line data on the 21424420 cluster are provocative. If taken at face value, they suggest that this high redshift cluster, and perhaps all of them, are surrounded by Mpc structures of neutral hydrogen, of total mass . This gas would be gathered into a series of kpc clumps, each of which is made up of hundreds of small ( pc), dense () clouds. These clouds may merge to form cluster galaxies, collapse to form globular clusters, or perhaps dissolve into X-ray intra-cluster medium by redshift zero.
Many more observations of neutral gas around high redshift clusters will be needed to verify this picture.
Acknowledgements
We wish to thank Phillippe Véron and Mike Hawkins for making their spectrum of QSO 21394433 available to us, Ralph Sutherland for his help and advice with the photoionisation modelling, Mark Phillips for taking the CTIO spectrum for us, Catherine Drake and Joss Bland-Hawthorn for their help with the TTF observations and Luc Binette, Gerry Williger and Povilas Palunas for helpful discussions.
References
Adelberger, K.L., Steidel, C.C., Giavalisco, M., Dickinson, M., Pettini, M. & Kellogg, M. 1998, ApJ, 505, 18
Bagla, J.S. 1998, MNRAS, 299, 417
Baugh, C.M., Benson, A.J., Cole, S., Frenk, C.S. & Lacey, C.G. 1999, MNRAS, 305, L21
Bicknell, G.V., Sutherland, R.S., van Breughel, W.J.M., Dopita, M.A., Dey, A. & Miley, G.K. 2000, ApJ, submitted.
Binette, L., Wang, J.C.L., Zuo, L., & Magris, C.G. 1993, AJ, 105, 797
Binette, L., Kurk, J.D., Villar-Martin, M. & Röttgering, H.J.A. 2000, A & A, submitted.
Brainerd, T. G., & Villumsen, J. S. 1994, ApJ, 431, 477
Bunker, A.J., Marleau, F.R., & Graham, J.R. 1998, ApJ, 116, 2086
Campos, A., Yahil, A., Windhorst, R. A., Richards, E. A., Pascarelle, S., Impey, C. & Petry, C., 1999, ApJL , 511, L1
Carilli, C.L., Harris, D.E., Pentericci, L., Röttgering, H.J.A., Miley, G.K. & Bremer, M.N. 1998, ApJL, 494, 143
Carilli, C.L., Röttgering, H.J.A., van Ojik, R., Miley, G.K. & van Breughel, W.J.M. 1997, ApJS, 109, 1
Cen, R. 1998, ApJ, 509, 16
Cen, R. & Ostriker, J.P. 1999, ApJ, 514, 1
Cólin, C. P., Carlberg, R. G., & Couchman, H. M. P. 1997, ApJ, 490, 1
Colless, M., Ellis, R. S., Taylor, K. & Hook, R. N. 1990, MNRAS, 244, 408
Davis, M. & Peebles, P.J.E. 1983, ApJ, 267, 465
Djorgovski, S.G., Odewahn, S.C., Gal, R.R., Brunner, R. & Carvalho, R.R. 1999, to appear in “Photometric Redshifts and the Detection of High Redshift Galaxies”, ed. Weymann, R.J., Storrie-Lombardi, L., Sawicki, M. & Brunner, R. (San Francisco: ASP conference Series) (astro-ph/9908142)
Donahue, M. & Voit, G. M. 1999, ApJL, in press (astro-ph/9907333)
Drinkwater, M. J., Barnes, D. G. & Ellison, S. L. 1995, PASA, 12, 248
Deltorn, J.-M, Le Fevre, O., Crampton, D. & Dickinson, M. 1997, ApJ, 483, 21
Fall, S. M. & Rees, M. J. 1985, ApJ, 298, 18
Fardal, M.A. & Shull, J.M. 1993, ApJ, 415, 524
Francis, P. J., & Hewett, P. C. 1993, AJ , 105, 1633
Francis, P. J., et al. 1996, ApJ, 457, 490
Francis, P. J., Woodgate, B. E. & Danks, A. C., 1997, ApJL, 482, 25
Fry, J. N. 1996, ApJ, 461, 65
Fynbo, J. U., Møller, P. & Warren, S. J. 1999, MNRAS, 305, 849
Giavalisco, M., Steidel, C.C., Adelberger, K.L., Dickinson, M.E., Pettini, M. & Kellogg, M. 1998, ApJ, 503, 543
Gould, A., & Weinberg, D.H.1996, ApJ, 468, 462
Groth, J.E. & Peebles, P.J.E. 1977, ApJ, 217, 385
Haardt, F. & Madau, P. 1996, ApJ, 461, 20
Heisler, J., Hogan, C. J., & White, S. D. M. 1989, ApJ, 347, 52
Hogan, C.J., & Weymann, R.J. 1987, MNRAS, 225, 1P
Hu, E.M., Cowie, L. L., & McMahon, R. G. 1998, ApJL, 502, L99
Ivison, R.J., Dunlop, J.S., Smail, I., Dey, A., Liu, M.C. & Graham, J.R. 2000, ApJ in press (astro-ph/0005234)
Jenkins, A., Frenk, C.S., Pearce, F.R., Thomas, P.A., Colberg, J.M., White, S.D.M., Couchman, H.M.P., Peacock, J.A., Efstathiou, G. & Nelson, A.H. 1998, ApJ, 499, 20
Kennicutt, R.C., jr. 1983, ApJ, 272, 54
Kolb, E. M., & Turner, M. S., 1990, “The Early Universe”, (Addison-Wesley, New York), 335
Lanzetta, K.M. 1991, ApJ, 375, 1
Ma, C-P. 1999, ApJ, 510 32
Malkan, M. A., Teplitz, H. & McLean, I.S. 1996, ApJL, 468, L9
Mar, D. P. & Bailey, G. 1995, PASA, 12 239
Martínez-González, E., González-Serrano, J. I., Cayón, L., Sanz, J. L., & Martín-Mirones, J. M. 1995, A & A, 303, 379
Matarrese, S., Coles, P., Lucchin, F. & Moscardini, L. 1997, MNRAS, 286, 115
McDonald, P. & Miralda-Escudé, J. 1999, ApJ, 519, 486
Mo, H.J. & Miralda-Escudé, J. 1996, ApJ, 471, 582
Møller, P. & Warren, S.J. 1998, MNRAS, 299, 661
Moscardini, L., Coles, P., Lucchin, F., Matarese, S. 1998, MNRAS, 299, 95
Pascarelle, S.M., Windhorst, R.A., Keel, W.C. & Odewahn, S.C. 1996, Nature, 383, 45
Pascarelle, S.M., Windhorst, R.A. & Keel, W.C. 1998, AJ, 116, 2659
Pentericci, L., Röttgering, H.J.A., Miley, G.K., Carilli, C.L. & McCarthy, P. 1997, A & A, 326, 580
Pentericci, Van Reeven, L.W., Carilli, C.L., Röttgering, H.J.A., & Miley, G.K. 2000, A & A, in press (astro-ph/0005524)
Porciani, C. 1997, MNRAS, 290, 639
Prochaska, J. X. & Wolfe, A. M. 1997, ApJ, 487, 73
Quashnock, J. M., Vanden Berk, D. E., & York, D. G. 1996, ApJL, 472, L69
Rauch, M., Haehnelt, M. G. & Steinmetz, M. 1997, ApJ, 481, 601
Renzini, A. 1997, ApJ, 488, 35
Rosati, P., Della Ceca, R., Norman, C. & Giacconi, R. 1998, ApJL, 492, L21
Steidel, C. C. 1990, ApJS, 74, 37
Steidel, C.C., Adelberger, K.L., Shapley, A.E., Pettini, M., Dickinson, M. & Giavalisco, M. 2000, ApJ 532, 170
Steidel, C. C., Giavalisco, M., Pettini, M., Dickinson, M. & Adelberger, K. L. 1996, ApJL, 462, L17
Steidel, C. C., Adelberger, K. L., Dickinson, M., Giavalisco, M., Pettini, M., & Kellogg, M. 1998, ApJ, 492, 428
Stockton, A., Canalizo, G. & Ridgway, S.E. 1999, ApJL, 519, 131
Sutherland, R. S. & Dopita, M. A. 1993, ApJS, 88, 253
Tegmark, M. & Peebles, P.J.E. 1998, ApJL, 500, L79
Véron, P. & Hawkins, M. R. S. 1995, A & A, 296, 665
Viegas, S. M., Friaça, A.C.S. & Gruenwald, R. 1999, MNRAS, 309, 355
Walker, T. P., Steigman, G., Kang, H-S., Schramm, D. M. & Olive, K. A. 1991, ApJ, 376, 51
Zuo, L. 1992a, MNRAS, 258, 36
Zuo, L. 1992b, MNRAS, 258, 45