Constraints on the Inner Mass Profiles of Lensing Galaxies from Missing Odd Images
Abstract
Most gravitational lens systems consist of two or four observable images. The absence of detectable odd images allows us to place a lower limit on the power-law slope of the inner mass profile of lensing galaxies. Using a sample of six two-image radio-loud lens systems and assuming a singular power-law surface density () for the inner several kpc of the mass distribution, we find that there is less than a 10% probability that the data are consistent with profile slopes . Furthermore, individual mass modeling yields for B0739+366 and for B1030+074. Modeling central black holes as additional point masses changes the constraints in these systems to and , respectively. The inner mass profiles of lensing galaxies are therefore not much shallower than isothermal.
1 Introduction
Many properties of a galaxy can be learned from its mass profile. Measurements of galaxies’ mass profiles at outer radii have provided some of the most compelling evidence for the existence of dark matter (e.g. Rubin, Thonnard & Ford 1980). The inner mass distributions also carry a wealth of information, and can be readily investigated by strong lensing. For a typical lens redshift of and reasonable cosmological parameters, arcsecond-scale lens systems probe the galaxy mass profile out to a kpc. Lensing has already taught us much about the inner several kpc of elliptical galaxy lenses by essentially ruling out constant mass-to-light ratio models, based on poor fits to individual lens systems (Kochanek 1995; Grogin & Narayan 1996; Romanowsky & Kochanek 1999) and an inability to reproduce observed image separations (Maoz & Rix 1993). Power-law mass profiles with surface mass density , and the isothermal case () in particular, provide improved models of lensing mass distributions while remaining statistically consistent. Mass modeling has thus far yielded direct constraints on the power-law profile in only a few systems: QSO 0957+561 (; Grogin & Narayan 1996), MG1131+0456 (; Chen et al. 1995), B1608+656 (; Koopmans & Fassnacht 1999), MG1654+1346 (; Kochanek 1995), and B1933+503 (; Cohn et al. 2000). Unfortunately, most two-image lenses do not provide a sufficient number of constraints to allow for a detailed investigation of the galaxy mass profile.
This Letter investigates a method for placing a lower bound on the inner slope of the mass profiles of lensing galaxies in two-image systems. Our technique takes advantage of the lensing property that as the profile is made shallower (relative to isothermal), a faint image close to the center of the lens becomes more prominent (Narasimha et al. 1986; Blandford & Kochanek 1987). This image is absent in virtually all known lens systems, with the possible exceptions of MG1131+0456 (Chen & Hewitt 1993), in which the central component may be emission from the lensing galaxy itself, and APM08279+5255 (Ibata et al. 1999), which may be a special class of imaging due to an edge-on disk (Keeton & Kochanek 1998). The paucity of detectable third images therefore allows us to constrain the steepness of the lens mass profile. To achieve this goal we use two complementary approaches. First, we compute the frequencies at which detectable three-image systems are produced as a function of the power-law index and axis ratio of the mass distribution (§ 2). We then derive a limit on the characteristic slope of the inner mass profile by performing a statistical analysis on a sample of six radio-loud two-image lens systems (§ 3). Second, we use mass modeling to directly constrain the galaxy mass profiles for two individual lens systems (§ 4): B0739+366 (Marlow et al. 2001) and B1030+074 (Xanthopoulos et al. 1998). The effect of central black holes is also explored.
2 Frequency of Detectable Triple Systems
The inner mass profile of lensing galaxies is approximated as a singular power-law ellipsoid (SPLE; e.g. Barkana 1998), with a scaled projected surface mass density where is the characteristic angular scale, is the radial profile and is the axial ratio. For the isothermal case, . The SPLE likely oversimplifies the overall mass distribution in galaxies but is a reasonable model for the inner several kpc that are probed by strong lensing. We can gain some analytical insight from the spherical case (). For the model has critical curves at (radial) and (tangential) on which the image magnification diverges, and a radial caustic at inside of which sources are triply-imaged. The third central image resides within the radial critical curve. If this curve does not exist, so the central image is trapped in the galaxy core and completely demagnified. The ratio of the radial to tangential critical curves is , which increases as the slope is decreased from isothermal. A larger radial critical curve means that the third image can form farther from the lens center, so it tends to be less demagnified by the high central convergence. Consequently, additional images of this type are more likely to be observed for shallow mass profiles.
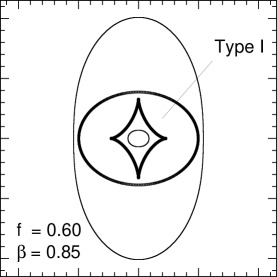
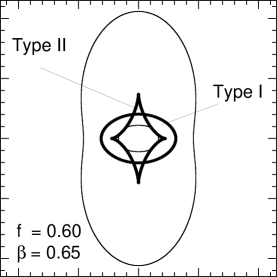
Elliptical profiles with also efficiently produce a second class of three-image lens system: the naked cusp configuration (e.g. Kormann, Schneider & Bartelmann 1994). These can form when the tangential caustic extends outside the radial caustic. Sources placed within the exposed tangential caustic form three bright images on the same side of the lens, and at similar distances from the lens center. The tangential caustic is determined almost exclusively by the ellipticity of the potential (Blandford & Kochanek 1987), changing little as the profile is modified. The radial caustic, however, shrinks by (for the spherical case) when the power-law index is decreased from to . As a result, the tangential caustic is more easily exposed for shallower mass profiles and naked cusp systems grow in prominence, as demonstrated in Fig. 1. We refer to these naked cusp systems as “Type II” and all other three-image systems as “Type I.” Near-isothermal models with reasonable axial ratios () produce predominately Type I systems.
In this analysis we focus on the three-image systems produced by lenses with the SPLE mass density.111The additional fifth image for quads tends to be significantly more demagnified than the corresponding third image for doubles (Wallington & Narayan 1993). Therefore the absence of a fifth image in quads leads to much poorer constraints on the mass profile. To make use of the information provided by unobserved odd images, one must first determine the frequency at which observable three-image systems are produced by power-law deflectors. To this end, we have performed Monte Carlo simulations in which sources are placed randomly in the Type I and Type II caustic regions of the SPLE for various combinations of () and . In each trial the lens equation is numerically inverted to solve for all image positions and magnifications. Our calculations make use of the rapidly converging series solutions for the deflection angles and magnification matrices of power-law mass distributions derived by Barkana (1998) and implemented in the “FASTELL” software package.
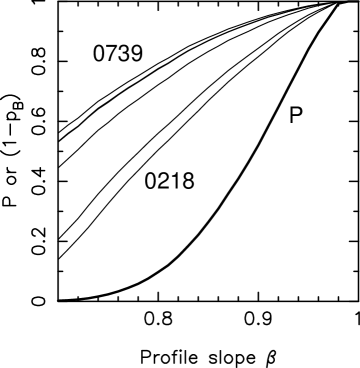
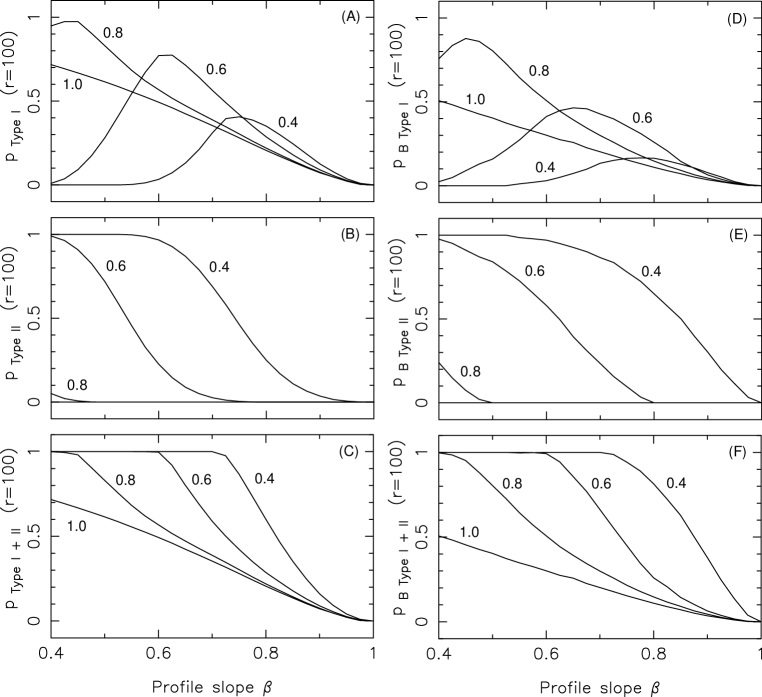
We illustrate in Fig. 2a–2c the unbiased fraction of three-image systems with , as a function of and . The dependence on of the curves in Fig. 2 can be understood as follows. For , the radial critical curve degenerates to a point and the third image is infinitely demagnified, so , and the fraction of Type I configurations () is zero. As the profile is made more shallow, the radial critical curve grows in size, the third image inside the radial critical curve becomes brighter, and increases initially as decreases from 1 (Fig. 2a). As is decreased further, however, Fig. 2a shows that the Type I fraction begins to decline beyond a cutoff that depends on the axial ratio . For below this cutoff, Type II systems begin to dominate (Fig. 1 and Fig. 2b), and a large fraction of three-image systems should appear as three relatively bright images on the same side of the lens, which has never been observed. A profile much shallower than isothermal is therefore highly disfavored (Fig. 2c).
3 Statistical Constraints on Mass Profiles from Radio Data
Radio-loud gravitational lens systems are ideal targets with which to search for faint odd images. Such systems can be investigated with high dynamic range maps that are not contaminated by galaxy emission which could mask the presence of faint additional images near the lens center. The most extensive radio lens search is the combined Jodrell-VLA Astrometric Survey (JVAS; Patnaik et al. 1992; Browne et al. 1998; Wilkinson et al. 1998; King et al. 1999) and Cosmic Lens All-Sky Survey (CLASS; e.g. Myers et al. 1999). Lens candidates are selected from snapshot imaging with the Very Large Array (VLA) and undergo deep follow-up observations using the Multi-Element Radio-Linked Interferometer Network (MERLIN) and the Very Long Baseline Array (VLBA), each of which offers excellent sensitivity (rms Jy/beam). The compact nature of the JVAS/CLASS lensed sources should allow the detection of very faint additional images. Since typical CLASS lens systems have a primary component with mJy at 5 GHz, a conservative 5 rms limit should ensure the detection of any faint third image such that the magnification ratio is . A number of radio lens systems are significantly brighter than mJy, and in such cases demagnified central components would be more readily detectable.
The combined JVAS/CLASS lens survey currently contains seven two-image gravitational lens systems. We remove B1127+385 (Koopmans et al. 1999) due to its compound deflector, and take the remaining six lenses as our sample. Each of the systems has been investigated with deep MERLIN and VLBA observations, and no additional images have been found down to the 5 rms detection limit of the maps. For each lens system, Table 1 lists the flux density of the brightest image in the most sensitive map and the corresponding constraint on the magnification ratio ( 5 rms).
The raw frequencies at which detectable three-image lens systems with are produced by the SPLE can be calculated, as demonstrated in Fig. 2a–2c. However, these frequencies ignore magnification bias (e.g. Maoz & Rix 1993), through which lens systems with high total magnifications preferentially appear in flux-limited samples such as JVAS/CLASS. Highly magnified doubles tend to form when the source is well aligned with the lens (e.g. Blandford & Kochanek 1987), a situation that also keeps the third image close to the lens center where it can be strongly demagnified. Therefore magnification bias may dilute the probability that lens systems in the JVAS/CLASS sample will have detectable central images. We account for this as follows. For a source population described by the differential number-flux relation , the biased lensing cross-section for creating a system with is given by an integral over the area enclosed by the caustics: where and = 1 if (0 otherwise). The biased fraction of systems with is then simply . These fractions are plotted for the SPLE as a function of and in Fig. 2d–2f for , assuming for the JVAS/CLASS radio source sample (Rusin & Tegmark 2001). As expected, magnification bias decreases the frequency of Type I systems, but not overwhelmingly; e.g. for and , compared to . On the other hand, Type II systems become more prominent due to their high magnifications (Fig. 2e).
The probability that a lens system will have no third image down to the detection limit is , where . To constrain the typical inner profile slope of lensing galaxies, we evaluate the probability of the data given the model. We assume a moderate mass axial ratio of , which is consistent with the published models of each lens system in the sample to . The resulting probability is plotted in Fig. 3 as a function of . Note that for because no Type I systems are formed. As is decreased from isothermal the probability falls rapidly, so small values of are strongly ruled out. For example, if and if . We take the former as our statistical lower limit on the profile slope: .
4 Mass Modeling of Two Lens Systems
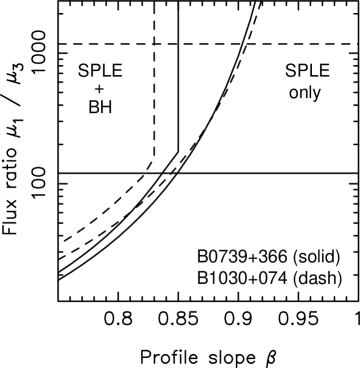
We now expand on our statistical result by directly constraining the profiles of specific galaxies. For simplicity we consider only two-image systems lensed by an isolated elliptical galaxy whose centroid has been well determined, i.e., B0739+366 (Marlow et al. 2001) and B1030+074 (Xanthopoulos et al. 1998). Modeling of these systems is performed with data available in the literature. The position of the lens galaxy is fixed according to the optical imaging. In each trial we set the power-law index to a test value and optimize the remaining five free model parameters: the galaxy normalization, axial ratio, position angle, and the source coordinates. Since the radio data provide five constraints (two sets of image coordinates and a flux density ratio), the best-fit model can reproduce the image properties exactly. At the end of each trial the recovered source position is numerically inverted to solve for all images. The magnification of the third (unseen) image relative to the brightest image is then compared to current detection limits, as listed in Table 1. The predicted ratios as a function of mass profile are plotted in Fig. 4. The lack of detectable third images implies that for B0739+366 and for B1030+074.
There is significant evidence that black holes exist at the centers of elliptical galaxies. Mao, Witt & Koopmans (2001) demonstrate that if lensing galaxies are modeled as an isothermal ellipsoid with a finite core radius, the addition of a central black hole can steepen the inner profile and suppress the magnification of the third image. In our analysis, we have instead used a singular ellipsoid with an arbitrary power-law index to approximate the inner mass distribution from all forms of matter. The above constraints are therefore on the total contributions from baryons, dark matter, and perhaps black holes. However, to quantify the separate contribution from potential black holes, we also model these two lenses by adding a central point mass to the SPLE according to the empirical relation between black hole mass and velocity dispersion (Merritt & Ferrarese 2001), which combines the measurements of Ferrarese & Merritt (2000) and Gebhardt et al. (2000). To obtain the black hole mass we use the isothermal velocity dispersion required to produce the observed image separation (which should be a good approximation so long as we are investigating mass profiles close to isothermal), and find for B0739+366 and for B1030+074. We assume a flat universe with . The resulting magnification ratio curves for each lens are plotted in Fig. 4. We find that when central black holes are modeled separately as point masses, the constraints become for B0739+366 and for B1030+074, a less than 10% change from the pure SPLE case. Using the shallower relation from Gebhardt et al. (2000) we find nearly identical results: for B0739+366 and for B1030+074. Note that the weaker profile constraints in models with a black hole are largely due to the complete demagnification of the central image for steeper profiles (Fig. 4), an effect similar to that described in Mao et al. (2001).
5 Discussion
Using the detection limits for faint third images in six radio-loud doubly-lensed systems from JVAS/CLASS, and assuming an SPLE surface mass density (), we have obtained a lower bound on the typical power-law index for the inner mass profiles of lensing galaxies, which are predominately large ellipticals. For the probability of the data is , so we take to be the statistical lower limit on the characteristic profile slope. We have also used mass modeling and the lack of a detectable third image to constrain the profiles of two lensing galaxies that have well determined centroids. We find for B0739+366 and for B1030+074 when a singular ellipsoid is used to approximate the lensing galaxy. If the lensing galaxy is assumed to harbor a central black hole which is modeled separately as a point mass, we find only slightly different bounds of for B0739+366 and for B1030+074. These results argue that the total mass in the form of baryons, dark matter, and perhaps black holes at the inner parts of lensing galaxies follows a profile that is not much shallower than isothermal.
Limits on the profile slope could be improved by increasing the number of lens systems in the analysis, and in the future we may expand our sample to include new lenses discovered in the PMN survey (e.g. Winn et al. 2000). Little improvement, however, is expected by obtaining deeper maps of existing lenses. Our Monte Carlo simulations demonstrate that detectable three-image systems with small are much more common than those with large . As a result, deeper observations quickly lead to diminishing returns for the statistical profile constraints. In addition, near-isothermal profiles () produce extremely faint third images that would be difficult to detect with any instrument.
In conclusion, the lack of detectable odd images rules out a large region of shallow profiles for the inner several kpc of galaxy mass distributions, and therefore provides corroborating evidence for the popular isothermal model favored by stellar dynamics (Rix et al. 1997), studies of elliptical galaxies with X-ray halos (Fabbiano 1989), and previous constraints from gravitational lensing. We stress that our result applies only to the total profile, as lensing cannot distinguish between the luminous and dark mass constituents. It is interesting to compare our constraints with the light profiles of local ellipticals observed using the Hubble Space Telescope (Lauer et al. 1995). The latter tend to be quite shallow () at small radii and fall off sharply (with ) beyond a break radius of pc (Byun et al. 1996), which would be only a few tens of milliarcseconds at a typical lens redshift of . It should therefore be noted that what is considered the inner region of a few arcseconds for strong lensing corresponds to the outer, steeper part of the Byun et al. profile. If the dark matter profiles indeed follow as reported in various numerical simulations (e.g. Navarro, Frenk & White 1997; Moore et al. 1999), our results then indicate that the shallower dark matter profiles conspire with the steeper optical profiles to produce a near-isothermal mass distribution in the inner few kpc of lensing galaxies.
References
- (1)
- (2) Barkana, R. 1998, ApJ, 502, 531
- (3)
- (4) Biggs, A.D., Browne, I.W.A., Helbig, P., Koopmans, L.V.E., Wilkinson, P.N., & Perley, R.A. 1999, MNRAS, 304, 349
- (5)
- (6) Blandford, R.D., & Kochanek, C.S. 1987, ApJ, 321, 658
- (7)
- (8) Browne, I.W.A., Wilkinson, P.N., Patnaik, A.R., & Wrobel, J.M. 1998, MNRAS, 293, 257
- (9)
- (10) Byun Y.-I., et al. 1996, AJ, 111, 1889
- (11)
- (12) Chen, G.H., & Hewitt, J.N. 1993, AJ, 106, 1719
- (13)
- (14) Chen, G.H., Kochanek, C.S, & Hewitt, J.N. 1995, ApJ, 447, 62
- (15)
- (16) Cohn, J.D., Kochanek, C.S., McLeod, B.A., & Keeton, C.R. 2000, ApJ, submitted (astro-ph/0008390)
- (17)
- (18) Fabbiano, G. 1989, AR&A, 27, 87
- (19)
- (20) Ferrarese, L., & Merritt, D. 2000, ApJ, 539L, 9
- (21)
- (22) Gebhardt, K., et al. 2000, ApJ, 539L, 13
- (23)
- (24) Grogin, N.A., & Narayan, R. 1996, ApJ, 464, 92
- (25)
- (26) Ibata, R.A., Lewis, G.F., Irwin, M.J., Lehar, J., & Totten, E.J., 1999, AJ, 118, 1922
- (27)
- (28) Keeton, C.R., & Kochanek, C.S. 1998, ApJ, 495, 157
- (29)
- (30) King, L.J., Browne, I.W.A., Marlow, D.R., Patnaik, A.R., & Wilkinson, P.N. 1999, MNRAS, 307, 225
- (31)
- (32) Kochanek, C.S. 1995, ApJ, 445, 559
- (33)
- (34) Koopmans, L.V.E., de Bruyn, A.G., & Jackson, N.J. 1998, MNRAS, 295, 534
- (35)
- (36) Koopmans, L.V.E., et al. 1999, MNRAS, 303, 727
- (37)
- (38) Koopmans, L.V.E., & Fassnacht, C.D. 1999, 527, 513
- (39)
- (40) Kormann, R., Schneider, P., & Bartelmann, M. 1994, A&A, 284, 285
- (41)
- (42) Lauer, T.R., et al. 1995, AJ, 110, 2622
- (43)
- (44) Mao, S., Witt, H.J., & Koopmans, L.V.E. 2001, MNRAS, in press (astro-ph/0007011)
- (45)
- (46) Maoz, D., & Rix, H.-W. 1993, ApJ, 416, 425
- (47)
- (48) Marlow, D.R., et al. 2001, AJ, 121, 619
- (49)
- (50) Merritt, D., & Ferrarese, L. 2001, ApJ, 547, 140
- (51)
- (52) Moore, B., Quinn, T., Governato, F., Stadel, J., & Lake, G. 1999, MNRAS, 310, 1147
- (53)
- (54) Myers, S.T., et al. 1999, AJ, 117, 2565
- (55)
- (56) Narasimha, D., Subramanian, K., & Chitre, S.M. 1986, Nature, 321, 45
- (57)
- (58) Navarro, J.F., Frenk, C.S., & White, S.D.M. 1997, ApJ, 490, 493
- (59)
- (60) Norbury, M.A., Rusin, D., Jackson, N., & Browne, I.W.A. 2001, MNRAS, submitted
- (61)
- (62) Patnaik, A.R., Browne, I.W.A., Wilkinson, P.N., & Wrobel, J.M. 1992, MNRAS, 254, 655
- (63)
- (64) Rix, H.-W., de Zeeuw, P.T., Cretton, N., van der Marel, R.P., & Carollo, C.M. 1997, ApJ, 488, 702
- (65)
- (66) Romanowsky, A.J., & Kochanek, C.S. 1999, ApJ, 516, 18
- (67)
- (68) Rubin, V.C., Thonnard, N., & Ford, W.K. 1980, ApJ, 238, 471
- (69)
- (70) Rusin, D., et al. 2001, AJ, submitted
- (71)
- (72) Rusin, D., & Tegmark, M. 2001, ApJ, in press (astro-ph/0008329)
- (73)
- (74) Wallington, S., & Narayan, R. 1993, ApJ, 403, 517
- (75)
- (76) Wilkinson, P.N., Browne, I.W.A., Patnaik, A.R., Wrobel, J.M., & Sorathia, B. 1998, MNRAS, 300, 790
- (77)
- (78) Winn, J.N., et al. 2000, AJ, 120, 2868
- (79)
- (80) Xanthopoulos, E., et al. 1998, MNRAS, 300, 649
- (81)
| Lens | Instrument | (mJy) | rms (Jy/beam) | Reference | |
|---|---|---|---|---|---|
| B0218+357 | MERLIN 5 GHz | 842 | 82 | 2054 | Biggs et al. 1999 |
| B0739+366 | MERLIN 5 GHz | 27 | 45 | 120 | Marlow et al. 2001 |
| B1030+074 | MERLIN 5 GHz | 364 | 61 | 1193 | Xanthopoulos et al. 1998 |
| B1152+199 | MERLIN 5 GHz | 53 | 72 | 147 | Myers et al. 1999 |
| B1600+434 | MERLIN 5 GHz | 44 | 61 | 144 | Koopmans, de Bruyn & Jackson 1998 |
| B2319+051 | VLBA 1.7 GHz | 67 | 54 | 248 | Rusin et al. 2001 |
 |
 |
 |