Star Formation in Galaxies between
Abstract
We present an analysis of the star formation rate in galaxies between using Near Infrared Camera and Multi-Object Spectrograph (NICMOS) grism spectral observations. We detect 163 galaxies in an area of square arcminutes, 37 of which show possible H emission. We extend the observed H luminosity function (LF) in this redshift range to luminosities a factor of two fainter than earlier work, and are consistent in the region of overlap. Using the H LF, we estimate a star formation rate (SFR) density in this redshift range of 0.166 M⊙yr-1Mpc-3 (km s-1Mpc-1), consistent with other estimates based on emission lines, and supporting the order of magnitude increase in SFR density between and . Our measurement of SFR density is a factor of greater than that estimated from UV data, comparable to the factor observed locally, implying little evolution in the relative extinctions between UV and H out to .
1 Introduction
Recent calculations based on measurements of the ultra-violet (UV) continuum (280 nm, Lilly et al., 1995; Connolly et al., 1997), [Oii] line emission (Hogg et al., 1998), and H line emission (Glazebrook et al., 1999; Yan et al., 1999), have shown that the comoving star formation rate (SFR) density in galaxies increases rapidly as a function of redshift, rising by an order of magnitude from to . Measurements of the UV luminosity of high redshift () galaxies by Steidel et al. (1999) and Madau et al. (1996), even after correction for extinction due to dust obscuration (Steidel et al., 1999), suggest a flattening or a decrease in this trend. Consequently, the redshift range appears to host a change in the slope of the global SFR density, and has become the focus of several recent studies (Yan et al., 1999; Connolly et al., 1997).
We have undertaken a study of the global SFR within this redshift range using the H line emission as a probe of star formation, detected in observations with the Near Infrared Camera and Multi-Object Spectrograph (NICMOS) on the Hubble Space Telescope (HST). Our target regions were chosen to lie within the Groth-Westphal strip (Groth et al., 1994). This allows us to exploit existing deep multicolour photometry and ongoing complementary ground-based spectroscopy in the analysis of the detected galaxies. The observations and data processing are described in the next section, with the resulting catalogue and measured SFR density presented in Section 3.
Throughout this paper we assume km s-1Mpc-1 and .
2 Observations and Data Processing
Field selection was based on photometric redshift estimates for sources in the Groth-Westphal strip. To ensure detection of the emission line population, the target fields were chosen to maximise the number of galaxies with photometric redshifts .
Six such fields lying within the Groth-Westphal strip were observed with camera 3 on NICMOS using the F160W broadband filter and the G141 grism. The grism covers the wavelength range 1.1 to 1.9 m with a mean dispersion of m pixel-1. More details of the grism properties are given in McCarthy et al. (1999).
The observations for each of the six fields consisted of 10 separate exposures with both the grism and broadband filter. The total exposure time with the F160W filter was s, and with the G141 grism was s for each field. The size of the direct images is 256256 pixels with pixel-1, so the six fields cover a total area of square arcminutes. For all but one of the fields the instrument was rotated by a few degrees after the first 6 pairs of exposures. This was done in an attempt to regain information on sources whose spectra might be heavily blended at the initial position angle.
The data processing performed closely follows the steps outlined by McCarthy et al. (1999). The starting point was the calibrated output from the STScI data processing pipeline, which consists of dark current removal, linearisation, bad pixel masking and cosmic-ray rejection. Subsequent processing began with subtraction of a median sky frame. The median sky was constructed by combining the calibrated exposures for all the observations, producing a high signal-to-noise (S/N) sky frame. This median was scaled before subtraction from the grism images to minimise the rms noise in each frame. The individual sky-subtracted frames for each field were then combined using a median filter after being shifted into registration using offsets derived from the associated direct images. The observations at different position angles for each field were processed independently, resulting in two direct and grism images (at different position angles) for five of the six fields.
The NICMOS-Look software (Freudling & Pirzkal, 1998) was used for the extraction of one-dimensional spectra from the grism images. The location and sizes for the objects in each frame were established using SExtractor (Bertin & Arnouts, 1996). The resulting source lists were input to NICMOS-Look for spectral extraction. This procedure identifies extraction regions in the grism images for each object based on previously calibrated transformations from the object positions in the associated direct images. The extracted spectra were wavelength and flux calibrated based on existing calibration data incorporated into NICMOS-Look. For some objects where the spectrum was mildly contaminated by that of a nearby object, the “deblend” option of NICMOS-Look was successfully applied. For situations with strong blending, however, the spectra were not able to be reliably extracted (more details of the “deblend” algorithm are given in Freudling, 1999). In the latter cases unblended spectra were often available in the grism image taken at the other position angle. In some few cases, the spectra of objects in more crowded regions were heavily blended at both position angles, and no reliable spectra for these were obtained. For these reasons, spectra for corresponding objects in the pairs of rotated images were not combined. Instead the spectra were analysed separately. In most cases the parameters for detected emission lines were measured using the spectrum extracted from the image at the orientation with the higher S/N.
While the spectral range of the grism is 1.1 to m, we found that in many spectra, at wavelengths longer than m, spurious features or artifacts prevented confident emission line detections. As a result we have restricted our analysis to , this upper limit corresponding to H emission at m. The resulting calibrated spectra show noise levels between Jy (rms) over the wavelength range m. For a emission feature of average equivalent width (Å, estimated from observed emission lines), this translates to W m-2, W, and SFRM⊙yr-1 at , or W m-2, W, and SFRM⊙yr-1 at .
3 Results
| Name | NoteccConfidence level of possible H emission. 1: low confidence; 2: mid-confidence; 3: high confidence. For galaxies with ground-based spectroscopic redshifts this estimator is omitted. | Eq. Width | SFR | |||
|---|---|---|---|---|---|---|
| (J2000 coordinates) | ( W m-2) | (Å) | ( W) | (M⊙yr-1) | ||
| NIC J141725.37+522721.0 | 1 | 0.65 | 179 | 1.31 | 2.20 | 1.7 |
| NIC J141725.66+522652.3 | 3 | 2.37 | 244 | 1.70 | 14.4 | 11.3 |
| NIC J141725.66+522724.7 | 1 | 0.83 | 66 | 1.07 | 1.79 | 1.4 |
| NIC J141725.71+522652.9 | 3 | 3.49 | 257 | 1.71 | 21.4 | 16.8 |
| NIC J141726.75+522449.0aaThese objects have ground based optical spectra confirming the redshift (the DEEP consortium, private communication). | 2.14 | 68 | 0.83 | 2.61 | 2.1 | |
| NIC J141727.28+522637.4aaThese objects have ground based optical spectra confirming the redshift (the DEEP consortium, private communication). | 3.43 | 223 | 1.00 | 6.36 | 5.0 | |
| NIC J141727.34+522647.0aaThese objects have ground based optical spectra confirming the redshift (the DEEP consortium, private communication). | 3.51 | 381 | 1.55 | 17.2 | 13.5 | |
| NIC J141727.42+522644.5aaThese objects have ground based optical spectra confirming the redshift (the DEEP consortium, private communication). | 2.50 | 198 | 0.91 | 3.79 | 3.0 | |
| NIC J141727.46+522445.0 | 2 | 1.27 | 253 | 0.99 | 2.32 | 1.8 |
| NIC J141729.60+522446.4aaThese objects have ground based optical spectra confirming the redshift (the DEEP consortium, private communication). | 2.46 | 367 | 0.97 | 4.28 | 3.4 | |
| NIC J141740.30+522645.0aaThese objects have ground based optical spectra confirming the redshift (the DEEP consortium, private communication). | 1.17 | 162 | 1.04 | 2.37 | 1.9 | |
| NIC J141740.65+522648.8 | 3 | 1.69 | 125 | 0.92 | 2.60 | 2.0 |
| NIC J141740.71+522659.8aaThese objects have ground based optical spectra confirming the redshift (the DEEP consortium, private communication). | 1.70 | 69 | 0.75 | 1.68 | 1.3 | |
| NIC J141741.93+522645.2aaThese objects have ground based optical spectra confirming the redshift (the DEEP consortium, private communication). | 2.96 | 168 | 0.75 | 2.97 | 2.3 | |
| NIC J141750.32+523054.3 | 3 | 3.54 | 333 | 1.12 | 8.42 | 6.6 |
| NIC J141750.88+523043.7 | 2 | 1.66 | 271 | 0.95 | 2.75 | 2.2 |
| NIC J141751.06+523040.0 | 3 | 2.55 | 201 | 1.55 | 12.6 | 9.9 |
| NIC J141751.10+523023.6 | 2 | 1.43 | 152 | 1.22 | 4.15 | 3.3 |
| NIC J141751.15+523049.3 | 1 | 2.28 | 344 | 1.00 | 4.24 | 3.3 |
| NIC J141751.99+523052.3aaThese objects have ground based optical spectra confirming the redshift (the DEEP consortium, private communication). | 1.10 | 61 | 1.00 | 2.06 | 1.6 | |
| NIC J141752.29+523008.3aaThese objects have ground based optical spectra confirming the redshift (the DEEP consortium, private communication). | 1.65 | 280 | 1.10 | 3.79 | 3.0 | |
| NIC J141753.47+522922.2aaThese objects have ground based optical spectra confirming the redshift (the DEEP consortium, private communication). | 4.13 | 451 | 1.00 | 7.76 | 6.1 | |
| NIC J141753.77+523033.3aaThese objects have ground based optical spectra confirming the redshift (the DEEP consortium, private communication). | 3.61 | 298 | 1.00 | 6.80 | 5.4 | |
| NIC J141754.00+522923.9aaThese objects have ground based optical spectra confirming the redshift (the DEEP consortium, private communication). | 1.27 | 164 | 0.99 | 2.33 | 1.8 | |
| NIC J141754.17+522907.3aaThese objects have ground based optical spectra confirming the redshift (the DEEP consortium, private communication). | 0.97 | 161 | 0.99 | 1.77 | 1.4 | |
| NIC J141754.23+523042.6aaThese objects have ground based optical spectra confirming the redshift (the DEEP consortium, private communication). | 2.58 | 199 | 0.81 | 2.98 | 2.3 | |
| NIC J141754.29+523023.0 | 2 | 1.65 | 301 | 1.43 | 6.79 | 5.3 |
| NIC J141754.30+522916.3 | 2 | 1.06 | 217 | 1.53 | 5.05 | 4.0 |
| NIC J141754.35+523036.5bbThis object has a ground based photometric redshift consistent with this emission line being H. | 2 | 0.89 | 209 | 1.24 | 2.66 | 2.1 |
| NIC J141754.54+523015.1aaThese objects have ground based optical spectra confirming the redshift (the DEEP consortium, private communication). | 2.52 | 401 | 1.63 | 13.9 | 10.9 | |
| NIC J141754.55+522904.2 | 2 | 0.58 | 180 | 0.93 | 0.935 | 0.74 |
| NIC J141754.57+522930.6aaThese objects have ground based optical spectra confirming the redshift (the DEEP consortium, private communication). | 0.82 | 249 | 1.00 | 1.52 | 1.2 | |
| NIC J141755.24+522928.2 | 2 | 1.53 | 253 | 1.34 | 5.47 | 4.3 |
| NIC J141757.52+522922.5 | 1 | 2.89 | 278 | 0.92 | 4.49 | 3.5 |
| NIC J141757.94+522926.8 | 2 | 1.11 | 249 | 1.25 | 3.42 | 2.7 |
| NIC J141759.68+523023.4 | 1 | 0.42 | 183 | 1.55 | 2.06 | 1.6 |
| NIC J141800.61+523011.4 | 2 | 0.93 | 188 | 1.27 | 2.93 | 2.3 |
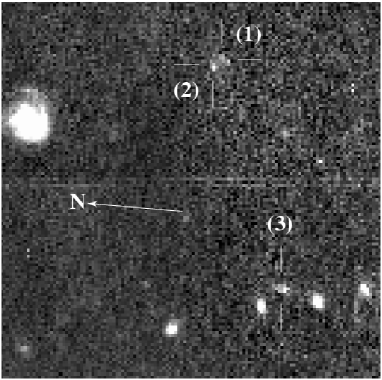
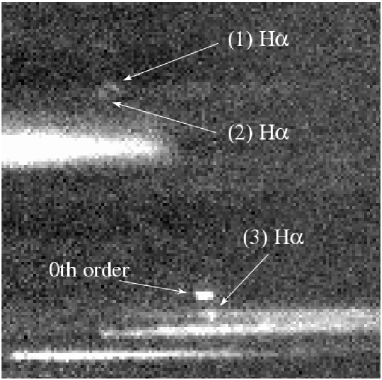
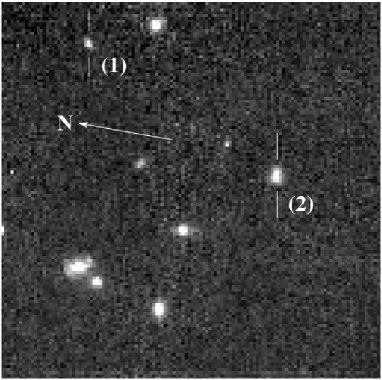
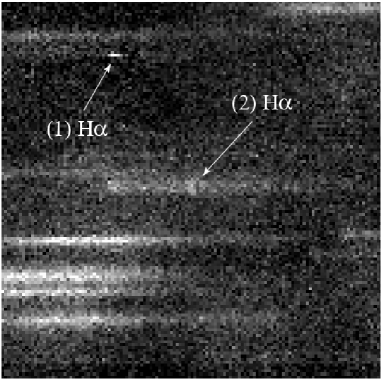
A total of 163 galaxies were detected in the 6 fields observed. Our direct imaging observations are complete to mAB(H) . although galaxies as faint as mAB(H) are detected. Two examples of the NICMOS direct and grism images showing emission line galaxies are presented in Figures 1 and 2. Of the catalogued sources, 37 show spectral features which are possibly H emission. The iraf task splot was used to determine the emission line parameters. The resulting line fluxes, equivalent widths, and redshifts are shown in Table 1, along with a confidence parameter, from 1 (low confidence) to 3 (high confidence), assigned subjectively as an indicator of our confidence in the reality of the emission.
The H flux, , is calculated assuming that H contributes 0.71 of the blended H/[Nii] line (McCarthy et al., 1999). Also shown in Table 1 are the derived H luminosities and estimated star formation rates (assuming that there is no AGN contribution to the emission). The SFRs are calculated using the calibration SFRM⊙yr(W) taken from Kennicutt (1998).
Of the 37 candidate H emission line galaxies, the grism redshifts for 17 objects (46%) are supported by independent ground-based optical spectroscopy from the DEEP consortium, confirming that the emission line detected in the grism observations is indeed H. For a subset of these 17 objects, further confirmation is provided by CFRS spectroscopy (Lilly et al., 1995; Brinchmann et al., 1998) for 5 objects, and for 2 more by Koo et al. (1996).
The discrepancy between the apparent surface densities of H candidates detected here (37 sources in square arcminutes) and in the survey by Yan et al. (1999) (33 sources in square arcminutes) is notable but misleading, and is briefly discussed here. The primary cause of the discrepancy comes from the widely varying sensitivities between the different fields observed in the latter survey (McCarthy et al., 1999; Yan et al., 1999), which comprises a large number of less sensitive fields, and fewer deeper fields. The effect of these heterogeneous detection levels is to produce a sample biased even more towards brighter objects than had the observations been homogeneously flux density limited. A prediction for the number of sources expected by integrating the luminosity function (LF) derived by Yan et al. (1999) emphasises this result. The number of H sources expected in the current survey predicted from this LF is slightly greater than the number we detect, after correcting our areal coverage to account for the fact that the grism is only sensitive to the full range of wavelengths over a portion of its area (Yan et al., 1999). This result is not unexpected, as there will be some incompleteness in our detections at the low luminosity end (since we are not sensitive to the faintest luminosity sources over the full redshift range sampled). We emphasise that our detection rate for H candidates is consistent with the LF estimated by Yan et al. (1999).
3.1 Luminosity functions and density of star formation
The H luminosity function (LF) has been calculated using the method, with as given by Yan et al. (1999, their Equation 1), having a minimum as well as a maximum redshift being defined by the NICMOS G141 grism spectral window. This has been done for two cases, using (1) only galaxies with spectroscopic redshifts or confident, high S/N detections; and (2) all galaxies with possible H emission; effectively providing lower and upper limits, respectively, to the observed density. The resulting LFs are shown in Figure 3. The error bars are the square roots of the variances (the sum of the squares of the inverse volumes) for each point on the LF. Schechter function parameters (given in Table 2) were estimated from a minimum fit, using our H LF data for each of the above two cases, combined in each case with the data of Yan et al. (1999). The uncertainties in our estimated parameters were obtained using a Monte-Carlo method, based on fitting Schechter functions to a large number of simulated H LFs. The simulated LFs were constructed with errors having a Gaussian distribution based on the uncertainties of our measured LF points. The quoted uncertainties in Table 2 are the values of Gaussian fits to the resulting distributions of each of the Schechter function parameters independently (c.f. Gallego et al., 1995). It is well known, however, that these parameters are not independent (e.g. Gallego et al., 1996), and this can be seen in Figure 4, which shows the “error-areas” for pairs of Schechter parameters from the Monte-Carlo analysis in the second of our two cases.
In comparison to our results, the Schechter function parameters for the H LF of the local Universe measured by Gallego et al. (1995) (converted to km s-1Mpc-1) are Mpc-3, W, and . While the evolution of the H luminosity function from these values is clearly demonstrated in Figure 3, the Schechter parameters from our fitting appear rather extreme. In particular, we derive low normalisations, bright values and steep faint end slopes, which are strongly at variance with earlier estimates for emission line LFs around . This is due to the fact that we are examining two cases comprising a lower and upper limit to the LF. The resulting Schechter functions should not be taken to reflect the true shape of the LF, although their integrals, being more robust (Gallego et al., 1996), provide valid limits on our estimate of the total H luminosity density.
The total SFR density has been calculated from the integral of the H luminosity functions, and is shown compared with emission line and UV-continuum derived estimates from the literature in Figures 5 and 6. The values in Figure 5 show the UV based points uncorrected for extinction. Figure 6 applies the extinction corrections used in Steidel et al. (1999), derived from the Calzetti (1997a, b) reddening law, to the UV based estimates. This raises these points to values consistent with the emission line derived values, and emphasizes the importance of extinction corrections. However, Steidel et al. (1999) caution against reading too much into the high-redshift end of the latter figure (c.f. their Figure 9) due to both the uncertainty in the faint end of the UV luminosity function at high redshifts, and the uncertainty in the dust extinction at all redshifts.
3.2 Individual galaxies
Some comments on selected galaxies follow. The naming convention for sources follows IAU recommendations, and uses J2000 coordinates.
NIC J141725.66+522652.3: A feature at m may be H at . The NICMOS direct image of this object (see Figure 1) appears to show two components. It is possible that this is a close pair of galaxies, or a single disturbed system. In addition, this galaxy is only separated by from NIC J141725.71+522652.9 and may be interacting with that galaxy as well.
NIC J141725.66+522724.7: This galaxy, identified with CFRS 14.1537 (Lilly et al., 1995), has a very low S/N feature at m which may be H at . No ground-based spectroscopic redshift is available.
NIC J141725.71+522652.9: A feature at m may be H at . This galaxy may be interacting with NIC J141725.66+522652.3. It is possible that the observed H emission may be related to any interaction, and estimated star formation rates in both galaxies are high (assuming no AGN component to the source of ionising radiation). See Figure 1.
NIC J141726.75+522449.0: This galaxy is identified with object 1044024 from Koo et al. (1996). A very low S/N feature at m may be H at . The ground-based spectroscopic redshift of 0.8116 (Koo et al., 1996) is given a “probable” confidence, and the discrepancy, which is of the order of the grism spectrum resolution, may be explained by very low S/N of the emission feature in the grism spectrum. The morphology of this galaxy is given as “O” by Koo et al. (1996), classifying it as “round or elliptical, centrally concentrated, smooth, and largely symmetrical,” consistent with the morphology seen in the NICMOS direct image.
NIC J141727.28+522637.4: This galaxy is also catalogued as CFRS 14.1501 (Brinchmann et al., 1998). A feature at m may be H at . This is consistent with the CFRS confidence class 2 redshift of (for the CFRS redshift confidence definitions, see Le Fèvre et al., 1995). Brinchmann et al. (1998) class the morphology for this galaxy as Irregular.
NIC J141727.34+522647.0: A redshift of 1.54 for this galaxy, calculated assuming the strong emission feature at m is H, is confirmed by a ground-based optical spectrum (the DEEP consortium, private communication). This galaxy is visible in a WFPC2 image of CFRS 14.1496 presented by Glazebrook et al. (1999, their Figure 7, the object directly beneath CFRS 14.1496). The WFPC2 image shows that this object appears to consist of two components. Given the proximity of the components and the presence of H in emission, it is probable that this is a pair of interacting galaxies, with the observed H emission possibly a product of interaction-induced star formation (Kennicutt, 1998, for example). See Figure 1.
NIC J141727.42+522644.5: This galaxy is also catalogued as CFRS 14.1496 (Lilly et al., 1995; Brinchmann et al., 1998). The grism spectrum for this object at both observed orientations is heavily blended with the spectra of nearby objects, but a low S/N feature is visible at m, which, if H, gives and is consistent with the CFRS confidence class 3 value of . This object was also observed by Glazebrook et al. (1999), who did not detect any H emission and estimated an upper limit of W, which is consistent with our measurement of W.
NIC J141740.65+522648.8: A feature at m may be H at . This galaxy is about from 15V20, a radio source detected in a deep 5 GHz survey (Fomalont et al., 1991). The positional offset is just larger than the the quoted 5 GHz positional errors, and it is possible the objects are associated. The 5 GHz flux density of 15V20 is Jy.
NIC J141741.93+522645.2: Also catalogued as CFRS 14.1146 (Lilly et al., 1995; Brinchmann et al., 1998), this galaxy has a feature at m which may be H at . This is consistent with the ground-based redshift of (CFRS confidence class 3). Brinchmann et al. (1998) give the morphology of the galaxy as either a merger (visual classification) or an Sbc (automated classifier).
NIC J141750.32+523054.3: This galaxy has a strong () feature at m which may be H at . It is shown in Figure 2.
NIC J141751.06+523040.0: A feature at m may be H at . It is shown in Figure 2.
NIC J141751.99+523052.3: Also catalogued as CFRS 14.0846, this galaxy shows a weak () feature at m which may be H at . A ground-based optical spectrum (Lilly et al., 1995; Brinchmann et al., 1998) of this object gives a CFRS confidence class 2 redshift of 0.989, which would put H at m, consistent within the grism spectrum resolution. Brinchmann et al. (1998) estimate the morphology for this galaxy as Irregular.
NIC J141752.29+523008.3: This galaxy is identified with object 0632542 from Koo et al. (1996). A feature at m may be H at , consistent within the grism resolution of the ground-based spectroscopic redshift of 1.0927. The morphology of this galaxy is given as “*” by Koo et al. (1996), classifying it as “a galaxy likely to have on-going star formation with late-type, irregular, asymmetrical, multicomponent, or peculiar forms.”
NIC J141753.47+522922.2: This galaxy has also been catalogued as CFRS 14.0807 (Lilly et al., 1995; Brinchmann et al., 1998). Its spectrum shows a broad but weak () feature at m which may be H at . This is supported by a ground-based optical spectrum (Brinchmann et al., 1998) of this object giving a CFRS confidence class 2 redshift of 0.985, which would put H at m. The discrepancy, still of the order of the grism spectrum resolution, may be explained by combination of the low S/N of the emission feature in the grism spectrum and its broadness. Brinchmann et al. (1998) estimate the morphology for this galaxy as either Sab (visual) or Sbc (automated).
NIC J141754.00+522923.9: A weak () feature at m may be H at . This is supported by a ground-based optical redshift for this object (the DEEP consortium, private communication). A disk is visible in the NICMOS direct image of this galaxy, and it may be an early-type spiral. Additionally, it is about from NIC J141753.47+522922.2 at a similar redshift. This corresponds to a separation of kpc. They may be associated, possibly interacting.
NIC J141754.29+523023.0: A weak () feature at m may be H at . If so, an additional feature of similar S/N at m would be [Oiii]nm emission.
NIC J141754.35+523036.5: This galaxy has a photometric redshift of from ground based photometry, consistent with the location of the possible H emission.
NIC J141754.57+522930.6: A broad, weak emission feature () at m may be a blend of H, [Nii] and the [Sii]nm doublet. Deblending the feature (using splot) gives a fit to the H-[Nii] component at m, implying . Within the limits of our resolution, this is consistent with a ground-based optical redshift for this object (the DEEP consortium, private communication).
4 Discussion
The conclusions of earlier work showing a strong increase of global star formation rate out to redshifts of are clearly seen in Figures 5 and 6. Our measured value of 0.166 M⊙yr-1Mpc-3 for the star formation density between reinforces this conclusion. It also supports the conclusion that extinction corrections for UV derived estimates of SFR density are significant, and need to be of the magnitude applied by Steidel et al. (1999) to ensure they are consistent with estimates based on emission line measurements.
Our measurement of SFR density between is greater than that estimated from UV based data by about a factor of . This is similar to the factor observed in the local universe and implies that, globally speaking, there has been very little evolution in the relative extinctions between UV and H out to . This in turn implies that extinction laws constructed from observations of local systems should be valid out to redshifts of at least . Obviously individual systems may show quite a wide variety in the amount or type of extinction, however, and in general such global trends should be applied with caution to individual cases.
Figure 5 also emphasises that emission line measures (O[ii] and H) of SFR density are self-consistent, as are the UV-based estimates, but that they are inconsistent with each other. This discrepancy is most likely to be explained by dust extinction. Steidel et al. (1999) has shown that the extinction law of Calzetti (1997a, b) for starburst regions appears to be quite successful in accounting for this discrepancy.
5 Conclusion
We have observed 6 fields lying within the Groth-Westphal strip with the NICMOS G141 grism, covering a total area of square arcminutes. A catalogue of 163 objects has been compiled, 37 of which show emission features likely to be H at redshifts between . The H LF in this range has been extended to luminosities a factor of two fainter than measured by Yan et al. (1999). We find a value for the density of star formation between of 0.166 M⊙yr-1Mpc-3, consistent with earlier H measurements. This supports the conclusions of earlier work that the global star formation rate at is an order of magnitude greater than locally, and that extinction corrections for UV derived estimates of SFR density are significant. Additionally, our measurement of SFR density at is greater than the UV estimate by a similar factor to that found locally. This implies little, if any, cosmic evolution in the relative extinctions between UV and H out to this redshift.
References
- Bertin & Arnouts (1996) Bertin, E., Arnouts, S. 1996, A&AS, 117, 393
- Brinchmann et al. (1998) Brinchmann, J., et al. 1998, ApJ, 499, 112
- Calzetti (1997a) Calzetti, D. 1997a, AJ, 113, 162
- Calzetti (1997b) Calzetti, D. 1997b, in AIP Conf. Proc. 408, The Ultraviolet Universe at Low and High Redshift: Probing the Progress of Galaxy Evolution, ed. W. H. Waller, M. N. Fanelli, J. E. Hollis, A. C. Danks (New York: AIP), 403, (astro-ph/9706121)
- Connolly et al. (1997) Connolly, A. J., Szalay, A. S., Dickinson, M., SubbaRao, M. U., Brunner, R. J. 1997, ApJ, 486, L11
- Fomalont et al. (1991) Fomalont, E. B., Windhorst, R. A., Kristian, J. A., Kellerman, K. I. 1991, AJ, 102, 1258
- Freudling & Pirzkal (1998) Freudling, W., Pirzkal, N. 1998, in ESO Conf. 55, NICMOS and the VLT: A New Era of High Resolution Near Infrared Imaging and Spectroscopy, ed. W. Freudling & R. Hook (Garching: ESO), 47
- Freudling (1999) Freudling, W. 1999, “Calnic C Manual (V3.1)” (http://ecf.hq.eso.org/nicmos/calnicc/manual/)
- Gallego et al. (1995) Gallego, J., Zamorano, J., Aragón-Salamanca, A., Rego, M. 1995, ApJ, 455, L1
- Gallego et al. (1996) Gallego, J., Zamorano, J., Aragón-Salamanca, A., Rego, M. 1996, ApJ, 459, L43
- Glazebrook et al. (1999) Glazebrook, K., Blake, C., Economou, F., Lilly, S., Colless, M. 1999, MNRAS, 306, 843
- Groth et al. (1994) Groth, E. J., Kristian, J. A., Lynds, R., O’Neil, E. J., Balsano, R., Rhodes, J., & the WFPC-1 IDT. 1994, BAAS, 26, 1403
- Hogg et al. (1998) Hogg, D. W., Cohen, J. G., Blandford, R., Pahre, M. A. 1998, ApJ, 504, 622
- Kennicutt (1998) Kennicutt, R. C. Jr. 1998, ARA&A, 36, 189
- Koo et al. (1996) Koo, D. C., et al. 1996, ApJ, 469, 535
- Le Fèvre et al. (1995) Le Fèvre, O., Crampton, D., Lilly, S. J., Hammer, F., Tresse, L. 1995, ApJ, 455, 60
- Lilly et al. (1995) Lilly, S. J., Hammer, F., Le Fèvre, O., Crampton, D. 1995, ApJ, 455, 75
- Lilly et al. (1996) Lilly, S. J., Le Fèvre, Hammer, F., O., Crampton, D. 1996, ApJ, 460, L1
- Madau et al. (1996) Madau, P., Ferguson, H. C., Dickinson, M., Giavalisco, M., Steidel, C. C., Fruchter, A. 1996, MNRAS, 283, 1388
- McCarthy et al. (1999) McCarthy, P. J., et al. 1999, ApJ, 520, 548
- Steidel et al. (1999) Steidel, C. C., Adelberger, K. L., Giavalisco, M., Dickinson, M., Pettini, M. 1999, ApJ, 519, 1
- Tresse & Maddox (1998) Tresse, L., Maddox, S. J. 1998, ApJ, 495, 691
- Treyer et al. (1998) Treyer, M. A., Ellis, R. S., Milliard, B., Donas, J., Bridges, T. J., 1998, MNRAS, 300, 303
- Yan et al. (1999) Yan, L., McCarthy, P. J., Freudling, W., Teplitz, H. I., Malumuth, E. M., Weymann, R. J., Malkan, M. A. 1999, ApJ, 519, L47