Submillimetre sources in rich cluster fields – source counts, redshift estimates, and cooling flow limits
Abstract
Recent submillimetre surveys have revealed a population of dusty, high redshift sources of great cosmological significance for understanding dust-enshrouded star formation in distant galaxies, and for determining the origin of the far-IR background. In this paper, we analyze nine rich cluster fields mapped at 850m and 450m with the SCUBA array on the James Clerk Maxwell telescope. Lensing models of the clusters are developed in order to derive accurate source counts for our sample. VLA maps of the same clusters are used to help constrain the redshift distribution of our SCUBA detections. Implications for high redshift galaxies and for the far-IR background are discussed. We also provide limits on distributed dust produced by cooling flows in these clusters.
keywords:
Infrared: galaxies – Submillimetre – galaxies: formation – galaxies: evolution1 Introduction
The submillimetre waveband has recently become an invaluable tool for investigating the properties of high redshift galaxies. An early result using the Sub-millimetre Common User Bolometer Array (SCUBA – Holland et al. 1999) by Smail, Ivison and Blain (1997) showed that a much larger population of dusty, high redshift galaxies existed than previously thought. The existence of these dusty, sub-mm galaxies at relatively high redshifts have now been confirmed in several surveys (Hughes et al. 1998; Barger et al. 1998, 1999a; Eales et al. 1999; Lilly et al. 1999a; Blain et al. 1999). Such sub-mm sources could be of great cosmological significance – they may comprise a substantial fraction of the Far-Infrared Background (FIRB – Puget et al. 1996, Hauser et al. 1998, Lagache et al. 1999). Additionally, they could be an important source of CMB anisotropy at arcsecond scales (Scott & White 1999), and certainly the dominant source of sky fluctuations at mm, at least out of the galactic plane (Hughes et al. 1998, Borys, Chapman & Scott 1999). Our understanding of the star-formation history of galaxies depends critically on the properties of these sub-mm sources: this population is responsible for a substantial fraction of the total star formation output in the early Universe and holds important information about how galaxies formed and evolved (e.g. Blain & Longair 1993, Guiderdoni et al. 1997, Blain et al. 1998). They appear to be the high redshift counterparts of well-studied nearby ultra-luminous IR galaxies (Sanders & Mirabel 1996), and can be plausibly intrepretted as the formation sites of galactic spheroids through mergers of gaseous disk systems (e.g. Sanders 1999, Lilly et al. 1999a).
Much work has gone into identifying just what types of galaxies make up this sub-mm bright population, and what mechanisms may be responsible for their rest-frame far-IR emission [Smail et al. 1998, Hughes et al. 1998, Ivison et al. 1998b, Lilly et al. 1999b, Frayer et al. 1998, Frayer et al. 1999, Frayer et al. 2000, Chapman et al. 1999, Ivison et al. 2000, Chapman et al. 2000, Bertoldi et al. 2000, Gear et al. 2000]. However, the numbers of sub-mm source detections are still relatively small. In an effort to increase the statistics and broaden the source count baseline, we have undertaken a sub-mm survey including both blank sky (Borys et al. in preparation) and cluster fields. Our cluster sample is complementary to that of Smail, Ivison, and Blain (1997, 1998) who pioneered this approach using SCUBA on the JCMT. These cluster fields benefit from the lensing by the foreground cluster mass at , enhancing sensitivity to the dusty galaxies at higher redshifts.
Our cluster sample consists of nine clusters at redshifts 0.2–0.8, originally selected to search for both distributed cool dust (cooling flows – see Edge et al. 1999) and the Sunyaev-Zel’dovich (SZ) effect (Birkinshaw 1999; Andreani et al. 1999). Although we found no convincing evidence for distributed emission, our SCUBA maps have revealed significant source detections, as expected from the counts from other surveys (e.g. Blain et al. 1999, Barger et al. 1999b). This further demonstrates that sub-mm surveys provide an efficient means of identifying a population of dusty AGN and/or star-forming galaxies, possibly at very high redshifts. In addition, a few weak sources appear coincident with radio-bright central galaxies in the clusters, possibly associated with the strong cooling flows suggested by the x-ray profiles. In this paper, we describe possible sources found in the cluster fields, and present the resulting source counts. Existing VLA maps are used to place limits on the redshift distribution of the sample. We conclude by discussing the implications for high redshift galaxies and the FIRB.
2 Observations
2.1 JCMT data
Nine clusters were observed with the SCUBA instrument on the James Clerk Maxwell Telescope, resulting in 17 significant source detections greater than 3. During 4 observing runs throughout 1998 and 1999, we operated the 91 element Short-wave array at 450m, and the 37 element Long-wave array at 850m simultaneously, in JIGGLE mode, and additionally the single photometry pixel at 1350m for some sources, giving half-power beam widths of 7.5, 14.7, and 21.0 arcsec respectively. Additionally, 850/450m PHOTOMETRY mode followup on 3 of the sources was performed, confirming their existence and flux densities. The central pixel of SCUBA was fixed on the source, as defined by the centroid of the ROSAT imaging (Crawford et al. 1999). For mapping, the standard 64-point jiggle pattern was employed to fully sample the 450 and 850m arrays. The effective integration times (time spent on and off source derived from the number of 64 point integrations obtained, which excludes overheads) are presented in Table 1 for each cluster. For 1350m photometry we used the 9-point jiggle pattern to reduce the impact of pointing errors by averaging the source signal over a slightly larger area than the beam, resulting in greater photometric accuracy. Whilst jiggling, the secondary was chopped at 7.8125 Hz with chop throws between 40 and 120 arcsec in azimuth, with smaller throws used under worse atmospheric conditions or when the projected core radius for a cluster was smaller.
Pointing was checked hourly on blazars and a sky-dip was performed to measure the atmospheric opacity directly. The RMS pointing errors were below 2 arcsec, while the average atmospheric zenith opacities at 450m , 850m and 1350m were fairly stable and generally quite good with ranging from 0.15 to 0.36. Some short time-scale variations, presumably due to the atmosphere, caused some parts of the data-set to be noisier, and these noisiest sections were excluded.
The data were reduced using the Starlink package SURF (Scuba User Reduction Facility, Jenness et al. 1998). Spikes were first carefully rejected from the data, followed by correction for atmospheric opacity and sky subtraction using the median of all the array pixels, except for obviously bad pixels (the 1350m pixel currently has no provision for subtracting sky variations using the other wavelength pixels). We then weighted each pixel by its timestream inverse variance, relative to the central pixel. Multiple scans on the same cluster field, and sky rotation, ensure that (in most cases) each point of the map is covered by many bolometers. Even with the inverse variance weighting, excessively bad pixels still appeared to degrade the map, and were therefore clipped from the data prior to rebinning into the final maps. The data were then calibrated against standard planetary or compact H ii region sources, observed during the same nights as the clusters. Uncertainties at 850m and 1350m are estimated to be around 10 per cent, while at 450m they could be as high as 25 per cent. Note that calibration uncertainties do not affect the S/N level for our detections, only the overall flux densities reported.
2.2 Archive VLA data
VLA maps at 4.9 GHz in the C configuration were obtained for five clusters in our sample courtesy of A. Edge. The effective resolution in the images is 5 arcsec. More details of the reduction and analysis of similar maps are given in Edge et al. (1999a). Typical 1 sensitivities lie around Jy. In addition, an archive 1.4 GHz map for Abell 2219 was obtained courtesy of F. Owen, reaching a 1 limit of Jy per 2 arcsec beam.
For the remaining clusters, VLA data presented in Stocke et al. (1999) at 1.4 GHz in the B configuration, was used to set limits and identify counterpart positions. Typical 1.4 GHz sensitivities in these maps are 65 Jy RMS.
3 Source Catalogue
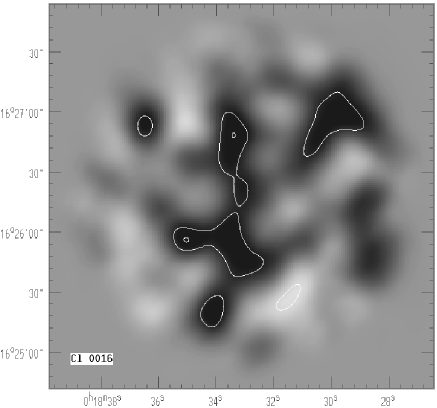
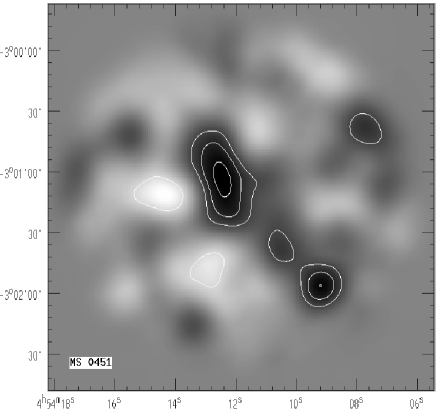
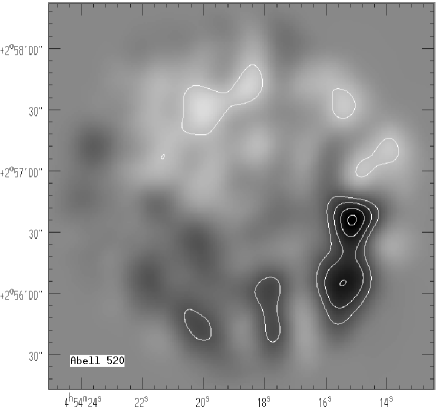
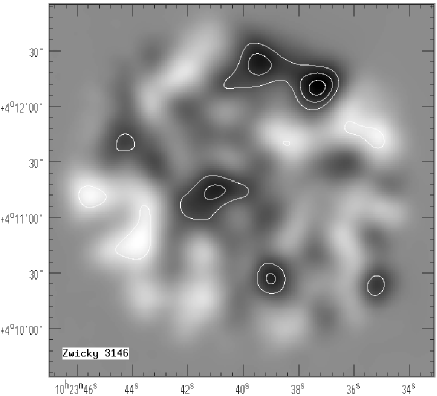
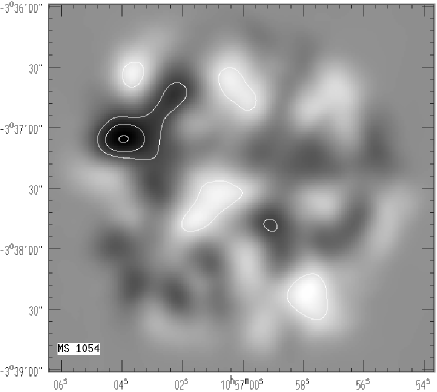
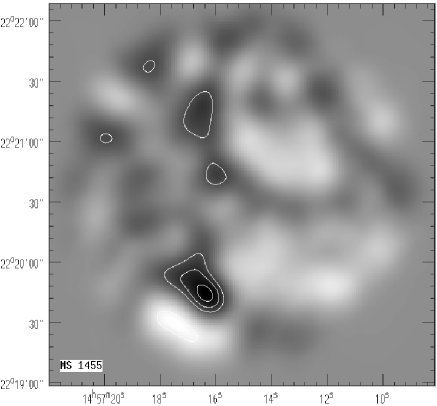
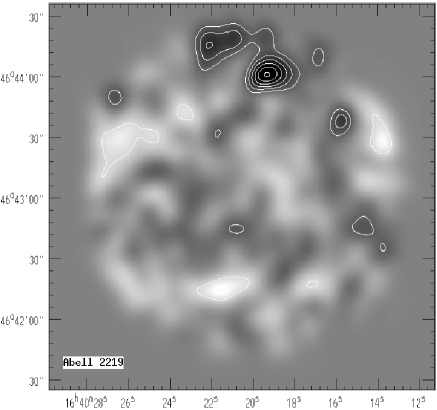
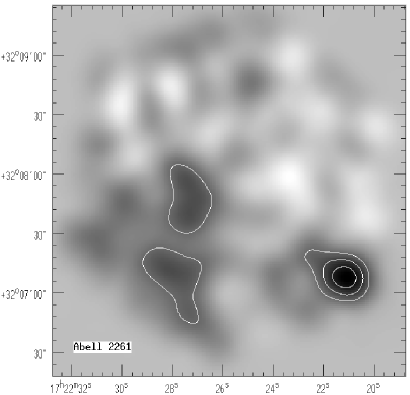
The 850m SCUBA maps for the clusters showing significant source detections are presented in Figs. 1 and 2. Any real objects in our maps are expected to be unresolved and will typically appear as a positive point spread function with FHWM arcsecs at 850m . For most of our maps, we do not expect to see negative signatures for our sources, as the individual scans coadded in the map have different chop throws and directions, diluting the effect of off-beams. We also chopped out of the field in most cases. The edges of the maps incur a rapid rise in noise level due to incomplete sampling of the sky for the outer bolometers of the SCUBA array. Eales et al. (1999) simulated the incomplete sampling at the field edge and found that any spurious sources in Monte Carlo simulations tended to appear in this region. We have therefore clipped the 14 arcsec edge regions in our maps where the noise level increases by a factor 2 times that at the field center.
As the signal-to-noise ratio (S/N) is low for individual pixels, we use a template fitting method for source detection to achieve a maximum gain in S/N, similar to that used in Eales et al. (1999). The cluster maps are convolved with the beam map obtained by imaging Mars, and all peaks greater than are extracted as potential sources. We checked the convolved maps carefully against the raw data to ensure that no residual bad pixels were identified as sources. We also note that there are no strong negative sources in our maps.
Sensitivity limits for deep SCUBA integrations have now been fairly well characterized (Smail et al. 1997, Hughes et al. 1998, Eales et al. 1998, Barger et al. 1999b). But at these low S/N levels, we must be careful to consider possible systematic noise effects. There are currently five identified components which contribute to the overall SCUBA noise level: (i) photon noise from the sky; (ii) telescope and instrumental noise; (iii) blanked-off detector Johnson, phonon and amplifier noise; (iv) excess photon noise from the optics; (v) excess radiative load in the dewar. The noise terms add in quadrature, and the estimate for the relative contributions at the average sky emissivity for our survey () are respectively 29, 25, 17, 13, and 16 per cent (W. Holland private communication). Thus sky noise is the largest source, but does not dominate the others. Nevertheless, we expect the noise to integrate down with time. This will not be true of one additional source of noise: ‘confusion noise’ arising from fluctuations due to undetected sources. However, the level is essentially negligible for these observations - Blain et al. (1998) quote a value of mJy, derived from their source counts, while we find that any reasonable extrapolation of the counts (together with the constraint of not over-producing the FIRB) leads to a variance of no more than mJy. We can therefore safely ignore confusion noise. However, it is worth pointing out that lensing by the clusters effectively allows us to probe below the confusion limit of say .
With transient noise and bad pixels from scan to scan, our confidence in many of the detections is reinforced by dividing the data into two parts and seeing evidence of the sources (at the level) appear in both. Multi-wavelength detections also substantially strengthen our confidence in a source. Although the 450m channel is typically not sensitive enough to detect these objects, especially those lying at higher redshifts, many more of them may be observable at 1350m with deeper photometry than we have currently obtained. Three sources have been subsequently verified through PHOTOMETRY followup observations (MS 0451-A, Abell 2261-A, and MS 1455-A). These are discussed in the individual source section (4.2).
Empirically, the localized noise levels are seen to integrate down in our maps roughly as (see also Ivison et al. 1998a). We note that in a typical 850m SCUBA field of 5.2 square arcmin with independent beams we expect only spurious 3 peaks from Gaussian noise, and and 1 spurious 4 peak from our whole survey.
The completeness of a set of detections has typically been established using synthetic source recovery techniques in Monte Carlo simulations (Smail et al. 1997, Hughes et al. 1998). Our 3 and source catalogues corresponds approximately to the 80 per cent completeness level found in Smail et al. (1997). We estimate that our 4 catalogue is more than 90 per cent complete.
Our sub-mm observations of the clusters are presented in Tables 1 and 2. Table 1 lists the clusters, coordinates, and redshifts, along with total exposure time (based on the number of integrations). The last four columns present the average 850m and 450m sensitivities achieved after subtracting sources from the field, and the number of sources detected at greater than the 3 and 4 levels. Table 2 lists the properties of the detected sources, with coordinates and observed flux densities in each of the three sub-mm wavelength bands. These sub-mm detections and upper limits (upper limits are given as 95 per cent Bayesian confidence regions, assuming Gaussian errors and neglecting the negative flux region) at 1350, 850, and 450m provide rough photometric estimates of the source redshifts (see e.g. Hughes et al. 1998). However, the addition of radio data significantly increases confidence in these photometric redshifts. The final two columns list the VLA radio flux limits, and estimates of the redshift from the sub-mm and radio data, as described below.
Table 1
Sub-mm observations for the clusters in our sample
| Cluster | R.A.a | Dec.a | Exposure time | |||||
|---|---|---|---|---|---|---|---|---|
| (J2000) | (J2000) | (ks) | (mJy) | (mJy) | 3 | 4 | ||
| Cl 0016+16 | 00 18 33.2 | 16 26 18 | 0.541 | 20.5 | 3.1 | 36 | 2 | 0 |
| MS 0451-03 | 04 54 13.4 | 03 01 47 | 0.550 | 14.1 | 4.2 | 181 | 2 | 2 |
| Abell 520 | 04 54 19.0 | 02 56 49 | 0.203 | 7.7 | 5.0 | 66 | 2 | 1 |
| Zwicky 3146 | 10 23 39.6 | 04 11 10 | 0.291 | 12.8 | 2.6 | 25 | 4 | 1 |
| MS 1054-03 | 10 57 00.2 | 03 37 27 | 0.833 | 7.7 | 4.3 | 103 | 1 | 0 |
| MS 1455+22 | 14 57 15.1 | 22 20 35 | 0.259 | 15.4 | 2.1 | 22 | 1 | 1 |
| Abell 2163 | 16 15 34.1 | 06 07 26 | 0.201 | 7.7 | 5.8 | 44 | 0 | 0 |
| Abell 2219 | 16 40 20.5 | 46 42 59 | 0.228 | 15.4 | 1.7 | 8 | 4 | 1 |
| Abell 2261 | 17 22 24.1 | 32 07 45 | 0.224 | 7.7 | 3.8 | 105 | 1 | 1 |
| Total | 17 | 7 | ||||||
a x-ray centre – ROSAT archive.
b Measured RMS over the central 60 arcsec of the field after subtracting a scaled SCUBA beam profile from any identified sources in the region.
Table 2
Details of individual sources
| Source | |||||
| (mJy) | (mJy) | (mJy) | (Jy) | ||
| Cl 0016 | |||||
| A SMMJ | 9.93.3 | 200 | 1.8 | ||
| B SMMJ | 9.83.2 | 200 | 1.8 | ||
| MS 0451 | |||||
| A SMMJ | 16.84.2 | 200 | 2.2 | ||
| B SMMJ | 19.14.2 | 200 | 2.3 | ||
| Abell 520: | |||||
| A SMMJ | 33.05.0 | 420 | 2.2 | ||
| B SMMJ | 16.25.1 | 410 | 1.6 | ||
| Zwicky 3146 | |||||
| A SMMJ | 9.32.5 | 482/2722e | 1.1(0.3)e | ||
| B SMMJ | 9.22.5 | 543 | 1.1 | ||
| C SMMJ | 9.42.6 | 450 | 1.2 | ||
| D SMMJ | 11.22.6 | 467 | 1.3 | ||
| MS 1054 | |||||
| A SMMJ | 15.25.4 | 14.84.3 | 200/1600 | 2.1(0.8) | |
| MS 1455: | |||||
| A SMMJ | 10.12.2 | 294 | 1.5 | ||
| Abell 2219 | |||||
| A SMMJ | 4.32.0 | 10.61.7 | 220 | 1.8 | |
| B SMMJ | 5.81.7 | 593 | 0.8 | ||
| C SMMJ | 5.7 | 280/9100 | 0.9(0.2) | ||
| D SMMJ | 6.32.0 | n/af | 1270 | 0.4 | |
| Abell 2261 | |||||
| A SMMJ | 17.63.9 | 452 | 1.6 |
a Positional errors for SCUBA sources with identifications at radio and optical wavelengths (e.g. Ivison et al. 1998b, Frayer et al. 1999) are arcsec for 4 detections and arcsec for 3 detections.
b Estimated flux densities with errors. All non-detection upper limits are given as 95 per cent Bayesian confidence regions, assuming Gaussian errors and neglecting the negative flux region
c Bayesian 95 per cent limits at 1.4 GHz for sources in A 520, Zw 3146, MS 1455, A 2219, and A 2261, have been extrapolated from the value at 4.9 GHz, using a spectral index appropriate for star formation driven synchrotron emission. For the data from Stocke et al. (1999), only 3 upper limits are given.
d Redshift estimate using Carilli & Yun (1999) radio/far-IR correlation.
e In cases where there is ambiguity between the central cluster galaxy and a background galaxy, the radio flux of the cluster galaxy is also listed, and the cluster redshift is given in brackets.
f This source falls at the very edge of the short wavelength array.
g These sources were verified with 850/450m photometry. See text for details.
4 Properties of individual sources
4.1 VLA radio counterparts
Radio counterparts to sub-mm sources are expected due to the synchrotron emission resulting from either an AGN or shocked gas in supernovae remnants from a starburst (e.g. Richards et al. 1999). Given the small number density of radio emitting objects, the chances of finding a 1.4 GHz VLA object of Jy in our error circle by chance is much less than 1 per cent (Richards et al. 1998). By contrast, identifying optical counterparts to the SCUBA-selected galaxies is a non-trivial matter for two main reasons: 1) the beamsize at 850m (the optimal wavelength for these studies) is arcsec, with pointing errors for the telescope of order 2 arcsec; 2) the large, negative K-corrections (i.e. increase in flux density as the objects are redshifted) of dusty star-forming galaxies at these wavelengths imply that sub-mm observations can detect such objects at in an almost distance-independent manner. Thus several candidate optical galaxies are often present within the uncertainty of the sub-mm detection, along with the possibility that the actual counterpart is at much higher redshift and undetectable with current optical imaging. In this paper we restrict our attention to radio counterparts, and defer detailed optical analysis of the sub-mm source positions to a separate paper.
Carilli & Yun (1999, 2000 – CY) recently demonstrated that crude redshift estimates for distant dusty galaxies could be obtained in the absence of an optical counterpart using the spectral index between the sub-mm (850 m) and radio (1.4 GHz) wavebands (), with a mean galaxy model parameterized as . The model SEDs used by CY are based largely on lower redshift observations, however they are able to successfully describe the few high-redshift galaxies which have multi-wavelength radio and sub-mm observations available. Follow up studies by Blain (1999) have shown that if lower dust temperatures are adopted for the sub-mm population than are seen in the local sources used in CY’s models, then the allowed redshifts are slightly lower for a given value of . The isolated cases which do not fall within the CY model predictions are known to have strong radio-loud AGN components. The important point is that the derived redshift provides a robust lower limit, irrespective of the nature of the emission mechanism, AGN or starburst, since an AGN contribution to the radio emission flattens the radio spectrum. The modest scatter between the models in CY suggests that the technique currently provides the most useful limit on the redshifts of sub-mm galaxies, in the absence of an optical counterpart.
Smail et al. (2000) recently applied the CY analysis to deep radio observations of the complete sample of SCUBA-selected galaxies from their cluster lens survey (Smail et al. 1998, Ivison et al. 2000), revealing a higher redshift distribution than previously expected from optical follow-up work. Using existing VLA data for our SCUBA cluster sample, we can thus constrain the redshift distribution of our population and set the stage for optical/near-IR follow-up identifications.
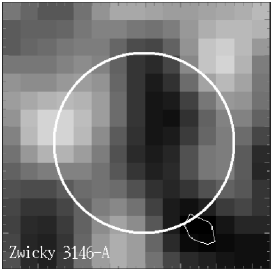
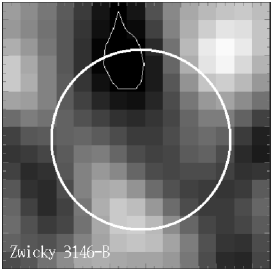
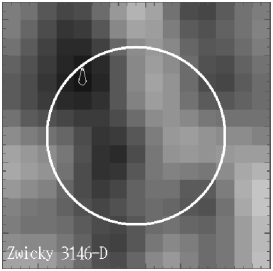
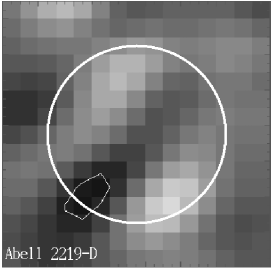
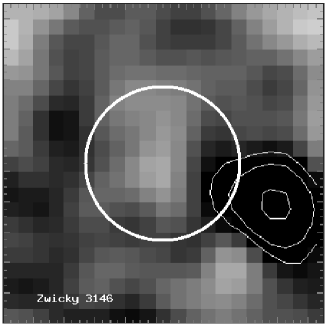
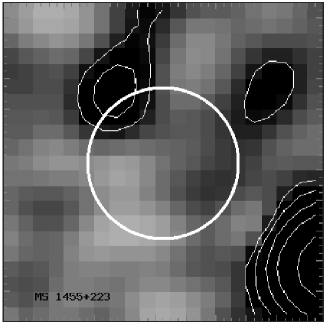
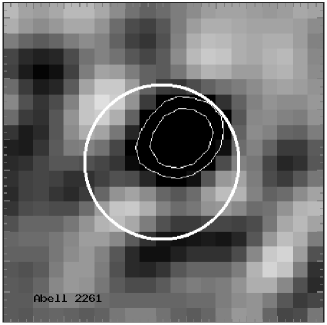
We searched for radio counterparts around the nominal positions of the sub-mm sources based on the SCUBA astrometry. Positional errors for SCUBA sources from the literature which were clearly identified in radio and optical wavelengths (e.g. Ivison et al. 1998b, Frayer et al. 1999) were arcsec for 4 detections and arcsec for 3 detections, and we use similar error circles for our analysis. Radio limits at 1.4 GHz for sources in A 520, Zw 3146, MS 1455, and A 2261, have been extrapolated from the value at 4.9 GHz, using a spectral index (i.e. ) appropriate for star formation driven synchrotron emission. This provides a reasonable estimate of the source redshift using the CY relation (since a brighter radio counterpart leads to a lower redshift estimate, while an AGN component would flatten the spectrum giving rise to a higher redshift). The 1.4 GHz VLA data from Stocke et al. (1999) are used to derive limits for Cl 0016, MS 0451, and MS 1054, and an archive 1.4 GHz map of A 2219 (courtesy of F. Owen) was used to measure fluxes directly. In 5 cases, there were radio sources lying within the error circle of the sub-mm beam. One of these may be a central cluster galaxy and is also discussed in the following section. The 15 arcsec by 15 arcsec region surrounding the sub-mm sources are shown in Fig. 3, with the apparent radio flux densities or limits listed in Table 2.
We use the CY relation (which is consistent with dust temperature K) to generate these lower limits to the source redshifts. We note that the actual dust temperature in the sub-mm sources may be lower, bringing down the redshifts, or of course higher, thereby raising the inferred redshift. In general the constrained quantity is .
4.2 Source characteristics and evidence for cluster members
We now discuss each cluster field in detail:
Cl 001616
The data for this cluster show a general positive excess at the
level, with 2 peaks barely reaching the level in the convolved map
(sources A and B).
There are no 1.4 GHz VLA counterparts down to the 200 Jy level,
although the bright 2.7 mJy radio souce from Stocke et al. (1999) lies on
a clear sub-mm peak which reaches 2.6 significance
in the convolved map.
The generally positive excess could be caused by a Sunyaev-Zel’dovich
increment (core radius arcmin – Carlstrom et al. 1999),
which is too noisy in this map to detect with any
confidence.
However it may have some effect on the detectability of other sources in
this field.
MS 045103
An unresolved source (B: SMMJ)
is found to the West in this cluster, and there is north-south
extended positive
sub-mm emission over the x-ray centroid region, reaching 4 in the
convolved map (A: SMMJ). An additional
850m photometry observation centered on the elongated source
reveals a detection of 10.13.0 mJy, which is consistent with the
peak flux densities found along the source as well as the positional accuracy
of the SCUBA map. This central source is offset by 20 arcsecs to the east from
the brightest cluster galaxy (BCG), and 20 arcsecs to the west from
a 1.8 mJy VLA source (Stocke et al. 1999).
This detection could possibly represent cool dust associated with a cooling
flow or could be associated with the Sunyaev-Zel’dovich effect – in either
case the emission would have to be very strong an isolated to a small region
of the cluster. For this particular cluster, the in-field chop reveals
signs of the negative beams. However, another
map of this cluster, observed with a large chop for
Sunyaev-Zel’dovich increment measurement (Halpern et al. in preparation)
suggests that additional source structure in the central region would
significantly distort a clear offbeam signature.
The extended nature of this central source (also verified in our independent
map) is most likely to be a blend of two or more sources. For the purposes
of Table 2 we treat this as a single source. Positions and flux density
estimates for such blends should be treated with some caution until higher
resolution images are available.
Abell 520
A large gradient appears to be present across the field,
as evidenced by the
increased positive excursions in the lower halves of both the
450 and 850m images and negative excursions in the upper half.
This could either be real or due to some residual atmospheric signal –
we could not find a convincing way to tell from our data, although we
suspect the latter explanation.
An apparent source (B: SMMJ) lying to the
south of the primary source (A: SMMJ),
is above the noise even once a
linear gradient is fit to the plane and subtracted. The flux density
presented in Table 2 for this source reflects the subtraction of this
linear gradient component.
There is no detection of either the BCG or the
bright radio source lying to the east in the archive VLA map.
Zwicky 3146
The central source in Zw 3146 (A: SMMJ)
appears to be extended east-west, and may be another blend.
The VLA map reveals that the western extent
of the SCUBA source is associated with the BCG, with fairly bright radio
emission (mJy).
However, the eastern part of the SCUBA source shows no radio emission
(Jy), and the CY analysis
suggests a high redshift background source.
Sources B and C in this cluster field also have weak 4.9 GHz detections
in the archive VLA map.
MS 105403
The source in the MS 1054 field (A: SMMJ),
has a 1350/850m flux density ratio near unity. As thermal dust
emission alone would produce a steep spectrum,
this may indicate that the object
has a flat-spectrum AGN radio contribution at 1350m,
and perhaps at 850m as well.
A bright VLA counterpart, offset by 15 arcsec from the sub-mm peak, has been
identified by Condon et al. (1998) as
a cluster AGN radio source, and the CY relationship is consistent within
errors with the source lying in the cluster at .
However, such a large radio/sub-mm offset is unlikely (see for example Richards
et al. 1999), and SMMJ could easily be a background galaxy
lensed by the cluster. Within errors, the 1350/850m ratio
is not inconsistent with a higher redshift source. This source has been
verified in another SCUBA map of this cluster, although at a slightly lower
flux level (P. van der Werf, private communication).
MS 145522
There is some evidence for 850m SCUBA flux associated with the
BCG in the raw MS 1455 maps.
However, a somewhat noisy central pixel during the observations
of this cluster skews the peak profiles sufficiently that our source
finding routine does not identify this as a detection (the source
appears at only 2.6 in the final convolved map). We do not include
this as a source in our catalogue until it can be verified.
However, the proximity of the sub-mm peak to 2 bright radio sources
(Fig. 4), and a possible CO(1-0) detection for the BCG
(Edge et al. in preparation) lends credence to this putative source.
The bright sub-mm source to the south (A: SMMJ)
has no VLA counterpart in the archive maps.
An additional 850m photometry observation centered on source-A
reveals a detection of 6.81.8 mJy, which is consistent within the
relative errors between the mapping and photometry measurements,
as well as the extended nature of this source and positional uncertainties.
Abell 2163
No sources were found in this cluster field down to a 3 sensitivity
of 17 mJy (corresponding roughly to 6 mJy after correction for lensing).
This cluster had the poorest sensitivity, and
we include it here for completeness only.
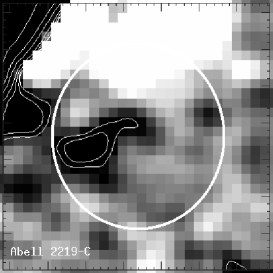
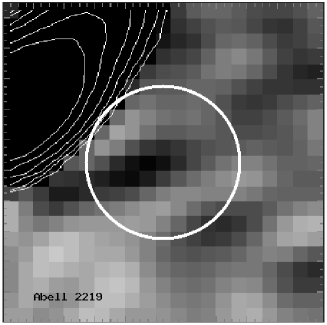
Abell 2219
This map has by far the lowest 450m rms, and as a result there are,
in addition to the 850m detections, two 450m detections at the
level.
The 1350/850m and 450/850m ratios and lack of a 4.9 GHz
detection for source A (SMMJ) are consistent
with the high redshift predicted from CY.
This is the only source in A 2219 that does not have at least positive
flux density in the VLA archive map. The central source
(C: SMMJ), is at 850m but has a
fairly clear detection at 450m. It does not quite align with the
central galaxy radio emission (see Fig. 4),
but within errors, it is possible that the source is a cluster member.
Indeed the large implied 450/850m flux density ratio is
indicative of a rather low redshift source. In the archive 1.4 GHz map,
however, there is a source lying near the SCUBA centroid, offset
arcsec from the BCG.
Source D (SMMJ) lies near the edge of the frame (and off the
450m frame entirely), and is only 3 above the
local noise level. However the centroid is within
5 arcsec of an ISO 15m source (Barvainis, Antonucci & Helou 1999),
with which the sub-mm source may be associated.
Abell 2261
Although the bright () source to the west
(A: SMMJ)
does not correspond with any radio
emission, the central 2.5 peak in the SCUBA map is identified
with a radio source coincident with the optical BCG (Fig. 4).
An additional 850m photometry observation centered on source-A
reveals a detection of 13.62.8 mJy, which is consistent within the
relative errors between the mapping and photometry measurements,
as well as the extended nature of this source and positional uncertainties.
4.3 Cooling flows and centrally concentrated dust emission
The high central densities of the x-ray gas in many luminous clusters lead to predicted cooling times shorter than the Hubble time (e.g. Fabian 1994). This cooling gas, which can not support the pressure exerted by the overlying hot gas, is expected to flow into the cluster centre. Supporting evidence for such cooling flows is now available in the form of inverted x-ray temperature profiles (e.g. Buote 1999), and x-ray emission lines show gas that has lost most of its thermal energy. The fate of this cool gas remains controversial (e.g. Braine & Dupraz 1994) as no sink has yet been clearly identified.
Observations of the central cluster galaxies in cooling-flow clusters indicate that the cooling flows are not forming large numbers of stars. On the other hand, such stars could be hidden if the initial mass function is biased towards low masses, making the integrated stellar spectrum difficult to detect (e.g. Fabian, Nulsen & Canizares 1982; Mathews & Brighenti 1999). However, the emission-line nebulosity around the central galaxies in many cooling-flow clusters, seen on scales of up to 100 kpc, have emission-line ratios suggestive of large amounts of dust in the central regions – this dust could obscure any stars formed there (Hansen, Jörgensen & Nörgaard-Nielsen 1995; Allen et al. 1995). HST imaging of central cluster galaxies (e.g. for Abell 1795 – McNamara et al. 1996; Pinkney et al. 1996, for Abell 2597 – Koekemoer et al. 1999) has also directly detected dust lanes in some cases. At present the total amount or temperature of this dust is difficult to estimate from the scant observational evidence. Whether the observed dust originate from the cooled gas clouds themselves or from the on-going star formation remains unknown.
SCUBA data may help here by probing emission from cool dust in or around the central galaxies in clusters. The implications of detected cool dust in the BCG of massive clusters for the interpretation of star formation in cooling-flow galaxies, has been discussed in Annis & Jewitt (1993) and Edge et al. (1999) Although there are no highly significant detections of the BCGs in our sample, 3 of the clusters show a marginal positive flux density at 850m () near the BCG. In Abell 2219, a 3.5 detection at 450m (2.3 at 850m) lies very near a radio luminous BCG (Fig. 4). In addition, the cluster MS 0451 shows an extended 4 detection near the x-ray centroid (Donahue 1996), although the brightest cluster galaxy is offset from this position by 23 arcsec, and the only radio source in the vicinity is offset to the other side by 20 arcsecs. Radio maps of the 4 cluster centres with possible BCG detection, along with 10 arcsec sub-mm error circles for reference, are shown in Fig. 4.
Molecular gas, traced by CO emission, might also be present in strong cooling flows (Braine et al. 1995). For MS 1455, we also obtained an upper limit on the CO(4-3) emission from the BCG, which suggests a gas-to-dust ratio of if the SCUBA peak were actually a detection. This would be somewhat unusual for known properties of dusty BCGs (Edge et al. 1999), but a weak CO(1-0) detection for the MS 1455 BCG (A. Edge, private communication) lends support to a possible SCUBA detection.
If the SCUBA detection in MS 0451 is associated with a cooling flow, then it is fairly unusual, and may indicate a massive, but highly obscured optical counterpart is actually being built by cooling flow fallout at the true centre of the cluster potential.
Table 3
Limits on dust mass for central cooling flows.
| Cluster | R.A.a | Dec.a | Dust massc | /yrd | ||
| (J2000) | (J2000) | (mJy) | (mJy) | |||
| CL 0016+16 | 00 18 33.2 | 16 26 18 | 6.1 | 66 | n/a | |
| MS 0451-03 | 04 54 13.4 | 03 01 47 | 19.14.2 | 354 | n/a | |
| Abell 520 | 04 54 19.0 | 02 56 49 | 10.0 | 116 | 85 | |
| Zwicky 3146 | 10 23 39.6 | 04 11 10 | 6.62.6 | 48 | 1358 | |
| MS 1054-03 | 10 56 06.2 | 03 37 27 | 8.4 | 203 | n/a | |
| MS 1455+22 | 14 57 15.1 | 22 20 35 | 5.32.1 | 42 | 1227 | |
| Abell 2163 | 16 15 34.1 | 06 07 26 | 11.3 | 86 | 90 | |
| Abell 2219 | 16 40 20.5 | 46 42 59 | 3.61.7 | 485 | ||
| Abell 2261 | 17 22 24.1 | 32 07 45 | 9.53.8 | 205 | 680 |
a BCG position.
b Where no positive value is detected, we quote Bayesian 95 per cent upper limits.
c Assuming K and , with .
d Mass deposition values from Allen (2000). The three high- clusters do not have the x-ray spatial resolution for accurate deprojection (Donahue et al. 1999)
We can place limits on the dust mass for the BCG for all clusters in our sample, by considering the 850m flux density limit at the redshift of the BCG (see Edge et al. 1999), and adopting model dust parameters, for example K, with an emissivity index of 1.5. These limits along with the position of the BCG are presented in Table 3. Corresponding CO(1-0) detections and limits, as well as broader implications for cooling flows are presented in Edge et al. (in preparation). The limits are generally much less than the total mass deposition implied by the cluster cooling flows. But our observations are restricted to emission around the BCG, and in any case the limits are model dependent. Any conclusions we draw must necessarily not be very strong. Our non-detections or relatively weak sub-mm emission from most BCGs in a sample of nine clusters, imply that substantial effort will be required to detect other central cluster galaxies. And that if some of the mass is being deposited as cool dust, this will be hard to detect in typical central cluster galaxies with current instrumentation.
5 Source Counts
Source count models for rich cluster fields in the sub-mm have been studied in detail by Blain (1997) and Blain et al. (1999), with observational constraints presented in Smail et al. (1997) and Ivison et al. (2000). For unmagnified blank fields, the sub-mm galaxy counts can be derived by simply dividing the number of detected sources by the surveyed area, although the effects of clustering may have to be considered in small fields (Scott & White 1999). The situation is more complicated in the case of lensing due to a massive cluster, since the source plane is both distorted and magnified at a level dictated by the source redshift and position. Thus in the image plane, various regions are observed to different depths. Although our clusters were not chosen to provide the largest lensing amplification, the models of Blain (1997, figure 4) show that our cluster redshifts are essentially optimal for maximum amplification, with the exception of MS 1054 which has slightly too high a redshift, but still incurs a reasonably large lensing amplification.
We model the amplification for each source and the effective depth of the source plane area observed using an elliptical potential model of each cluster (Korman et al. 1994, Newbury 1997). Parameters for the models are derived from both our own imaging data and from the best current information available in the literature. The lensing inversion is based on the prescription of Korman et al. (1994) and Newbury & Fahlman (1999), allowing a calculation of the lensing amplification and distortion as a function of position in the image plane. Table 4 presents the parameters for each cluster along with an estimate for the lensing amplification at each source position. Columns list the cluster name, redshift, cluster velocity dispersion, angular distance and position angle from North of each source relative to the x-ray centroid, and resulting lens amplification. The final column lists the reference for the cluster parameters. All distances assume a flat -dominated cosmology with .
The essential parameters of the model are the redshift of the cluster and the 1-D (line-of-sight) velocity dispersion (), the latter being essential for setting the mass scale. These two quantities set the length scale in the image plane. Larger cluster redshifts reduce the effective magnification, while larger cluster velocity dispersions (cluster mass) increase the magnification. Although more detailed mass models can in principle be constructed using the radial velocities of the individual cluster members (see Blain et al. 1999a), the errors in the source counts are of order 30 per cent, and our results would be very little affected by the use of such cluster mass models.
There is still an ambiguity associated with the unknown background source redshift. However, the models can be used to constrain the range of possible magnifications. For sources at reasonably large redshift ( say), we find that the cumulative source counts depend fairly weakly on the actual source redshift (less than 30 per cent scatter) in agreement with Blain et al. (1999a). If all sources are assumed to lie at , the scatter reduces further. We assume for simplicity that all sources lie at . Based on our CY radio analysis of the source redshifts, this is a reasonable assumption, although some sources may in fact lie at somewhat lower redshifts, especially if their dust temperatures are colder than 50 K.

The cluster ellipticity () is chosen based on an outer contour for the central galaxy, if one exists. In the absence of this BCG contour, we assume circular symmetry. The ellipticity is important only in the case of sources near the cluster centre such as in Zw 3146. The core radius () of the cluster is a model-dependent parameter – the core radius of the x-ray gas being temperature dependent. However for clusters with lensed arcs in their image, it is possible to estimate the core radius directly. Again, the magnification is particularly sensitive to this number only near the cluster centre, as it sets the location of the critical lines with very large magnification. The ellipticity and core radius are quasi-independent parameters of the models. For modest values of the ellipticity, this parameter plays a very small role, especially in view of all the other uncertainties involved.
Lensing increases the brightness of sources and also magnifies the area – so we reach to fainter effective flux limits, but over a smaller effective solid angle. Fig. 5 shows the resulting magnification vs source plane area for each cluster. Our complete survey area in the source plane is in fact only arcmin2, from a total surveyed SCUBA field area of arcmin2. We estimate that the uncertainties in cluster parameters (, , ) to the lensing model contribute per cent error, a little larger than the errors in calibrating SCUBA maps, but less than the Poisson error in the source counts themselves.
Table 4
Lensing parameters for clusters
| Cluster | (PA)a | Lens amplification | Cluster reference | ||
|---|---|---|---|---|---|
| Cl 001616 | 0.541 | 1243 | 44(138), 62(171) | 3.0, 2.6 | Ellingson et al. 1998 |
| MS 045103 | 0.550 | 1353 | 65(130), 25(46) | 2.6, 4.5 | Donahue (1996) |
| Abell 520 | 0.203 | 927 | 61(104), 74(138) | 3.4, 3.1 | Gioia & Luppino (1994) |
| Zwicky 3146 | 0.291 | 1310 | 31(117), 62(179), 69(-33), 78(-136) | 6.8, 3.7, 3.5, 3.2 | Ebeling et al. (1996) |
| MS 105403 | 0.833 | 1170 | 63(70) | 2.6 | Donahue et al. (1998) |
| MS 145522 | 0.259 | 1168 | 58(162.5) | 2.8 | Stocke et al. (1991) |
| Abell 2163 | 0.201 | 1231 | n/a | n/a | Gioia & Luppino (1994) |
| Abell 2219 | 0.228 | 1000 | 66(17), 45(157), 15(178), 41(-93) | 3.6, 3.2, 7.5, 3.0 | Smail et al. (1996) |
| Abell 2261 | 0.224 | 1102 | 72(-124) | 3.3 | Ebeling et al. (1996) |
a Distance and position angle of the sources (listed in Table 2) from the x-ray centre.
6 Results

With the lensing factored in, our effective noise level in the central regions of the cluster fields decreases sharply, as displayed in Fig. 6. From these relations of sensitivity as a function of cluster area, we can calculate the effective area surveyed to a given depth. Fig. 7 shows the integral source counts from our survey including all sources detected at (solid circles, binned). We plot the counts from the Smail, Ivison, Blain (1997) lensing survey presented in Blain et al. (1999c, crosses), as well as a fit to the combined blank field sub-mm counts (Hughes et al. 1998, Barger et al. 1999b, Eales et al. 1999) constrained at faint fluxes to not overproduce the far-IR background (dotted line). When we restrict ourselves to the sub-set which contains no obvious cluster members there is no dramatic change in the counts (open circles in Fig. 7). We fit these counts with a simple power law , with mJy, and find , and . These are close to the blank field values of , and . A direct comparison with other published sub-mm source counts thus reveals a good agreement between results, including gravitationally lensed and blank field counts. SCUBA preferentially selects galaxies with , due to the spectral shape at these wavelengths. Therefore we expect few detections in the clusters themselves, however, this may be the source of some of the small discrepancy between the various surveys.

A positive magnification from the cluster lensing means that we are seeing fainter galaxies, and hence an increase in the surface density of galaxies. However, this is offset by the loss in area due to field distortion. If the source count power-law index were too shallow, this would result in a less efficient survey compared to a blank field survey with equivalent integration time. However, our results show a net positive bias, so that we are detecting more sources per unit time and at unlensed flux densities below what would be possible in blank field searches, in line with what was found earlier by Smail et al. (1997).
Using the amplification due to the foreground cluster, lensed surveys also suffer less from confusion noise (e.g. Blain et al. 1998). The large beamsize of SCUBA implies a confusion limit at mJy, while we have detected 4 possible sources fainter than 2 mJy.
7 Discussion
Estimates of the redshift distribution for the SCUBA-selected sources remain in dispute (Hughes et al. 1998; Barger et al. 1999a; Lilly et al. 1999a). Hughes et al. (1998) concluded that the bulk of the population is at –4, based on photometric redshift limits for the probable counterparts of five sub-mm sources in the Hubble Deep Field (c.f. Richards 1999; Downes et al. 1999). Barger et al. (1999a) undertook a spectroscopic survey of the Smail et al. (1999) sub-mm sample and concluded that the median redshift was –2, with the bulk of the population having –3. Lilly et al. (1999a) used archival spectroscopy and broad-band photometry of sub-mm sources from the Eales et al. (1999) survey to conclude that the population spans –3, with a third at . Given the relatively small number statistics and the very real possibility of some misidentifications, it is unclear whether there is any genuine disagreement.
However, use of the Carilli & Yun (CY – 2000) relation of radio/far-IR flux to predict the redshifts for a large sample of SCUBA sources (Smail et al. 2000), has suggested that the population may have a median value lying between and 3. This is consistent with our CY analysis using VLA maps, which result in a median value lying at , although dependent on the dust temperature and emissivity adopted. Fig. 8 shows an estimate of the cumulative redshift distribution for our entire sample, derived from the CY relation using radio detections and lower limits. Also depicted are the cumulative redshift distributions for models formulated to fit the far-IR background, and various infrared counts, by Guiderdoni et al. (1998), and Blain et al. (1999b).
The archival radio maps for many of our cluster fields are not deep enough to put strong constraints on the redshift distribution of sub-mm sources, with few actual radio detections. Given that the derived redshifts are generally lower limits, it is difficult to presently discriminate between predictions for the redshift distribution from various models (e.g. Blain et al. (1999b) model Gaussian and modified Gaussian models (long and short dashes) or the Guiderdoni et al. (1998) model (dotted line)). However, the radio/far-IR correlation indicates that the bulk of the dust emission in the universe did not occur at redshifts much below . The true redshift distribution remains to be determined. Deep optical and near-IR imaging should also uncover these objects’ optical properties, and resolve currently unanswered questions such as whether the galaxies would be detectable through their Lyman break (Chapman et al. 2000), or whether they have extremely red colours (Smail et al. 1999).

We can calculate lower limits to the far-IR background radiation intensities from measured flux densities of resolved 4 sources in our cluster fields. The contribution is the sum , where is the area which has a sensitivity necessary to see a source of flux , where lensing has been factored into the sum. We find averaged over all 9 fields. This corresponds to 20 per cent of the total FIRB at 850m as measured by Fixsen et al. (1998): . The accuracy of these estimates however depends on the lensing models and other details of the counts, together with the remaining uncertainty in the FIRB measurement as these wavelengths. If we take the simple power law model integrated up from mJy, then the background is . Using our slope from Fig. 7 accounts for more than half of the background down to mJy.
8 Conclusions
-
1.
We have detected 17 new sub-mm sources in the fields of 9 rich galaxy clusters. Comparison with VLA radio images suggests that most of these are being lensed by the cluster mass, rather than being in the clusters themselves.
-
2.
We see no strong evidence for cool dust emission around BCGs, which might be related to cooling flows.
-
3.
Our sub-mm source counts are in reasonable agreement with existing sub-mm surveys, and extend the list of such sources available for follow up at other wavelengths.
-
4.
The redshift distribution has been loosely constrained using the radio-far-IR correlation, and favours a relatively high redshift () for the bulk of dust emission in the Universe.
ACKNOWLEDGEMENTS
This work was supported by the Natural Sciences and Engineering Research Council of Canada. The James Clerk Maxwell Telescope is operated by The Joint Astronomy Centre on behalf of the Particle Physics and Astronomy Research Council of the United Kingdom, the Netherlands Organisation for Scientific Research, and the National Research Council of Canada. We would like to acknowledge the staff at JCMT for facilitating these observations. The VLA is run by NRAO and is operated by Associated Universities Inc., under a cooperative agreement with the National Science Foundation.
References
- [Allen et al. 1995] Allen S.W., Fabian A.C., Edge A.C., Böhringer H., White D.A., 1995, MNRAS, 275, 741
- [Allen 2000] Allen S.W., 2000, MNRAS, 315, 269
- [Andreani et al. 1999] Andreani P., Bohringer H., dall’Ogilio G., Martinis L., Shaver P., et al., 1999 ApJ, 513, 23
- [Annis & Jewitt 1993] Annis J., Jewitt D., 1993, MNRAS, 264, 593
- [Barger et al. 1998] Barger A.J., Cowie L.L., Sanders D.B., Fulton E., Taniguchi Y., et al., 1998, Nature, 394, 248
- [Barger et al. 1999a] Barger A.J., Cowie L.L., Smail I., Ivison R.J., Blain A.W. et al., 1999a, AJ, 117, 2656
- [Barger et al. 1999b] Barger A.J., Cowie L.L., Sanders D.B., ApJ, 518 L5
- [Barvainis et al. 1999] Barvainis R., Antonucci R., Helou, G., 1999, AJ, 118, 645
- [Bertoldi et al. 2000] Bertoldi F., Carilli C.L., Menten K.M., Owen F., Dey A., et al., 2000, submitted to A&A [astro-ph/0006094]
- [Birkinshaw 1999] Birkinshaw, M., 1999, Phys. Rep., 310, 97
- [Blain 1997] Blain A.W. 1997, MNRAS, 290, 553
- [Blain et al. 1998] Blain A.W., Ivison R. J., Smail I. 1998, MNRAS, 296, L29
- [Blain et al. 1999a] Blain A.W., Smail I., Ivison R.J., Kneib J.-P. 1999a, ApJ, 512, L87
- [Blain et al. 1999b] Blain A.W., Smail I., Ivison R.J., Kneib J.-P. 1999b, MNRAS, 302, 632
- [Blain et al. 1999c] Blain A.W., Ivison R.J., Kneib J.-P., Smail I., 1999c, in ‘The Hy-Redshift Universe: galaxy formation and evolution at high redshift’, eds. A.J. Bunker & W.J.M. van Breughel, ASP conference vol193 ASP: San Francisco, p.246-249
- [Blain 1999] Blain A.W., 1999, MNRAS, 309, 955
- [Borys, Chapman & Scott 1998] Borys C., Chapman S.C., Scott D., 1999, MNRAS, 308, 527
- [Braine & Dupraz 1994] Braine J., Dupraz C. 1994, A&A, 283, 407
- [Braine et al. 1995] Braine J., Wyrowski F., Radford S.J.E., Henkel C., Lesch, H., 1995 A&A, 293, 315
- [Buote 1999] Buote D.A., 1999, MNRAS, 309, 685
- [] Carilli C.L., Yun M.S., 1999, ApJ, 513, L13
- [] Carilli C.L., Yun M.S., 2000, ApJ, 530, 618
- [] Carlstrom J., Joy M., Grego L., Holder G., Holzapfel W., et al., 1999, ‘Particle Physics and the Universe’, Physica Scripta and World Scientific, eds. L. Bergstrom, P. Carlson and C. Fransson, [astro-ph/9905255]
- [Chapman et al. 1999] Chapman S.C., Scott D., Lewis, G., Borys C., Fahlman G.G., 1999, A&A, 352, 406
- [Chapman et al. 2000] Chapman S.C., Scott D., Steidel C., Borys C., Halpern M., Morris S., Adelberger K., Dickinson M., Giavalisco M., Pettini M., 2000a, MNRAS, in press [astro-ph/9909092]
- [] Crawford C., Allen S., Ebeling H., Edge A., Fabian A., 1999, MNRAS, 307, 91
- [Donahue 1996] Donahue M., 1996, ApJ, 468, 79
- [] Donahue M., Voit M., Gioia I., Luppino G., Hughes J., Stocke J., 1998, ApJ, 502, 550
- [Donahue et al. 1999] Donahue M., et al., 1999, ApJ, 527, 525
- [Downes et al. 1999] Downes D., Neri R., Greve A., Guilloteau S., Casoli F., et al., 1999, A&A, 347, 809
- [] Eales S.A., Lilly S.J., Gear W.K., Bond J.R., Dunne L., et al., 1999, ApJ, 518, L641
- [] Ebeling H., Voges W., Böhringer H., Edge A., Huchra J., et al., 1996, MNRAS, 281, 799
- [] Edge A.C., Ivison R.J., Smail I., Blain A.W., Kneib J.-P., 1999a, MNRAS, 306, 599
- [] Ellingson E., Yee H.K., Abraham R.G., Morris S.L., Carlberg R., 1998, ApJS, 116, 247
- [Fabian 1994] Fabian A.C., 1994, ARAA, 32, 277
- [Fabian et al. 1982] Fabian A.C., Nulsen P.E.J., Canizares C.R., 1982, MNRAS, 201, 933
- [Fixsen et al. 1998] Fixsen D.J., Dwek E., Mather J.C., Bennett C.L., Shafer R.A., 1998, ApJ, 508, 123
- [Frayer et al. 2000] Frayer D., Smail I., Ivison R.J., Scoville N.Z., 2000, ApJ, in press
- [Frayer et al. 1999] Frayer D., Ivison R.J., Scoville N.Z., Evans A.S., Yun M., et al., 1999, ApJ, 514, L13
- [Frayer et al. 1998] Frayer D., Smail I., Ivison R.J., Scoville N.Z., Yun M., Evans A.S., et al., 1998, ApJ, 506, L7
- [Gear et al. 2000] Gear W., Lilly S., Stevens J., Clements D., Webb T., Eales S., Dunne L., 2000, MNRAS, in press, astroph/0007054
- [Gioia & Luppino 1994] Gioia I.M., Luppino G.A., 1994, ApJS, 94, 583
- [Guiderdoni et al. 1997] Guiderdoni B., Bouchet F.R., Puget J.-L., Lagache G., Hivon E., 1997, Nature, 390, 257
- [Guiderdoni et al. 1997] Guiderdoni B., Hivon E., Bouchet F.R., Maffei B., 1998, MNRAS, 295, 877
- [Hansen et al. 1995] Hansen L., Jorgensen H.E., Norgaard-Nielsen H.U., 1995, A&A, 297, 13
- [Hauser et al. 1998] Hauser M.G., Arendt R.G., Kelsall T., Dwek E., Odegard N., et al., 1998, ApJ, 508, 25
- [Holland et al. 1999] Holland W.S., Robson E.I., Gear W.K., Cunningham C.R., Lightfoot J., et al., 1999, MNRAS, 303, 659
- [Hughes et al. 1998] Hughes D.H. et al. 1998, Nature, 394, 241
- [Ivison et al. 1998a] Ivison R.J., Dunlop J.D., Hughes D.H., Archibald E., Stevens J.A., et al., 1998a, ApJ, 494, 211
- [Ivison et al. 1998b] Ivison R.J., Smail I., Le Borgne J.-F., Blain A.W., Kneib J.-P., et al., 1998b, MNRAS, 298, 583
- [Ivison et al. 2000] Ivison R.J., Smail I., Barger A.J., Kneib J.-P., Blain A.S., et al., 2000, MNRAS, in press [astro-ph/9911069]
- [Jenness et al. 1998] Jenness T., Lightfoot J.F., Holland W.S., 1998, SPIE, 3357 548 [astro-ph/9809120]
- [Koekemoer et al. 1999] Koekemoer A.M., O’Dea C.P., Sarazin C.L., McNamara, B.R., Donahue, M., et al., 1999, ApJ, 525, 621
- [Korman et al. 1994] Korman P., Schneider P., Bartelmann M., 1994, A&A, 284, 285
- [Lilly et al. 1999a] Lilly S.J., Eales S.A., Gear W.K., Hammer F., Le Fèvre O., et al., 1999a, ApJ, 343, 123
- [Lilly et al. 1999b] Lilly S.J., Eales S.A., Gear W.K., Webb T.M., Bond J.R., et al., 1999b, ‘Formation of Galactic Bulges’, ed. C.M. Carollo, H.C. Ferguson & R.F.G. Wyse, Cambridge University Press, Cambridge p. 119 [astro-ph/9903157]
- [Lagache et al. 1999] Lagache G., Abergal A., Boulanger F., Desert F.X., Puget J.-L., 1999, A&A, 344, 322
- [Mathews & Brighenti 1999] Mathews W.G., Brighenti, F., 1999, ApJ, 526, 114
- [McNamara et al. 1996] McNamara B.R., Wise M., Sarazin C.L., Jannuzi B.T., Elston, R., 1996, ApJ, 466, L9
- [Newbury 1997] Newbury P., 1997, PhD thesis, University of British Columbia
- [] Newbury P., Fahlman, G.G., 1999, preprint [astro-ph/9905254]
- [Pinkney et al. 1996] Pinkney J., Holtzman J., Garasi C., Watson A.M., Gallagher J.S., et al., 1996, ApJ, 468, L13
- [] Richards E.A., Fomalont E B., Kellermann K. 1999, ApJ, 526, L71
- [Richards 1999] Richards E.A., 1999, ApJ, 513, L9
- [] Richards E., Kellermann K.I., Fomalont E.B., Windhorst R.A., Partridge R.B., 1998, AJ, 116, 1039
- [Sanders 1999] Sanders D.B., 1999, ‘Space Infrared Telescopes and Related Science’, 32nd COSPAR workshop, ed. T. Matsumoto, T. de Graauw [astro-ph/9904292]
- [Sanders & Mirabel 1996] Sanders D.B., Mirabel I.F., 1996, ARAA, 34, 749
- [] Scott D., and White M., 1999, A&A, 346, 1
- [Smail et al. 1996] Smail I., Dressler A., Kneib J-P., Ellis R.S., Couch W., 1996, ApJ, 469, 508
- [Smail et al. 1997] Smail I., Ivison R.J., Blain A.W. 1997, ApJ, 490, L5
- [Smail et al. 1998] Smail I., Ivison R.J., Blain A.W., Kneib J.-P. 1998, ApJ, 507, L21
- [Smail et al. 1999] Smail I., Ivison R.J., Kneib J.-P., Cowie L.L., Blain A.W., et al., 1999, MNRAS, 308, 1061
- [Smail et al. 2000] Smail I., Ivison R.J., Owen F.N., Blain A.W., Kneib J.-P., 2000, ApJ, 528, 612
- [Stocke et al. 1991] Stocke J.T., Morris S.L., Gioia I.M., Maccacaro T., Schild R., et al., 1991, ApJS, 76, 813
- [Stocke et al. 1999] Stocke J.T., Perlman E.S., Gioia I.M., Harvanek M. 1999, AJ, 117, 1967