Depletion of background galaxies due to the cluster lens CL0024+1654: and band observations
Abstract
We have obtained and band observations of the depletion of background galaxies due to the gravitational lensing of the galaxy cluster CL0024+1654 (). The radial depletion curves show a significant depletion in both bands within a radius of from the cluster center. This is the first time depletion is detected in the band. This gives independent evidence for a break in the slope of the band luminosity function at faint magnitudes. The radially averaged band depletion curve is broader and deeper than in the band. The differences can be attributed to the wavelength dependence of the slope of the luminosity function and to the different redshift distribution of the objects probed in the two bands. We estimate the Einstein radius, , of a singular isothermal sphere lens model using maximum likelihood analysis. Adopting a slope of the number counts of and using the background density found beyond we find and in the and band, respectively. When combined with the redshift of the single background galaxy at seen as four giant arcs around from the cluster center, these values indicate a median redshift in the range to for the mag and mag populations.
keywords:
Gravitational lensing – galaxy counts – galaxies: clusters: general – galaxies: clusters: individual: CL0024+1654 – ultraviolet: galaxies1 Introduction
Gravitational lensing by clusters of galaxies affects the apparent distribution of background galaxies on the sky, provided that the slope of the galaxy number counts differs from a critical value corresponding to a balance between the dilution due to local stretching of the background sky and the density enhancement due to magnification of faint sources above the observed magnitude limit. Normally, the slope levels off at faint magnitudes, causing an apparent depletion of galaxies behind strong gravitational lenses relative to the field. This depletion signal is, under fairly general conditions, directly related to the magnification of the lens, which in turn may be used to find its surface mass density. Broadhurst et al. (1995) first pointed out the potential of this aspect of the magnification bias to estimate cluster masses and density profiles, using the so-called number count method. This method was first used for absolute mass estimation by Taylor et al. (1998), who also discuss various observational issues. Models for relating the magnification to the surface mass density (or convergence), going beyond the weak lensing approximation, were considered by van Kampen (1998) and Dye & Taylor (1998). Such models, which take into account the presence of a shear term in the magnification, are of great importance in combination with the number count method, since the shear pattern can not be measured from the background densities alone. Schneider et al. (2000) have compared the number count method to shear measurements, using maximum likelihood analysis. They find that the number count method does a better job of estimating cluster density profiles, provided that the unlensed number density of galaxies is known to a good precision. Bézecourt et al. (1999) have investigated the wavelength dependence of depletion curves, while Mayen & Soucail (2000) investigate how depletion curves depend on the cluster density profile. They also investigate how the filter bands used in observations affect the results through different sampling of the background population. Gray et al. (2000) show that the effects of incompleteness on model parameters estimated with maximum likelihood methods (Schneider et al. (2000)) may be neglected, at least under the standard assumption that the intrinsic luminosity function is a power law.
A few other methods based on gravitational lensing have been applied to cluster mass estimation. Dye et al. (2000) have studied the effects of the lens magnification on the luminosity function of background population, and applied this method to Abell 1689. Weak shear analysis, where the average distortion of the shape of background galaxies is used to estimate the shear field of the lens, has been applied to a number of clusters (e.g. Smail & Dickinson (1995); Luppino & Kaiser (1997); Clowe et al. (1998); Hoekstra et al. (2000); Joffre et al. (2000); Athreya et al. (2000), and references therein). Strong lensing effects have also been used to probe the density distribution in clusters (e.g. Tyson et al. (1998); Broadhurst et al. (2000)), and statistical studies of arclets are being pursued (e.g. Bézecourt et al. (1999)). The theoretical and observational aspects of gravitational lensing and its applications have recently been reviewed in Mellier (1999) and Bartelmann & Schneider (1999).
To date, depletion of background galaxies has been observed in connection with a handful of clusters. Fort et al. (1997) were the first to report on depletion in the and band behind CL0024+1654. Their observations were however plagued by a low density of objects and an uncertain background estimate as discussed by van Kampen (1998). Taylor et al. (1998) found depletion in the band in Abell 1689, after careful removal of cluster and foreground objects using additional color information. Mayen & Soucail (2000) find depletion of faint , , , and objects towards MS1008–1224. This cluster can possibly be used to investigate how background clustering affects the depletion analysis, since Athreya et al. (2000) have tentatively detected another cluster in the background (at ). Finally, Gray et al. (2000) have explored depletion at near-infrared wavelengths in Abell 2219. Depletion analysis in the infrared (IR) benefit from a low slope of the number counts already at moderately faint IR magnitudes, but the low background number density may outweigh the benefits.
In our work, we apply the number count method in the and band to the rich cluster CL0024+1654 (z=0.39), first observed to be a strong gravitational lens by Koo (1988). The filter is well suited for depletion studies, provided that the observations are deep enough to probe galaxies fainter than where the slope of the luminosity function in the band levels off (Williams et al. (1996); Pozzetti et al. (1998), but see e.g. Hogg et al. (1997); Volonteri et al. (2000) for evidence against this), while the slope in the band is low enough to accommodate depletion studies given sufficient number of background objects. With sufficiently deep observations, depletion analysis in these two widely separated bands will also reflect the different sampling of the background redshift distribution. The large Einstein radius of CL0024+1654, inferred from the position of giant arcs around from the cluster center, and previous detection of depletion in the and band (Fort et al. (1997)) make this cluster a good candidate for depletion studies. Moreover, its mass and mass distribution have been studied carefully with other methods.
From the redshift catalog compiled by Dressler et al. (1985), Schneider et al. (1986), and Dressler & Gunn (1992), a velocity dispersion of km s-1 is found, resulting in a mass of roughly within a radius of Mpc. (The Hubble parameter is km/s/Mpc.) A much larger sample of redshifts in the cluster field has recently been obtained by Dressler et al. (1999) and Czoske et al. (1999). Analysis of this data leads to a considerably lower velocity dispersion, km s-1, for the 227 cluster objects identified. The estimated mass is consequently lower. For example Czoske et al. (1999) find a mass of within Mpc.
From a detailed inversion of the lens using mainly the giant arcs, which are the multiple images of a single background galaxy, Tyson et al. (1998) find the central mass distribution to be very relaxed, with no signs of substructure within kpc. On the other hand, Broadhurst et al. (2000) find evidence for substructure on the cluster core scale. Their mass estimate for the innermost kpc is , or somewhat lower than the estimated by Tyson et al. (1998). Their model does however predict an unrealistically high velocity dispersion for the cluster (Shapiro & Iliev (2000)).
On a much larger scale, Bonnet et al. (1994) using weak shear analysis find a mass of within a radius of Mpc. Analysis of X-ray observations by Böhringer et al. (2000) and Soucail et al. (2000) shows a discrepancy of about a factor between X-ray and lensing mass, similar to what is found in many other clusters. The difference is most probably attributable to simplified assumptions about the dynamical state of the cluster. Finally, van Kampen (1998) used the depletion observations by Fort et al. (1997) to constrain the mass of the cluster, noting that a better estimate of the unlensed background density was needed to give reliable results.
In order to constrain the mass distribution of the cluster using our data, additional information is needed on various properties of the background sources. The unlensed average density, redshift distribution, and the slope of the number counts of the background sources all play a role in relating the observed depletion to the convergence of the lens. In this paper, we present the first band observations of depletion and apply simple parametric modeling to our and band data to investigate the dependence of the model on the a priori parameters. A more detailed investigation of the mass distribution implied by our data is being undertaken (van Kampen et al., in preparation).
2 The data
2.1 Data acquisition and reduction
The data were obtained with the ALFOSC instrument on the Nordic Optical Telescope in August 1999. The field-of-view was 6.5 with a pixel size of . The total integration time in the (Cousins) band was 37 ksec and 8.7 ksec in the (Cousins) band with average seeing of and , respectively. The formal detection limits in the final drizzled images are = 27.2 mag and = 27.5 mag. (We use AB magnitudes throughout, using a simple shift of +0.71 mag and +0.199 mag to convert from the observed Cousins and magnitudes, respectively (Fukugita et al. (1995)).
Standard bias and flat field corrections were made to the data before stacking the individual frames using tools from the ditherII package (Fruchter & Hook (1997); Mutchler & Fruchter (1997); Hook et al. (1999)) in IRAF. Shifts were estimated by cross-correlating images and cosmic rays masked out using the blotting technique as described by Mutchler & Fruchter (1997). The original pixel scale was retained and no attempt was made to correct for field distortions.
2.2 Photometry and completeness
The calibration against photometric standards (mainly in M92 (Davis (1999)) and a few standards from Landolt (1983)) gives formal errors of mag and mag. Typical photometric errors estimated by the detection software are between mag for the magnitude ranges . (This is the magnitude range used below to select background objects for the depletion analysis.)
In order to estimate the level of completeness as a function of magnitude in our data, 300 artificial objects were added to the science frames using the artdata task in IRAF. Completeness was estimated as the ratio between detected synthetic objects and the number of synthetic objects added. In order to improve the statistics this procedure was repeated 100 times, each time adding objects at random positions. The final average completion curves indicate that our sample is 50% complete at = mag and = .
The fraction of detections due to spurious noise peaks will steadily increase towards faint flux levels. To investigate this, frames containing only noise were generated and using SExtractor (Bertin & Arnouts (1996)), 700 apertures were dropped onto the frames. To ensure that the noise-only frames would mimic the noise characteristics of the science frames as closely as possible, they were convolved with the noise correlation function found in the science frames. By counting the number of detections per magnitude bin we can readily quantify the contamination from noise peaks. It was found that only 7% of the detections have magnitudes brighter than mag while in the frame about 9% have magnitudes brighter than mag. With this low level of noise contamination, we decided not to make any corrections for false detections.
3 Analysis
The number count method is based on the following property of cluster lenses. Under the standard assumption that the number density of background galaxies follows a power law, for a given flux limit , one finds a simple relation between the magnification of the lens, , and , the number density of background objects as observed through the lens,
| (1) |
Here is the position on the sky. In practice, one observes the local galaxy distribution down to a limiting magnitude, , so that the cumulative normalized number density is often written as
| (2) |
with being the slope of the (unlensed) differential galaxy number counts. By inverting Eq. (2), it is therefore possible to measure the magnification field, , provided that a sample of background sources can be isolated, e.g. on the basis of color and magnitude (Sec. 3.4), and that the parameters and for this sample can be determined to a sufficient accuracy. In the following sections, we shall discuss these issues, and present detailed analysis of the observed density field in the form of radially averaged depletion curves and maximum likelihood analysis.
3.1 Source extractions
The first step in the analysis of the final images is to extract the sources. Source extraction was done with both SExtractor (Bertin & Arnouts (1996)) and ImCat (Kaiser et al. (1995)), with comparable results. The ImCat results were used to identify stars, based on half-light radii, but the rest of the analysis below is based on the information extracted by SExtractor. The full set of SExtractor object catalogs used here is available at the CDS and ADC catalog archives.
We have performed extensive analysis of simulated data, using noise characteristics from the final reduced images, to find optimal adjustments of the various parameters of the detection software (see Greve (2000) for details). For SExtractor, these considerations resulted in choosing a detection threshold of per pixel, combined with a Gaussian filtering kernel (FWHM of 5 pixels, roughly corresponding to our seeing of 6 pixels), and a minimum detection area of 10 pixels. The complete SExtractor parameter files used are available at the aforementioned website.
When selecting objects for further analysis from the catalogs produced by SExtractor, we leave out objects which have internal flags larger than 3. This excludes objects with saturated pixels, objects that have been truncated, and objects with corrupt isophotal or aperture data.
3.2 Galaxy number counts
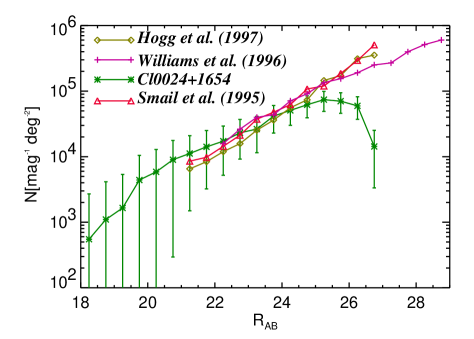
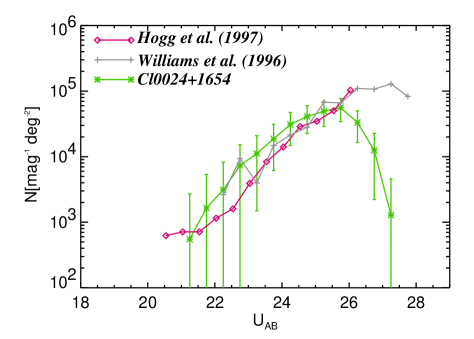
The original motivation for using band observations for depletion studies was the indication of a break in the galaxy number counts at faint magnitudes reported by Williams et al. (1996). They found a logarithmic slope for dropping to in the range . A more detailed analysis of the HDF number counts by Pozzetti et al. (1998) shows that the slope drops to at , with an allowed range of .
The differential number counts in our field are shown in Fig. 1 for the and band. The overall higher level of bright band objects in our data relative to the counts from Smail et al. (1995), Williams et al. (1996), and Hogg et al. (1997) is simply due to the presence of the cluster. A similar effect is seen in the band. The net result of this and the incompleteness at faint magnitudes is to lower the logarithmic slope of the differential number counts. This is evident from Fig. 1a, where we find a slope of in the magnitude range , compared to an estimate of for the other data in the same magnitude range.
It is evident that our data is incomplete beyond and . This is consistent with our completeness estimates, but as shown by Gray et al. (2000), the incompleteness does not affect the depletion analysis, as long as the field used to estimate the average background density has the same completeness characteristics. It means, however, that we are unable to determine the slope at the faint end of the luminosity function, and must rely on estimates from deeper observations. The slope in the magnitude interval used in the depletion analysis (section 3.6) is likely to be varying from a value close to at = 24 to the value found by Pozzetti et al. (1998) at . Similarly, the band slope is dropping from a value of or so at bright magnitudes (Smail et al. (1995); Hogg et al. (1997)) to 0.18 at the faint end (=27) of the selected magnitude interval, in accordance with the slopes found in the and bands from HDF data (Williams et al. (1996), see also Madau & Pozzetti (2000)).
3.3 Color-magnitude diagrams
We find the color by first detecting and measuring the magnitudes in the band. The catalog is then matched to the band image by running SExtractor in “assoc” mode with a search radius of 6 pixels, appropriate to compensate for our seeing and error in the alignment between the and images. In this way, 1229 objects are found when associating the image with the full catalog. These objects comprise our “matched” catalog.
In Figs. 2a and 2b we show the color-magnitude diagram for all the objects in the matched catalog after removal of stars (the distinction between stars and galaxies was based on the analysis of half-light radii). The formal detection limits in and are indicated by dashed lines, and the color and magnitude cuts used to select background objects are shown with dash-dotted lines (see Sec. 3.4). The bluing trend at faint and magnitudes (e.g. Hogg et al. (1997)) is reflected in the negative slope of the lower edge of the “wedge” shaped region that the objects populate. This effect is especially pronounced in Fig. 2a.


The color-magnitude diagrams clearly show a lower density of objects around =3, also seen in and band data we have obtained for the cluster MS1621+2640 (van Kampen et al., in preparation). By combining our photometric data with redshifts from the survey of Czoske et al. (1999) and Dressler et al. (1999) for the CL0024+1654 field, we find that the color of the cluster galaxies shows a distinct bi-modal distribution, with a minimum around =3 and a large fraction above =3. This distinction is not seen for the field galaxies in the redshift survey, suggesting that mostly cluster galaxies will be discarded by selecting only galaxies bluer than =3. This can also be inferred from the distribution of confirmed cluster galaxies, marked by ’+’, in the color-magnitude diagrams. The radial gradient observed for color in many clusters (see e.g. Morris et al. (1998)) is also seen in the color. These features are suggestive of a strong correlation between star formation activity in cluster galaxies and the cluster environment. We shall investigate this aspect of the data in greater detail in a forthcoming paper (van Kampen et al., in preparation).
3.4 Selection of background candidates
For the depletion analysis, it is important to remove cluster and foreground galaxies from the object catalogs as the number density of cluster galaxies typically increases towards the center, interfering with radial gradients in the number density of the background. In line with the discussion above on color-magnitude diagrams, we chose to use simple limits on magnitudes and color, restricting the depletion analysis to the magnitude ranges and to objects bluer than . The limiting band magnitude of 27.2 implies that band objects in the magnitude range that have a well defined counterpart in the band image are all bluer than =3, as can be seen from figure 2a. Therefore, the exclusion of objects redder than =3 will only affect the selection of background objects in the band.
The background samples are constructed by first selecting objects in the magnitude ranges from the full and band catalogs. In order to exclude the red (cluster) objects, one could in principle extract the background sample from the matched catalog, with the additional constraint on color. Doing this, however, one tends to miss primarily the faintest objects, partly because some of the objects are simply too faint in to be detected, and vice versa, as well as because the association is more difficult the fainter the object is. We avoid this drawback by constructing masks (using the shape parameters estimated by SExtractor) covering the objects in the matched catalog. The objects that fall on these masks are then deleted from the background samples.
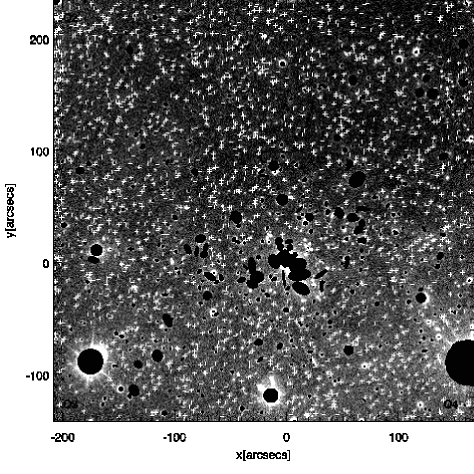
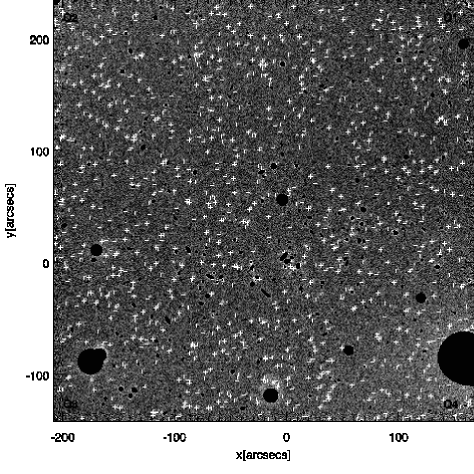
In addition, the masks are augmented with the bright objects (), to cover the parts obscured by the foreground and cluster candidates in the corresponding image (see figure 3). The estimated (Poisson) errors for the depletion curves are corrected for the effective area of each annulus of the radial averaging by subtracting off the number of pixels in the mask from the pixelized area of the annulus. The correction due to the mask is quite important for the innermost bins, especially in the band, where the bright cluster galaxies obscure a large fraction of the area. Hence, the innermost bins have the highest uncertainty due to the small effective area.
3.5 Depletion analysis
Radial averaging is typically used to boost the significance of the depletion signal (e.g. Taylor et al. (1998); Mayen & Soucail (2000)). The number density is estimated by counting the number of objects in annuli around the cluster center. This average density is normalized by an (independent) estimate of the unlensed background density of the same class of objects resulting in a radial depletion curve. The width of the annuli, , may be adjusted to obtain a reasonable balance between smoothing and shot noise. We calculate the number density averaged over wide annuli as a function of radius from the cluster center, taken to be the center of light ( and ) of the image within radius after a few bright stars and a foreground galaxy have been masked out. The number counts are normalized to the background density, , estimated as the average density of the corresponding objects in the annulus between . This assumes that the cluster does not affect the background significantly beyond . (Ideally, the unlensed background density should be estimated from a separate field, known not to be affected by strong foreground lenses.) We find values of arcmin-2 and arcmin-2, with 1084 and 1780 selected background objects in the and band, respectively. (The uncertainties quoted are jackknife estimates, see below.)
The obscuration by the masks (separate for each band) is taken into account in determining an effective area, , for each annulus, . The uncertainties may as a first approximation be taken to be due only to Poisson noise in the counts, so that
where are the actual number counts in the annulus centered on , and is the expected number of counts in the annulus. Then,
Given an uncertainty in the absolute background density, , a more conservative estimate of the uncertainty is
| (3) |
We have made simple estimates of the intrinsic uncertainty in due to non-uniformity of the background, effects of bright objects, etc, by masking out each of the four quadrants of the images in turn, numbered counter-clockwise from the NE quadrant. The four values of the background obtained in this way are then used to form a standard jackknife estimate the variance of . We find that and . The errors indicated on Fig. 4a and 4b include a fractional uncertainty of and , respectively. Note, that an error in only affects the normalization of the depletion curve, while the relative depletion does not change. The estimated background density in the band is strongly influenced by quadrant 2, where the density of selected objects is markedly higher than in the other three quadrants. The form of the depletion curves is however robust. The variation in the band may at least partly be explained by a higher background flux in quadrants 3 and 4, due to bright stars. The background flux in the band is more uniform across the whole field. The estimated values of should only be taken as an indication of the level of uncertainty in .
The depletion curves in the and band are shown in Fig. 4. A clear sign of depletion is seen in both bands. In the band the density falls steadily from a radius of around all the way to the center. Most lens models predict a turn-up in the density inside the innermost critical line; the indication seen here in the innermost two bins is non-significant due to the obscuration of the foreground galaxies. On the other hand, it is easier to detect faint background objects closer to the cluster center in the band, since the dominant cluster galaxies are all quite red. Given that we are successful in identifying cluster members, the observed turn-up is quite sharp and significant in the band.
Our data is not complete to sufficiently faint magnitudes to allow estimation of the slopes and , for the magnitude ranges involved. However, we find that most of the depletion signal in the band is due to galaxies with , which indicates that the slope has already dropped well below in this magnitude range. This is at odds with the results of Hogg et al. (1997), who found a slope of down to , roughly corresponding to =26.3. The recent investigation by Volonteri et al. (2000) of the HDF-S shows no evidence of a break either, down to the faintest magnitude bin of =26.5.
Although the data may not warrant a detailed quantitative interpretation of the depletion curves, especially when taking the uncertainty in the slope, , and unlensed background estimate, , into account, it is in principle possible to use multiband depletion measurements to constrain the properties of the background population (see e.g. Taylor et al. (1998); Bartelmann & Schneider (1999); Mayen & Soucail (2000), and references therein) due to the dependence on the slope of the luminosity function. The redshift distribution of the background objects will also affect the width and position of the minimum of the depletion curve, essentially through the dependence of the Einstein radius on the lens-source distance. In Fig. 4, we compare the radially averaged data to the singular isothermal sphere (SIS) model described in section 3.6. In case of the band depletion curve, results for and are shown, with the Einstein radius . In addition, we show the theoretical depletion curve for and . The band depletion is compared to models with and , with a fixed Einstein radius of , as well as to and . (This choice of parameters is dictated by results of the maximum likelihood analysis in section 3.6.) We note that the depletion curve is better represented by the and models in the and bands, respectively.


3.6 Einstein radius estimates
We use the maximum likelihood approach developed by Schneider et al. (2000) and Gray et al. (2000) to investigate the depletion in more detail. A singular isothermal sphere (SIS) model, where the magnification is a simple function of the distance from the center of the lens, , and its Einstein radius,
is used to calculate the likelihood as a function of a single parameter, the Einstein radius . Recall, that the theoretical depletion curve is in this case given by
where the slope of the luminosity function is . For simplicity, we adopt a constant slope, noting that a proper treatment of our data would take the variation in into account, since we are very likely probing a transition region in both the and bands. We take the (unknown) uncertainty in the unlensed background density into account, using the likelihood function (see Gray et al. (2000), Eq. (10)),
| (4) | |||||
where , and
| (5) |
with . The first term in Eq. (4) stems from the likelihood of observing a total of galaxies in the whole field, while the second term is the log-likelihood for finding those galaxies at the observed positions in polar coordinates. The third term is just a normalization, but is needed in this case as we include prior information on , taken to be a Gaussian with mean and dispersion . The maximum likelihood estimate of is then given by Eq. (5), and is inserted back into Eq. (4) to obtain the log-likelihood. Note, that the model parameters ( in the SIS case) are all hidden in the magnification .
To assess the effect of the uncertainty in we study four values of the dispersion by setting , 0.05, 0.1, and 0.15. The highest value is probably a conservative estimate taking clustering of the background into account, given the latest measurements of the two point correlation function (Fynbo et al. (2000)), which indicate insignificant correlation beyond for the magnitude range considered here. The estimated amplitude of the two point correlation function in the band is even lower (Brunner et al. (2000)), making the band depletion less sensitive to errors due to clustering. Possible bias in the estimated unlensed density is studied by shifting up by 10%. We would expect the estimated to be biased low relative to the true value , since the depletion due to the cluster probably extends beyond the inner radius . Contamination by cluster members would however work in the other direction, and it is difficult to disentangle the two effects with our data. By varying the inner radius from to we find that the band background density is quite stable, while in the band does indeed increase by roughly 10%, going to 54 arcmin-2 at .
We also study the dependence of the estimated Einstein radius on the slope in the range . In the band, is appropriate for , but since 50% of the selected background galaxies in the magnitude range are brighter than this, we expect the effective slope to be steeper. Similarly, in the band, the slope at the bright end is of order 0.32, dropping to at the faint end (Smail et al. (1995); Williams et al. (1996); Madau & Pozzetti (2000)). As 50% of the background candidates have , the effective slope probably lies in this range. The uncertainties, , quoted below are estimated as the width of the likelihood function, ,
| (6) |
where is the estimated value of the Einstein radius, corresponding to the maximum of .
The results of this analysis for the and band are shown in Fig. 5, where the estimated Einstein radius, , is plotted as a function of the slope for values of the dispersion parameter in the expected range . The error bars indicate . The estimated grows with increasing , up to where the theoretical depletion signal vanishes. The effect of increasing is to lower the log-likelihood at small , so that local maxima at higher take over as global maxima, causing discrete jumps in the plots. Increasing tilts the curve upwards at high , but for the estimated is not very sensitive to this parameter. Assuming that our unlensed background estimate is biased low relative to the true value by about 10%, we find that even the estimates of are compatible with the cases. The dependence of the log-likelihood on the parameters and is shown in Fig 6 where we plot as a function of the Einstein radius, , for selected values of these parameters. We simply tabulate with and take the estimated Einstein radius to be the where the tabulated function is maximized. The dips in the curves are caused by galaxies that happen to lie close to the current (the critical line being tested), where the second term in Eq. 4 dominates, and the probability of finding a galaxy vanishes.


From Fig 5a we see that for slopes the estimated Einstein radius is in the band with a limited range of parameters suggesting a lower value of . The unbiased case results in yet a lower value of around . For the rest of the range, the maximum of occurs around , again with the unbiased case as an exception. Similar features are seen in the band (Fig. 5b), except that for any given set of parameters the estimates are always lower than in the band. In any case, the band Einstein radius of found for and is within the uncertainty of the other estimate of found for the and the biased models. The unbiased model is compatible with for where the peak in takes over. Since the giant arcs seen at around distance from the cluster center are the multiple images of a galaxy at (Broadhurst et al. (2000)) it seems reasonable to reject any estimates that exceed this value. It must however be emphasized that this analysis is based on a single underlying model (SIS) and the final constraints on the parameters , , and must come from reliable deep galaxy counts. To summarize, our analysis indicates that the Einstein radius may be slightly lower in the band compared to the band, suggesting a lower median redshift for the band objects.
For comparison, we have also calculated the likelihood function for a truncated isothermal sphere (TIS) model, with a core radius of in accordance with results found from strong lensing (Tyson et al. (1998); Broadhurst et al. (2000)) and X-ray observations (Böhringer et al. (2000)). The TIS model is given by equation (8) in Mayen & Soucail (2000). The estimated Einstein radius in the TIS model is almost identical to the SIS results, as expected from the small core radius. Finally, we have checked that our results are insensitive to a more stringent selection of band objects by redoing the analysis for the magnitude range . For and this shifts the estimated Einstein radius slightly outwards, to around . This is to be expected, as the fainter sample will have a higher median redshift.
4 Discussion and conclusions
The applicability of lensing methods to determine cluster masses and density profiles has been a major issue since it became viable to detect lensing signatures. Using strong lensing effects, where background galaxies are stretched into giant arcs and/or show up as multiple images, it is possible to probe the cluster potential roughly out to the Einstein radius. On larger scales, the shear and depletion due to the lens may be used to constrain its mass distribution, once these lensing effects are disentangled from the intrinsic properties of the sources.
From simple arguments, it can be shown that shear detections have a higher signal-to-noise ratio than magnification detections with the number count method (Mellier (1999); Bartelmann & Schneider (1999)). It must however be emphasized, that from the observational point of view it is easier to obtain deep galaxy number counts than detailed shear maps that require good seeing and accurate determination of the PSF for deconvolution. Note also, that ground based shear detections are limited to galaxy sizes above the seeing limit. With seeing in the band this corresponds to , giving a galaxy number density of roughly arcmin-2. Depletion analysis on the other hand benefits from detections up to the magnitude limit, so that with deep enough observations one can get much higher counts. Another aspect in favor of the number count method is that it is not subject to the “sheet-mass degeneracy” of the shear analysis (e.g. Schneider et al. (2000)). This does, however, not come for free, since absolute surface density measurements using depletion require an accurate determination of the unlensed background density (Schneider et al. (2000)). The intrinsic uncertainties due to the combination of observational errors, including contamination from foreground objects and false detections, and clustering of the background population, certainly plague the number count method. In some wavelength bands these uncertainties make it difficult to obtain significant constraints on model parameters (Gray et al. (2000)).
Our data and analysis show that detailed inferences from the present data are to some extent sensitive to poorly known a priori parameters (, , , …) making it difficult to set strong limits on the parameters of the lens model. However, we do find compatible results for the two bands when the slope of the differential number counts of the background objects, , is lower than independent of the uncertainty in the unlensed background densities. It is worth noting, that the band depletion curve is both shallower and narrower than the band depletion, suggesting a steeper slope (Mayen & Soucail (2000)) in the band. The two extreme values of the Einstein radius, and , found from the and band data respectively for , may be used together with the observed Einstein radius, , associated with the single background galaxy at (Broadhurst et al. (2000)) to estimate the median, , of the redshift distribution of the background galaxies. In the case of a flat cosmology, we find that the ratio corresponds to while corresponds to . This latter value is in good agreement with the models of Mayen & Soucail (2000), although the incompleteness of our data at faint magnitudes and the different filters used make a direct comparison difficult. Note also, that taking into account the uncertainty on the typical band Einstein radius estimate of and the band estimate of these two values do not differ significantly.
The maximum likelihood analysis estimates of the Einstein radius using a singular isothermal sphere model is consistent with the observed giant arcs, provided that the slope . The estimated Einstein radius is independent of the dispersion of the unlensed background density, parameterized by , provided that our estimate of the background density is biased low. We would indeed expect that to be the case since the cluster is likely to deplete the background density beyond the assumed in our estimation of the background density. We conclude that although it is difficult to draw strong conclusions about e.g. the different galaxy populations probed with the two bands without a more rigorous treatment of the effects of a variable and firmer estimates of the unlensed background densities, we do get results that are consistent with results obtained by different methods by others.
One of the main aims of our work was to look for depletion of background galaxies in the band. Our data clearly show this effect towards the cluster CL0024+1654, giving independent evidence for a flattening to a slope () at the faint end of the band luminosity function. While the reality of this flattening is still debatable (e.g. Pozzetti et al. (1998); Volonteri et al. (2000)), further depletion studies in the band will help to constrain the slope of the number counts in this band. It is clear that ultimately the shape of the number counts at faint band magnitudes must be determined from deep, reliable observations in the field. This would also settle the absolute unlensed density of background sources, both of which is necessary for making band depletion a reliable tool in cluster studies.
As the dominant cluster galaxies are relatively faint in the band, we are able to measure the background number density close to the cluster center accurately enough to find a significant turn-up in the density as expected from simple lens models. This strengthens the indication of a turn-up in the band, where the estimated background density is starting to increase before reaching the innermost parts of the cluster where the foreground objects cover a too large fraction of the available area to warrant a significant measurement.
With the present data, where the background density is of order arcmin-2, the inherent uncertainties of the number count method still give rather loose bounds on lens model parameters, both when fitting models to radially averaged depletion curves, and when more elaborate maximum likelihood analysis is applied. It goes without saying that with deeper number counts towards lenses, and better estimates of the properties of the unlensed background population, the reliability of the number count method will increase. Some of the difficulties of the parametric modeling inherent to these methods may however also be alleviated by using more sophisticated, non-parametric methods. We plan to study this in more detail for the data presented in this paper.
Acknowledgements
This work was supported in part by the Danish Research Foundation (through its establishment of the Theoretical Astrophysics Center), The Icelandic Research Council, The Research Fund of the University of Iceland, The Danish Natural Science Research Council (SNF), and by the “Access to Large-Scale Facilities” program of the European commission of the EU. The Nordic Optical Telescope is operated on the island of La Palma jointly by Denmark, Finland, Iceland, Norway and Sweden, in the Spanish Observatorio del Roque de los Muchachos of the Instituto de Astrofisica de Canarias. We are indebted to Ian Smail, David Hogg, and Lucia Pozzetti for providing data on galaxy number counts, and to Oliver Czoske for providing redshift data for CL0024+1654. We thank the referee for useful comments and suggestions.
References
- Athreya et al. (2000) Athreya R., Mellier Y., van Waerbeke L., Fort B., Pelló R., Dantel-Fort M., 2000, A&A, submitted
- Bartelmann & Schneider (1999) Bartelmann M., Schneider P., 1999, Weak gravitational lensing
- Bertin & Arnouts (1996) Bertin E., Arnouts S., 1996, A&AS, 117, 393
- Bézecourt et al. (1999) Bézecourt J., Kneib J.-P., Soucail G., Ebbels T. M. D., 1999, A&A, 347, 21
- Böhringer et al. (2000) Böhringer H., Soucail G., Mellier Y., Ikebe Y., Schuecker P., 2000, A&A, submitted
- Bonnet et al. (1994) Bonnet H., Mellier Y., Fort B., 1994, ApJ, 427, L83
- Broadhurst et al. (2000) Broadhurst T., Huang X., Frye B., Ellis R., 2000, ApJ, 534, L15
- Broadhurst et al. (1995) Broadhurst T. J., Taylor A. N., Peacock J. A., 1995, ApJ, 438, 49
- Brunner et al. (2000) Brunner R. J., Szalay A. S., Connolly A. J., 2000, ApJ, accepted
- Clowe et al. (1998) Clowe D., Luppino G. A., Kaiser N., Henry J. P., Gioia I. M., 1998, ApJ, 497, L61
- Czoske et al. (1999) Czoske O., Soucail G., Kneib J.-P., Bridges T., Cuillandre J.-C., Mellier Y., 1999, in Gravitational lensing: Recent progress and future goals. A wide-field spectroscopic survey in the cluster lens Cl0024+17. Boston University
- Davis (1999) Davis L., , 1999, private communications
- Dressler & Gunn (1992) Dressler A., Gunn J. E., 1992, ApJS, 78, 1
- Dressler et al. (1985) Dressler A., Gunn J. E., Schneider D. P., 1985, ApJ, 294, 70
- Dressler et al. (1999) Dressler A., Smail I., Poggianti B. M., Butcher H., Couch W. J., Ellis R. S., Oemler A. J., 1999, ApJS, 122, 51
- Dye & Taylor (1998) Dye S., Taylor A., 1998, MNRAS, 300, L23
- Dye et al. (2000) Dye S., Taylor A. N., Thommes E. M., Meisenheimer K., Wolf C., Peacock J. A., 2000, MNRAS, submitted
- Fort et al. (1997) Fort B., Mellier Y., Dantel-Fort M., 1997, A&A, 321, 353
- Fruchter & Hook (1997) Fruchter A. S., Hook R. N., 1997, Astron. Data Software and Systems, VI, 147
- Fukugita et al. (1995) Fukugita M., Shimasaku K., Ichikawa T., 1995, PASP, 107, 945
- Fynbo et al. (2000) Fynbo J. U., Freudling W., Möller P., 2000, A&A, 355, 37
- Gray et al. (2000) Gray M. E., Ellis R. S., Refregier A., Bézecourt J., McMahon R. G., Beckett M. G., Mackay C. D., Hoenig M. D., 2000, MNRAS, submitted
- Greve (2000) Greve T., 2000, Master’s thesis, University of Copenhagen
- Hoekstra et al. (2000) Hoekstra H., Franx M., Kuijken K., 2000, ApJ, 532, 88
- Hogg et al. (1997) Hogg D. W., Pahre M. A., McCarthy J. K., Cohen J. G., Blandford R., Smail I., Soifer B. T., 1997, MNRAS, 288, 404
- Hook et al. (1999) Hook R. N., Pirzkal N., Fruchter A. S., 1999, Astron. Data Software and Systems, VIII, 337
- Joffre et al. (2000) Joffre M., Fischer P., Frieman J., McKay T., Mohr J. J., Nichol R. C., Johnston D., Sheldon E., Bernstein G., 2000, ApJ, 534, L131
- Kaiser et al. (1995) Kaiser N., Squires G., Broadhurst T., 1995
- Koo (1988) Koo D. C., 1988, in Rubin V. G., Coyne G. V., eds, Large Scale Motions in the Universe Princeton University Press
- Landolt (1983) Landolt A. U., 1983, AJ, 88, 439
- Luppino & Kaiser (1997) Luppino G. A., Kaiser N., 1997, ApJ, 475, 20
- Madau & Pozzetti (2000) Madau P., Pozzetti L., 2000, MNRAS, 312, L9
- Mayen & Soucail (2000) Mayen C., Soucail G., 2000, A&A, submitted
- Mellier (1999) Mellier Y., 1999, ARA&A, 37
- Morris et al. (1998) Morris S. L., Hutchings J. B., Carlberg R. G., Yee H. K. C., Ellingson E., Balogh M. L., Abraham R. G., Smecker-Hane T. A., 1998, ApJ, 507, 84
- Mutchler & Fruchter (1997) Mutchler A., Fruchter A. S., 1997, Am. Astron. Soc. Meeting, 191, 4107
- Pozzetti et al. (1998) Pozzetti L., Madau P., Zamorani G., Ferguson H. C., Bruzual A. G., 1998, MNRAS, 298, 1133
- Schneider et al. (1986) Schneider D. P., Dressler A., Gunn J. E., 1986, AJ, 92, 523
- Schneider et al. (2000) Schneider P., King L., Erben T., 2000, A&A, 353, 41
- Shapiro & Iliev (2000) Shapiro P., Iliev I., 2000, ApJ, submitted
- Smail & Dickinson (1995) Smail I., Dickinson M., 1995, ApJ, 455, L99
- Smail et al. (1995) Smail I., Hogg D., Yan L., Cohen J., 1995, ApJ, 449, L105
- Soucail et al. (2000) Soucail G., Ota N., Böhringer H., Czoske O., Hattori M., Mellier Y., 2000, A&A, 355, 433
- Taylor et al. (1998) Taylor A. N., Dye S., Broadhurst T. J., Benitez N., van Kampen E., 1998, ApJ, 501, 539
- Tyson et al. (1998) Tyson J. A., Kochanski G. P., dell’Antonio I. P., 1998, ApJ, 498, L107
- van Kampen (1998) van Kampen E., 1998, MNRAS, 301, 389
- Volonteri et al. (2000) Volonteri M., Saracco P., Chincarini G., Bolzonella M., 2000, A&A, accepted
- Williams et al. (1996) Williams R. E., Blacker B., Dickinson M., Dixon W. V. D., Ferguson H. C., Fruchter A. S., Giavalisco M., Gilliland R. L., Heyer I., Katsanis R., Levay Z., Lucas R. A., MCElroy D. B., Petro L., Postman M., Adorf H. M., Hook R., 1996, AJ, 112, 1335