Morphological classification of high redshift galaxies.
Abstract
We present GASPHOT, a tool for automated surface photometry and morphological classification of galaxies in deep and wide fields. The requirements for any such tool are reviewed, and its use for the classification of high-z galaxies is presented. In the case if HDF-like images, for galaxies having a magnitude ranging from 24 to 27.5, the uncertainties on the photometric parameters derived from GASPHOT are respectively , , .
keywords:
methods: data analysis — galaxies: photometry — galaxies: classification.Appl. Opt.
Ezio Pignatelli, c/o SISSA
e-mail: pignatel@sissa.it; homepage: http://www.sissa.it/~pignatel/
1 Introduction
In the last years the Hubble Space Telescope provided very deep images of field galaxies, giving a glimpse of their very first evolutionary phases. We now have a chance to understand the basic elements of galaxy formation and evolution, but we need new instruments to handle the thousands of very faint objects that could be present in one single image.
In particular, it has been noticed that at high redshift - and for this kind of images - the Hubble classification system could be, if not totally wrong, at least not practical to use [Abraham et al. (1996)]. On the one hand, the objects in the images are small, with a typical radius of a few pixels. Thus, it is very hard to detect the fine structure elements needed to distinguish the different classes of spirals or to separate the barred and unbarred families of galaxies (but see \opencitebarred99). On the other hand, the morphological statistical analysis of the Hubble Deep Fields [Abraham et al. (1996)] showed that at high redshift () the percentage of Peculiar and Irregular galaxies could be very high (up to 30%).
Thus, the Hubble diagram does not appears very useful to distinguish between the different classes of high redshift galaxies. On the one hand, it brings plenty of details for distinguishing between sub-classes of galaxies (the spirals) that can not be separated for distant objects; on the other hand, it gives few informations about a class of galaxies (the Irregular) which is dominant at high redshift, and that we would like to split at least in truly irregular, peculiar and interacting galaxies.
For these reasons, different authors tried to build new classification systems, based on different quantitative parameters. The most used is the luminosity profile, measured either with a “concentration parameter” [Abraham et al. (1994)] or with a slope of the surface brightness profile; this can also be combined with colors, asymmetry [Abraham et al. (1996), Conselice et al. (2000)] or power spectrum in Fourier space [Takamiya (1999)].
In order to extract the valuable photometric parameters (total magnitude, optical radius, morphological type ) for the thousands of objects expected in large fields, we can not relieve on the usual photometric tool, which are optimized to be used on single objects. Such tools always involve some amount of interactivity, which is ruled out by the large number of galaxies now present. We need the photometric analysis process to be completely automatic.
While there are many tools available for the detailed surface photometry of single galaxies, there are few instruments which are build for the study of large databases of objects (and they are not for public use). Usually the extraction and “aperture photometry” is handled by tools such as FOCAS [Jarvis and Tyson (1981)] MORPHO [Odewahn (1995)] or SExtractor [Bertin and Arnouts (1996)], while the only software developed for automated surface photometry of a large number of galaxies are GIM2D [Marleau and Simard (1998)] and the HST MDS software [Ratnatunga et al. (1999)].
2 Structure and performances of GASPHOT
For the reasons described above, we started creating a photometric tool for detailed surface photometry of large images. The process is mainly divided in two steps: first, a modified version of SExtractor [Bertin and Arnouts (1996)] is used to perform the identification and aperture photometry of each object. Then a second program is used to analyze the photometric profiles and derive the main photometric parameters of each object. Taking into account the effects of the convolution with the PSF, the aperture photometry is fitted with a Sersic law with five free parameters: the total magnitude , the half-luminosity radius , the Sersic index (which will be taken as a morphological index), the flattening and the value of the local background.
The bias and errors in the determination of parameters have been estimated by running IRAF simulations of galaxies adopting the read-out noise, gain, background level and PSF of the HST WFPC2 detector.
We performed simulations with galaxies having magnitude from 23 to 27.5, and optical radii from 3 to 10 pixels. First, in order to remove the problems due to blending effects, we analyzed the results of GASPHOT on a sample of about 2000 galaxies positioned over a grid. Galaxies were assumed to follow a pure exponential or de Vaucouleurs law, but we also made a few tests with galaxies following a Sersic law with ranging up to 6. For galaxies having a magnitude of 24-27, we obtained uncertainties of , , , with no sizable bias. Using the Hubble Deep Field image parameters, the limit magnitude to obtain meaningful informations from the photometry seems to be around 27.5. The computational time seems acceptable for images with thousands of objects (about 20-30 seconds/object).
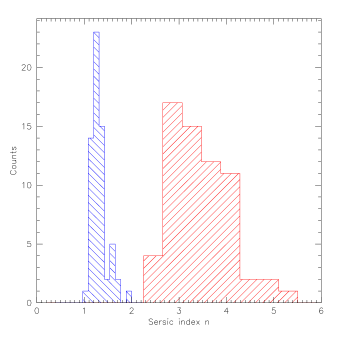
The morphological classification of the objects has been done on the basis of the Sersic index that best fits the observations. In the future, we plan to include an asymmetry parameter. While the separations between elliptical and spiral galaxies seems to be excellent (see Fig.1) we still have to test the behaviour of the software when dealing with mixed types such as S0s.
As a second, harder test, we spread 500 galaxies uniformly with a random distribution over a 1400x1400 pixel image. The test included many galaxies heavily blended or with a close companion. We also pushed our magnitude limit up to 28.5, and tested our tool to reproduce the original parameter of the galaxies. For comparison, we tested the most common software, SExtractor, on the same image. We only could
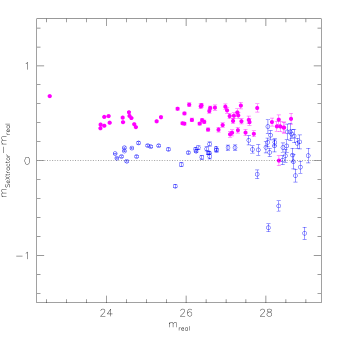
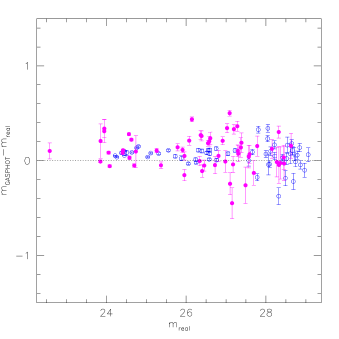
perform the test for magnitudes in this last case, because SExtractor does not provide a morphological classification or the radius (Fig. 2).
In the future, we plan to produce a morphological and photometric catalog of the Hubble Deep Fields using GASPHOT, and to extend its application to a sample of low-to-intermediate redshift clusters. We also plan to produce a public release of the software to be available in the next few months in our web page.
References
- Abraham et al. (1999) Abraham, R. G., Merrifield, M. R., Ellis, R. S., Tanvir, N. R., Brinchmann, J., 1999, MNRAS 308, 569.
- Abraham et al. (1996) Abraham, R. G., Tanvir, N. R., Santiago, B. X., Ellis, R. S., Glazebrook, K., van den Bergh, S., 1996, MNRAS 279, L47.
- Abraham et al. (1994) Abraham, R. G., Valdes, F., Yee, H. K. C., van den Bergh, S., 1994, ApJ 432, 75.
- Bertin and Arnouts (1996) Bertin, E., Arnouts, S., 1996, A&ASS 117, 393.
- Conselice et al. (2000) Conselice, C. J., Bershady, M. A., Jangren, A., 2000, ApJ 529, 886.
- Jarvis and Tyson (1981) Jarvis, J. F., Tyson, J. A., 1981, AJ 86, 476.
- Marleau and Simard (1998) Marleau, F. R., Simard, L., 1998, ApJ 507, 585.
- Odewahn (1995) Odewahn, S. C., 1995, PASP 107, 770.
- Ratnatunga et al. (1999) Ratnatunga, K. U., Griffiths, R. E., Ostrander, E. J., 1999, AJ 118, 86.
- Takamiya (1999) Takamiya, M., 1999, ApSS 269, 339